. 2018 Mar 9:15:13.
doi: 10.1186/s12014-018-9189-x. eCollection 2018.

Proteomics-based insights into mitogen-activated protein kinase inhibitor resistance of cerebral melanoma metastases

Affiliations

Proteomics-based insights into mitogen-activated protein kinase inhibitor resistance of cerebral melanoma metastases

Nina Zila et al. Clin Proteomics. .

Abstract

Background: MAP kinase inhibitor (MAPKi) therapy for BRAF mutated melanoma is characterized by high response rates but development of drug resistance within a median progression-free survival (PFS) of 9-12 months. Understanding mechanisms of resistance and identifying effective therapeutic alternatives is one of the most important scientific challenges in melanoma. Using proteomics, we want to specifically gain insight into the pathophysiological process of cerebral metastases.

Methods: Cerebral metastases from melanoma patients were initially analyzed by a LC-MS shotgun approach performed on a QExactive HF hybrid quadrupole-orbitrap mass spectrometer. For further validation steps after bioinformatics analysis, a targeted LC-QQQ-MS approach, as well as Western blot, immunohistochemistry and immunocytochemistry was performed.

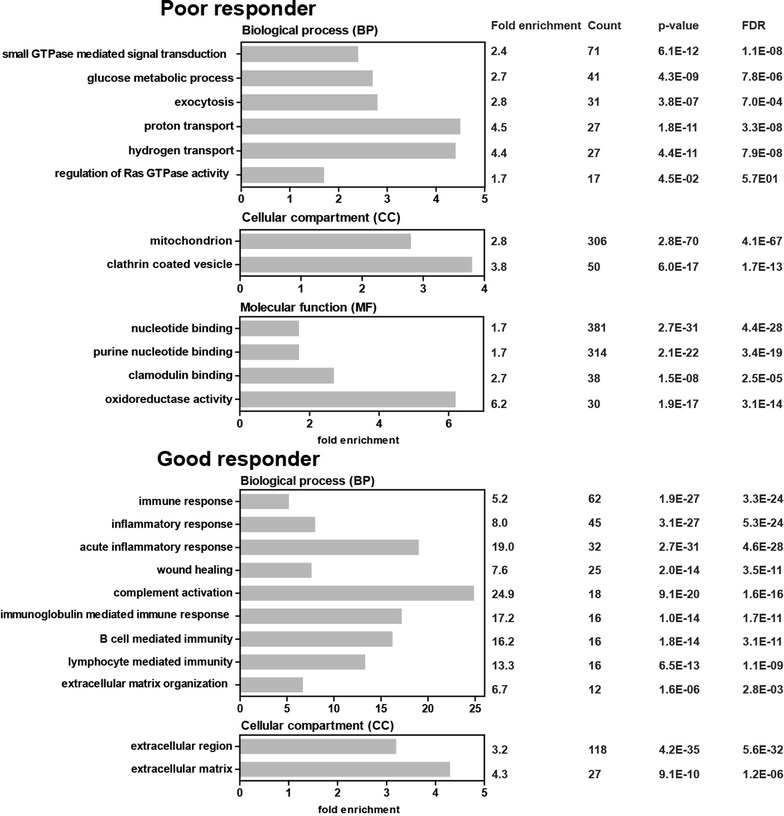
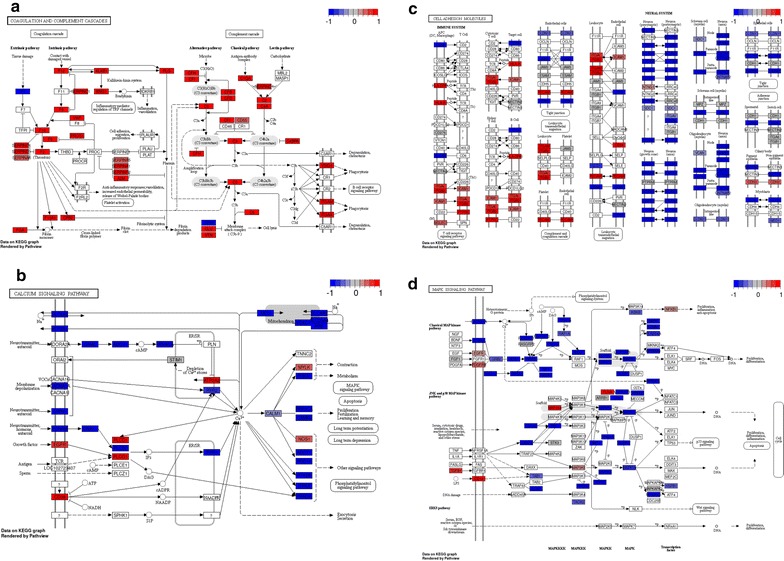
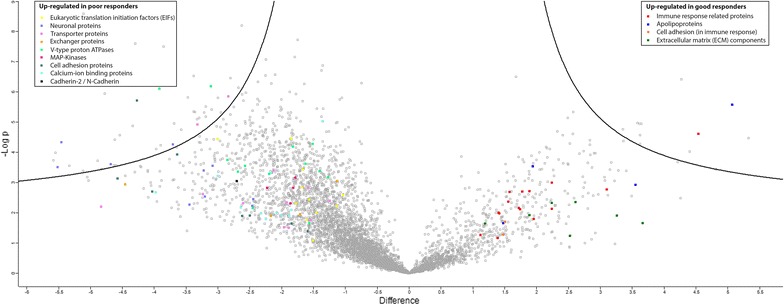
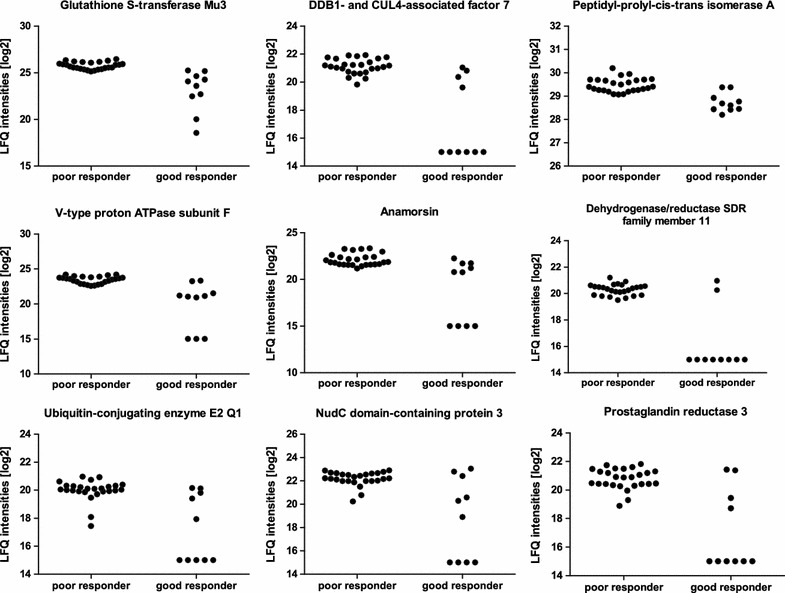
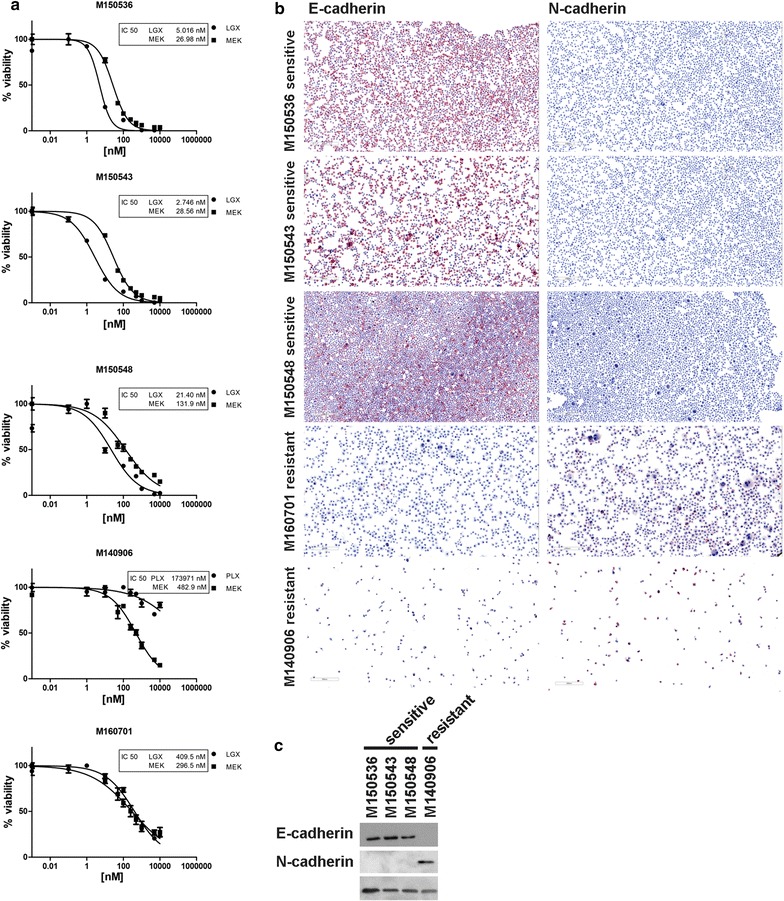
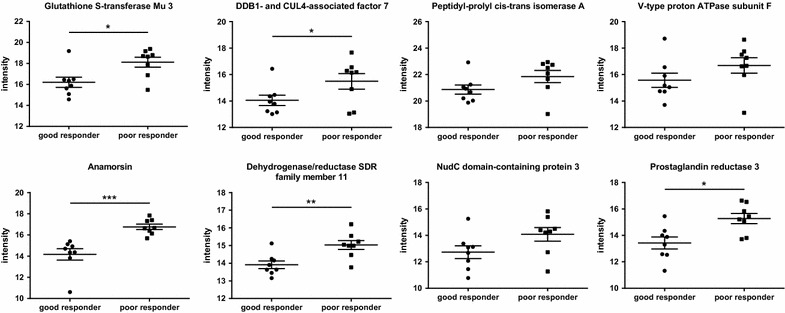
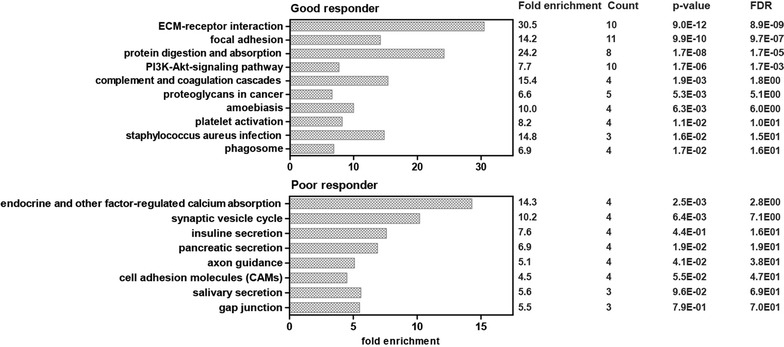
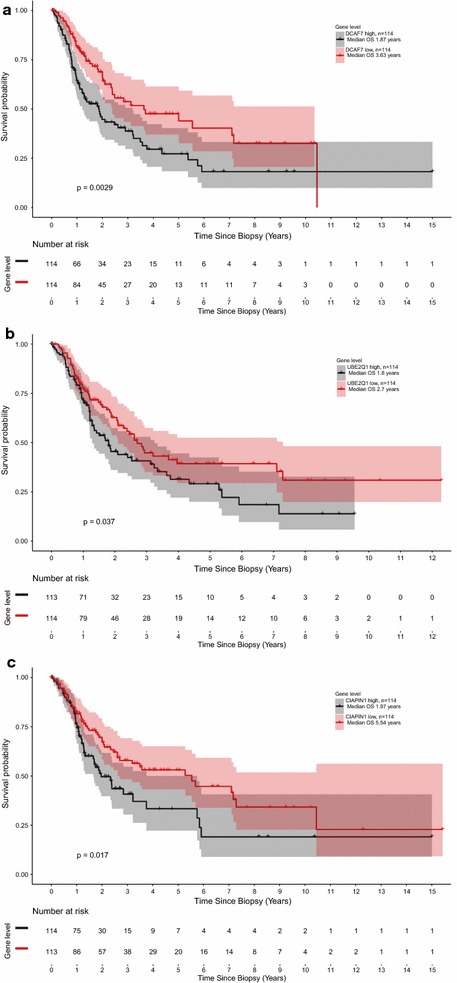
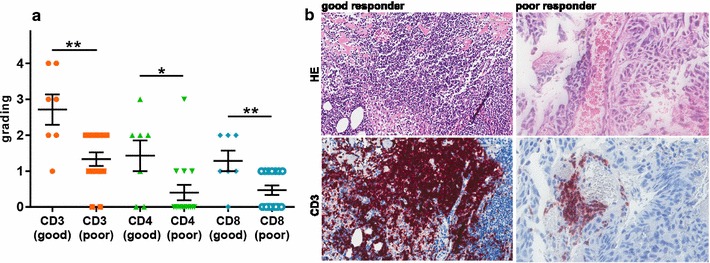
Results: In this pilot study, we were able to identify 5977 proteins by LC-MS analysis (data are available via ProteomeXchange with identifier PXD007592). Based on PFS, samples were classified into good responders (PFS ≥ 6 months) and poor responders (PFS [Formula: see text] 3 months). By evaluating these proteomic profiles according to gene ontology (GO) terms, KEGG pathways and gene set enrichment analysis (GSEA), we could characterize differences between the two distinct groups. We detected an EMT feature (up-regulation of N-cadherin) as classifier between the two groups, V-type proton ATPases, cell adhesion proteins and several transporter and exchanger proteins to be significantly up-regulated in poor responding patients, whereas good responders showed an immune activation, among other features. We identified class-discriminating proteins based on nearest shrunken centroids, validated and quantified this signature by a targeted approach and could correlate parts of this signature with resistance using the CPL/MUW proteome database and survival of patients by TCGA analysis. We further validated an EMT-like signature as a major discriminator between good and poor responders on primary melanoma cells derived from cerebral metastases. Higher immune activity is demonstrated in patients with good response to MAPKi by immunohistochemical staining of biopsy samples of cerebral melanoma metastases.

Conclusions: Employing proteomic analysis, we confirmed known extra-cerebral resistance mechanisms in the cerebral metastases and further discovered possible brain specific mechanisms of drug efflux, which might serve as treatment targets or as predictive markers for these kinds of metastasis.

Keywords: BRAF mutation; Cerebral melanoma metastases; Drug resistance; MAP kinase inhibitor; Melanoma; Proteomics.


Figures

Fig. 1
Fig. 1
Gene annotation enrichment analysis using the concept of GO annotations for poor responder (left column) and good responder (right column). Classification by the GO term biological process (BP) shows pathways and larger processes made up of the activities of multiple gene products, classification by the GO term cellular component (CC) shows where gene products are active and classification by the GO term molecular function (MF) shows molecular activities of gene products. Fold enrichment values for individual GO terms, count (genes involved in the term), p value and FDR (false discovery rate, calculated using the Benjamini–Hochberg procedure), listed next to the graph, were calculated using DAVID bioinformatics resources
Fig. 2
Fig. 2
KEGG pathway visualization of the coagulation and complement cascades (a), cell adhesion molecules (b), calcium signaling pathway (c) and MAPK signaling pathway (d). Red: up-regulated in good responder; blue: down-regulated in good responder
Fig. 3
Fig. 3
Regulation of proteins in patients with poor and good response. The volcano plot shows the difference in the LFQ values (fold change, logarithmic scale to the base of two) on the x-axis including their corresponding p values (logarithmic scale) on the y-axis. Extended information on the proteins can be found in Tables 1 and 2
Fig. 4
Fig. 4
Protein panel displays differences between poor and good responders. For each of the 9 most class-discriminating proteins (listed in Table 3), label-free quantification (LFQ) intensities in a logarithmic scale to the basis 2 are indicated. LFQ intensities for proteins not detected in a replicate were replaced by 15
Fig. 5
Fig. 5
Primary melanoma cell cultures derived from cerebral metastases. Stratification of the samples by proliferation and viability assay and calculation of the IC50 for BRAF/MEK inhibitors (a). Sensitive cells show E-cadherin positivity and N-cadherin negativity in immunocytochemistry (b) and Western blot (c), whereas resistant cells show E-cadherin negativity and N-cadherin positivity
Fig. 6
Fig. 6
Intensities from the targeted MS approach for 8 of the 9 proteins from the discriminative signature listed in Table 3. Statistics for this plot were done in MSstats (*p value < 0.05, **p value < 0.01, ***p value < 0.001)
Fig. 7
Fig. 7
Functional annotation categories calculated in DAVID (DAVID Bioinformatics Resources 6.7, National Institute of Allergy and Infectious Diseases) of correlating genes upregulated by TGFβ (EMT genes) to proteins up-regulated in brain metastasis of melanoma patients treated with BRAF and MEK inhibitors (see Additional file 4: Table S2 for full list of overlapping data between TGFβ induced signature in Microarray data and shotgun proteomics data in cerebral melanoma metastases). Fold enrichment values, count (genes involved in the term), p value and FDR (false discovery rate, calculated using the Benjamini–Hochberg procedure), listed next to the graph, were calculated using DAVID bioinformatics resources
Fig. 8
Fig. 8
Kaplan-meier plots visualizing the survival of patients for DDB1- and CUL4-associated factor 7 (a), Ubiquitin-conjugating enzyme E2 Q1 (b) and Anamorsin (c) based on The Cancer Genome Atlas dataset (TCGA, cutaneous melanoma dataset (n = 456))
Fig. 9
Fig. 9
Immunohistochemistry of FFPE cerebral melanoma metastases cohort (n = 22). Evaluation of good responders (n = 7) versus poor responders (n = 15) shows significant different expression of he T cell marker CD3 (orange; p value = 0.002), CD4 (green; p value = 0.025) and CD8 (blue; p value = 0.007) visualized in the scatter plot (a) and by examples of the staining results (b)

Similar articles

Cited by

References

    1. Markovic SN, Erickson LA, Rao RD, Weenig RH, Pockaj BA, Bardia A, et al. Malignant melanoma in the 21st century, part 1: epidemiology, risk factors, screening, prevention, and diagnosis. Mayo Clin Proc. 2007;82:364–380. doi: 10.1016/S0025-6196(11)61033-1. - DOI - PubMed
    1. Markovic SN, Erickson LA, Rao RD, Weenig RH, Pockaj BA, Bardia A, et al. Malignant melanoma in the 21st century, part 2: staging, prognosis, and treatment. Mayo Clin Proc. 2007;82:490–513. doi: 10.4065/82.4.490. - DOI - PubMed
    1. Barnholtz-Sloan JS, Sloan AE, Davis FG, Vigneau FD, Lai P, Sawaya RE. Incidence proportions of brain metastases in patients diagnosed (1973 to 2001) in the Metropolitan Detroit Cancer Surveillance System. J Clin Oncol. 2004;22:2865–2872. doi: 10.1200/JCO.2004.12.149. - DOI - PubMed
    1. Schouten LJ, Rutten J, Huveneers HA, Twijnstra A. Incidence of brain metastases in a cohort of patients with carcinoma of the breast, colon, kidney, and lung and melanoma. Cancer. 2002;94:2698–2705. doi: 10.1002/cncr.10541. - DOI - PubMed
    1. Davies MA, Liu P, McIntyre S, Kim KB, Papadopoulos N, Hwu W-J, et al. Prognostic factors for survival in melanoma patients with brain metastases. Cancer US. 2011;117:1687–1696. doi: 10.1002/cncr.25634. - DOI - PubMed