. 2018 Feb 28:9:391.
doi: 10.3389/fimmu.2018.00391. eCollection 2018.

Differential Role of Cathepsins S and B In Hepatic APC-Mediated NKT Cell Activation and Cytokine Secretion

Affiliations

Differential Role of Cathepsins S and B In Hepatic APC-Mediated NKT Cell Activation and Cytokine Secretion

Álvaro de Mingo Pulido et al. Front Immunol. .

Abstract

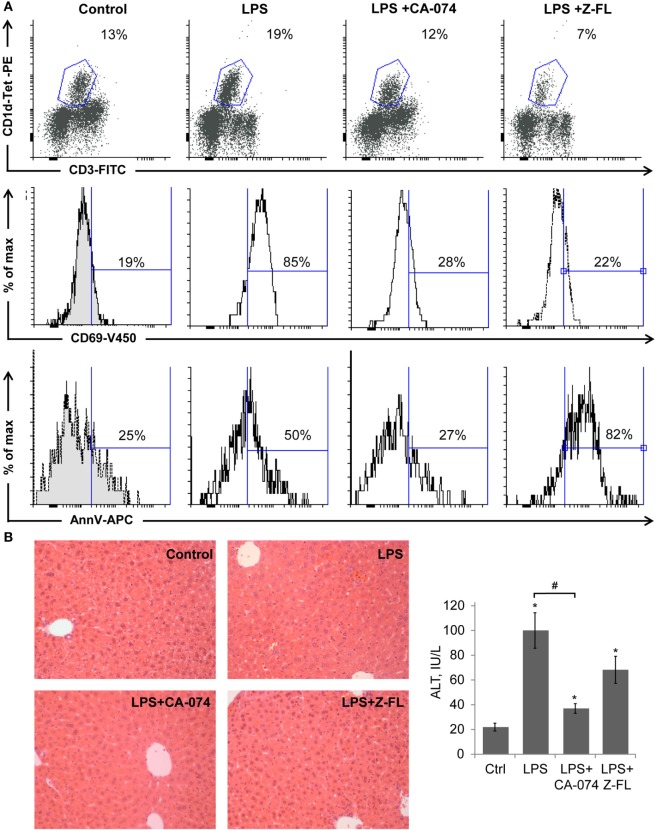
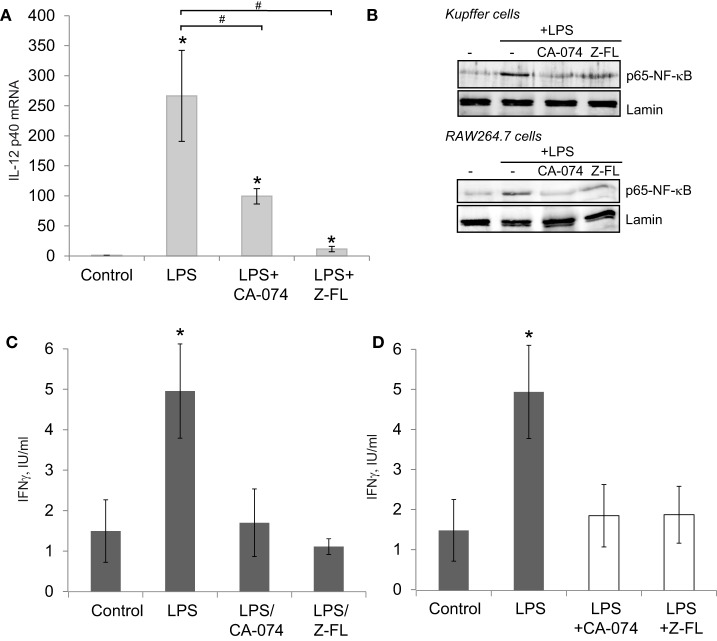
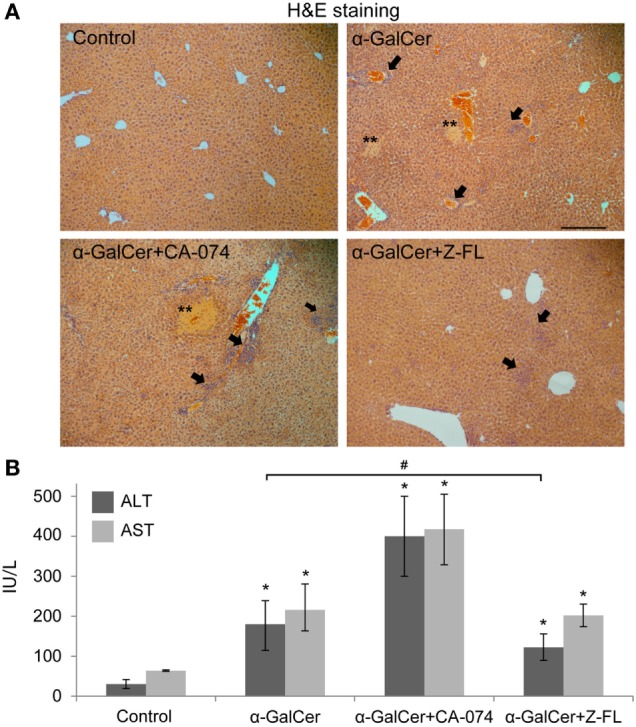
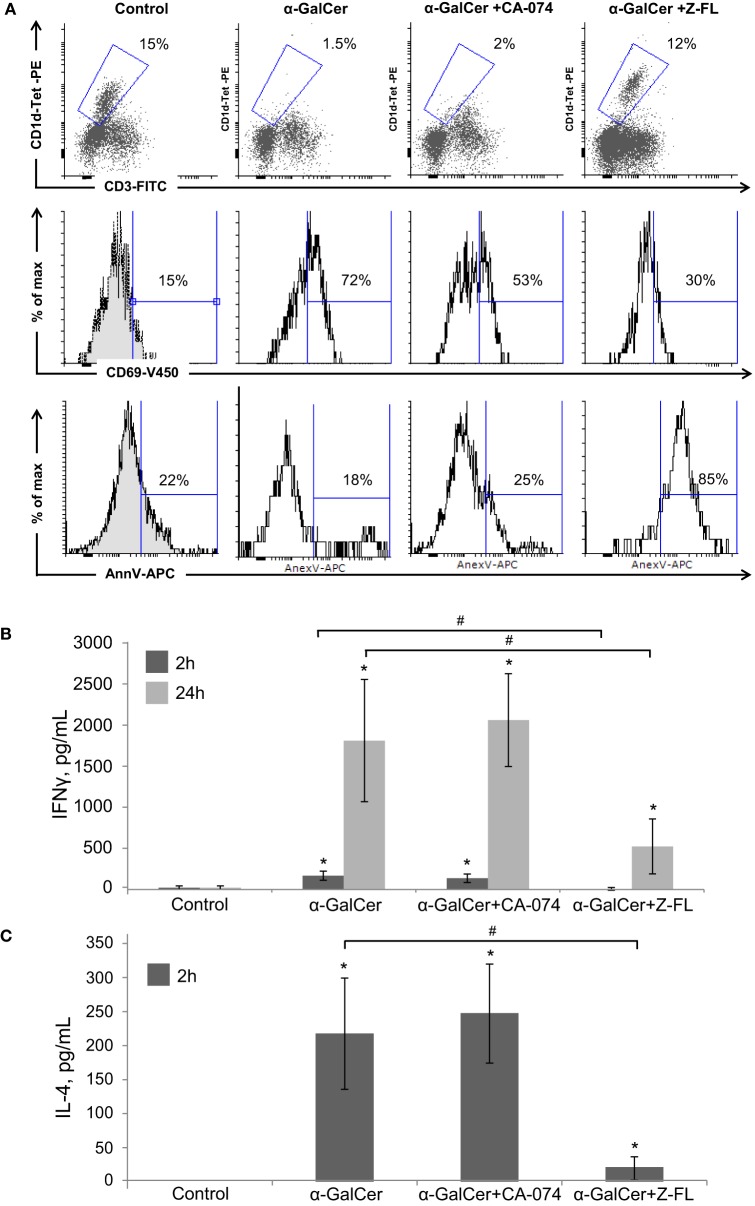
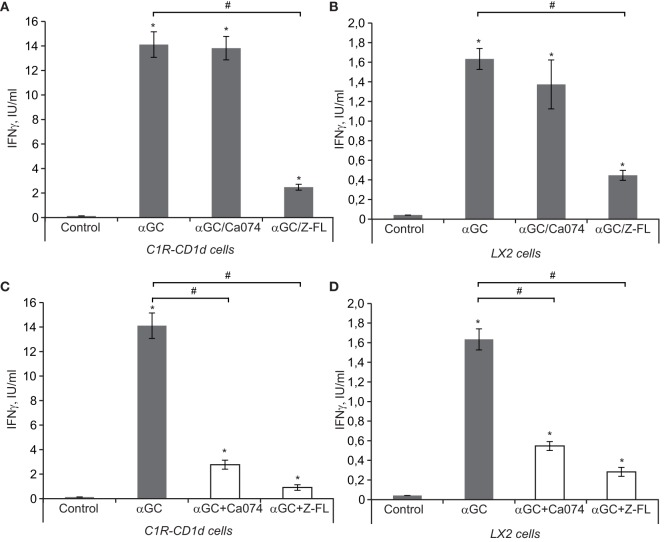
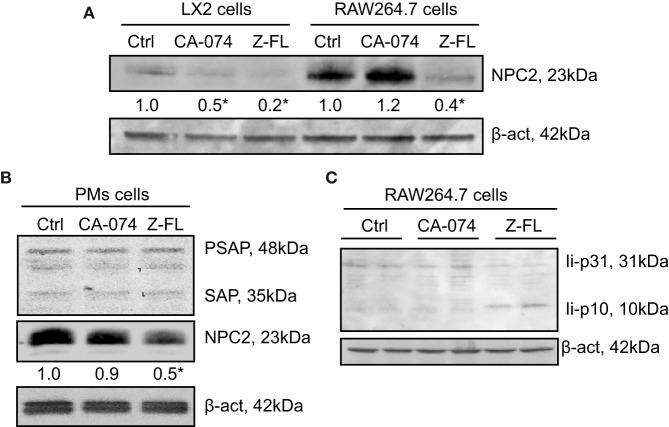
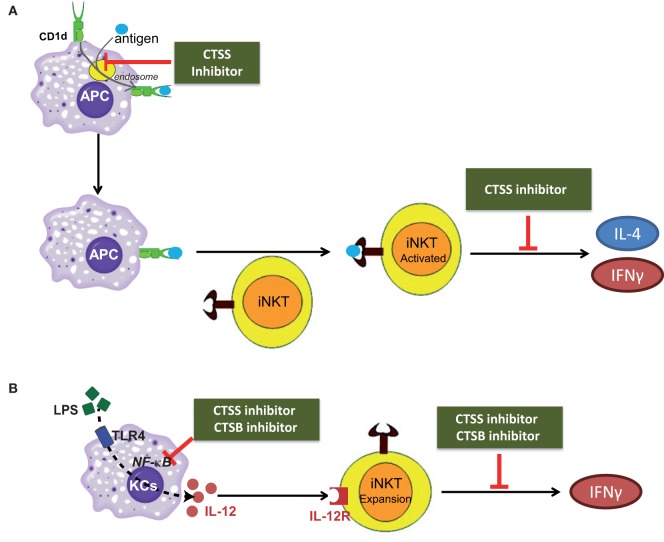
Natural killer T (NKT) cells exhibit a specific tissue distribution, displaying the liver the highest NKT/conventional T cell ratio. Upon antigen stimulation, NKT cells secrete Th1 cytokines, including interferon γ (IFNγ), and Th2 cytokines, including IL-4 that recruit and activate other innate immune cells to exacerbate inflammatory responses in the liver. Cysteine cathepsins control hepatic inflammation by regulating κB-dependent gene expression. However, the contribution of cysteine cathepsins other than Cathepsin S to NKT cell activation has remained largely unexplored. Here we report that cysteine cathepsins, cathepsin B (CTSB) and cathepsin S (CTSS), regulate different aspects of NKT cell activation. Inhibition of CTSB or CTSS reduced hepatic NKT cell expansion in a mouse model after LPS challenge. By contrast, only CTSS inhibition reduced IFNγ and IL-4 secretion after in vivo α-GalCer administration. Accordingly, in vitro studies reveal that only CTSS was able to control α-GalCer-dependent loading in antigen-presenting cells (APCs), probably due to altered endolysosomal protein degradation. In summary, our study discloses the participation of cysteine cathepsins, CTSB and CTSS, in the activation of NKT cells in vivo and in vitro.

Keywords: NF-κB; cathepsins; iNKT; inflammation; liver damage.


Figures

Figure 1
Figure 1
Cathepsin B (CTSB) and Cathepsin S (CTSS) inhibitors reduce iNKT activation after LPS challenge. Mice were treated with CTSB or CTSS inhibitors (CA-074 or Z-FL, 10 mg/kg, i.p., respectively) 1 h before LPS injection (1 mg/kg). (A) Liver iNKT cells were isolated by liver perfusion, determined by FACS, and activation marker CD69 and apoptotic cell death by Annexin V were determined. (B) H&E staining (magnification 20×) of liver samples and liver damage determined by ALT values. *p < 0.05 vs Control, and #p < 0.05 vs LPS. Representive images of three independent experiments (n = 3, each experiment).
Figure 2
Figure 2
LPS-dependent IL-12 mRNA expression in Kupffer cells (KCs) and iNKT cell activation is decreased after Cathepsin B (CTSB) or Cathepsin S (CTSS) inhibition. (A) IL-12 mRNA expression in primary KCs treated with CTSB (CA-074, 75 µM) or CTSS inhibitor (Z-FL, 7.5 µM) for 1 h before LPS challenge (50 ng/mL, 4 h). (B) KCs and RAW264.7 cells were pre-incubated with CA-074 (75 µM) or Z-FL (7.5 µM) for 1 h and nuclear proteins were analyzed after LPS (50 ng/ml, 30 min) challenge. Lamin was used as nuclear loading control. (C) KCs were preincubated with or without CTSB and CTSS inhibitors (75 and 7.5 µM, respectively, for 1 h) before being treated with LPS (50 ng/mL, 6 h). Afterward, KCs were washed and co-cultured with mouse iNKT cells, and IFNγ was determined in the extracellular media by enzyme-linked immunosorbent assay (ELISA) after 24 h. (D) KCs were treated with LPS (50 ng/mL, 6 h). Afterward, KCs were co-cultured the with mouse iNKT cells in the presence or absence of CTSB or CTSS inhibitors and IFNγ was determined in the extracellular media by ELISA after 24 h. *p < 0.05 vs Control, and #p < 0.05 vs LPS.
Figure 3
Figure 3
Effect of Cathepsin B (CTSB) and Cathepsin S (CTSS) inhibitors in liver damage after α-GalCer challenge. Mice were treated with CTSB or CTSS inhibitors (CA-074 or Z-FL, 10 mg/kg, i.p., respectively) 1 h before α-GalCer (2.5 µg/mouse) injection. (A) H&E staining of liver samples, arrows indicate inflammatory foci (magnification 20×). Representive images of three independent experiments (n = 5, each experiment). (B) Liver damage determined by ALT and AST values. *p < 0.05 vs Control and #p < 0.05 vs α-GalCer. Representive images of three independent experiments (n = 3, each experiment).
Figure 4
Figure 4
Effect of Cathepsin B (CTSB) and Cathepsin S (CTSS) inhibitors in NKT activation and cytokine secretion after α-GalCer challenge. Mice were treated with CTSB or CTSS inhibitors (CA-074 or Z-FL, 10 mg/kg, i.p., respectively) 1 h before α-GalCer (2.5 µg/mouse) injection. (A) Liver iNKT cells were isolated by liver perfusion, determined by FACS, and activation marker CD69 and apoptotic cell death by Annexin V were determined. (B,C) IFNγ and IL-4 determined by enzyme-linked immunosorbent assay in peripheral blood at the indicated time points. *p < 0.05 vs Control and #p < 0.05 vs α-GalCer. Representive images of three independent experiments (n = 3, each experiment).
Figure 5
Figure 5
IFNγ release after iNKT activation in vitro. (A,B) antigen-presenting cells (APCs) (LX2 and C1R-CD1d) were preincubated with or without Cathepsin B (CTSB) and Cathepsin S (CTSS) inhibitors (75 and 7.5 µM, respectively, for 1 h) before being treated with α-GalCer (100 ng/mL, 6 h). Afterward, we washed APCs and co-cultured the αGC-charged APCs (C1R-CD1d or LX2 cells) with human primary iNKT cells for 24 h, and IFNγ was determined in the extracellular media by enzyme-linked immunosorbent assay (ELISA) (C,D), APCs (LX2 and C1R-CD1d) were treated with α-GalCer (100 ng/mL, 6 h). Afterward, we washed APCs and co-cultured the α-GalCer-charged APCs with human primary iNKT cells in the presence or absence of CTSB or CTSS inhibitors for 24 h, and IFNγ was determined in the extracellular media by ELISA. Results are given as a mean ± SD of five independent experiments; *p < 0.001 vs Control and #p < 0.001 vs α-GalCer alone.
Figure 6
Figure 6
Effect of Cathepsin B (CTSB) or Cathepsin S (CTSS) inhibition on Niemann-Pick 2 protein (NPC2) and saposin protein expression. (A,B) LX2, RAW264.7 cells, and primary peritoneal macrophages (PMs) were incubated with CTSB (CA-074, 25 µM in LX2 cells, 75 µM in RAW264.7 and PMs, o/n) or CTSS inhibitors (Z-FL, 7.5 µM, o/n in LX2 cells, and for 4 h in RAW264.7 and PMs). (C) RAW264.7 cells were treated with CTSB and CTSS inhibitors (CA-074, 75 µM; and Z-FL, 7.5 µM) for 4 h, and protein expression was determined afterward. Representative immunoblots of three independent experiments. NPC2 levels were quantified as compared to β-actin (n = 3) *P < 0.05 vs. control cells.
Figure 7
Figure 7
Scheme depicting the role of cathepsin B (CTSB) and cathepsin S (CTSS) in the direct, or antigen mediated; and indirect, or IL-12 mediated, iNKT cell activation. (A) CTSS participates both in APC-loading of lipid antigen to CD1d in the endosome and in cytokine secretion from activated iNKTs. (B) CTSB and CTSS inhibition reduced IL-12 production by TLR4-stimulated Kupffer cells (KCs), by diminishing NF-κB activation, resulting in reduced iNKT cell expansion after LPS exposure.

References

    1. Reiser J, Adair B, Reinheckel T. Specialized roles for cysteine cathepsins in health and disease. J Clin Invest (2010) 120(10):3421–31. 10.1172/JCI42918 - DOI - PMC - PubMed
    1. Olson OC, Joyce JA. Cysteine cathepsin proteases: regulators of cancer progression and therapeutic response. Nat Rev Cancer (2015) 15(12):712–29. 10.1038/nrc4027 - DOI - PubMed
    1. de Mingo A, de Gregorio E, Moles A, Tarrats N, Tutusaus A, Colell A, et al. Cysteine cathepsins control hepatic NF-kappaB-dependent inflammation via sirtuin-1 regulation. Cell Death Dis (2016) 7(11):e2464. 10.1038/cddis.2016.368 - DOI - PMC - PubMed
    1. Moles A, Tarrats N, Fernandez-Checa JC, Mari M. Cathepsins B and D drive hepatic stellate cell proliferation and promote their fibrogenic potential. Hepatology (2009) 49(4):1297–307. 10.1002/hep.22753 - DOI - PMC - PubMed
    1. Driessen C, Bryant RA, Lennon-Dumenil AM, Villadangos JA, Bryant PW, Shi GP, et al. Cathepsin S controls the trafficking and maturation of MHC class II molecules in dendritic cells. J Cell Biol (1999) 147(4):775–90. 10.1083/jcb.147.4.775 - DOI - PMC - PubMed

Publication types

MeSH terms