. 2018 Mar 8:6:1.
doi: 10.1186/s40170-018-0174-7. eCollection 2018.

Cancer cell metabolic plasticity allows resistance to NAMPT inhibition but invariably induces dependence on LDHA

Affiliations

Cancer cell metabolic plasticity allows resistance to NAMPT inhibition but invariably induces dependence on LDHA

Natthakan Thongon et al. Cancer Metab. .

Abstract

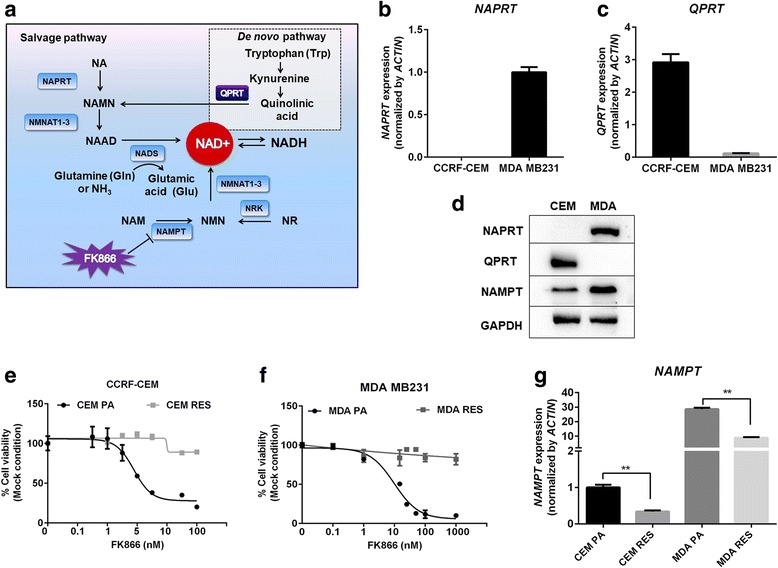
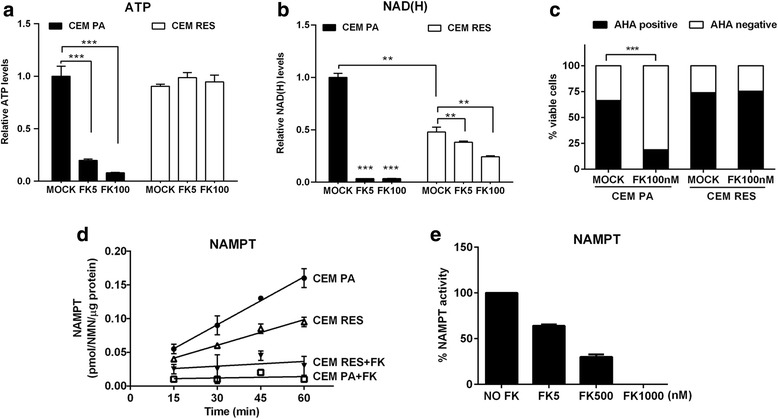
Background: Inhibitors of nicotinamide phosphoribosyltransferase (NAMPT), the rate-limiting enzyme in NAD+ biosynthesis from nicotinamide, exhibit anticancer effects in preclinical models. However, continuous exposure to NAMPT inhibitors, such as FK866, can induce acquired resistance.

Methods: We developed FK866-resistant CCRF-CEM (T cell acute lymphoblastic leukemia) and MDA MB231 (breast cancer) models, and by exploiting an integrated approach based on genetic, biochemical, and genome wide analyses, we annotated the drug resistance mechanisms.

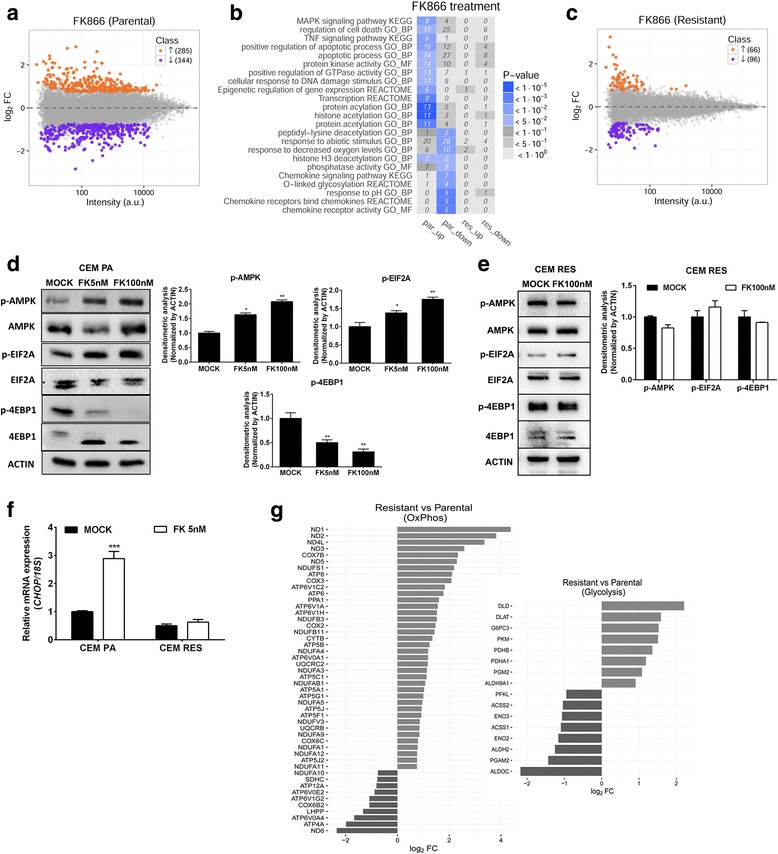
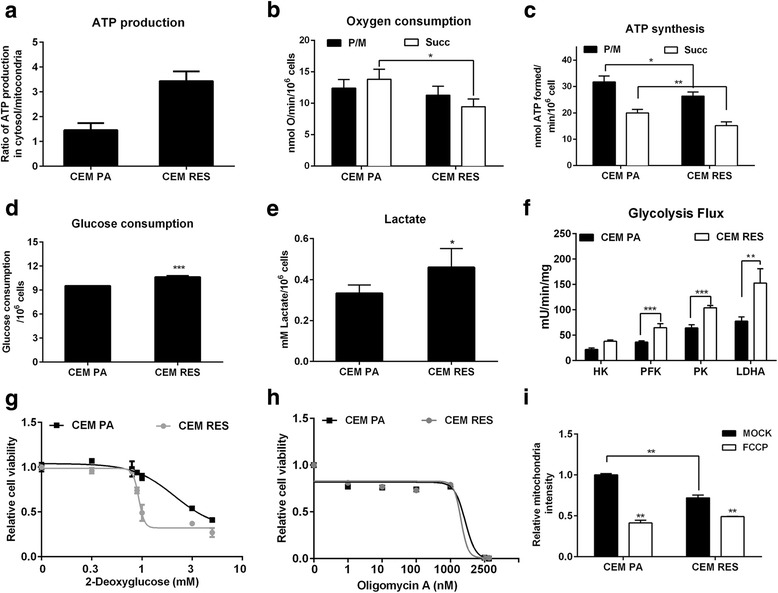
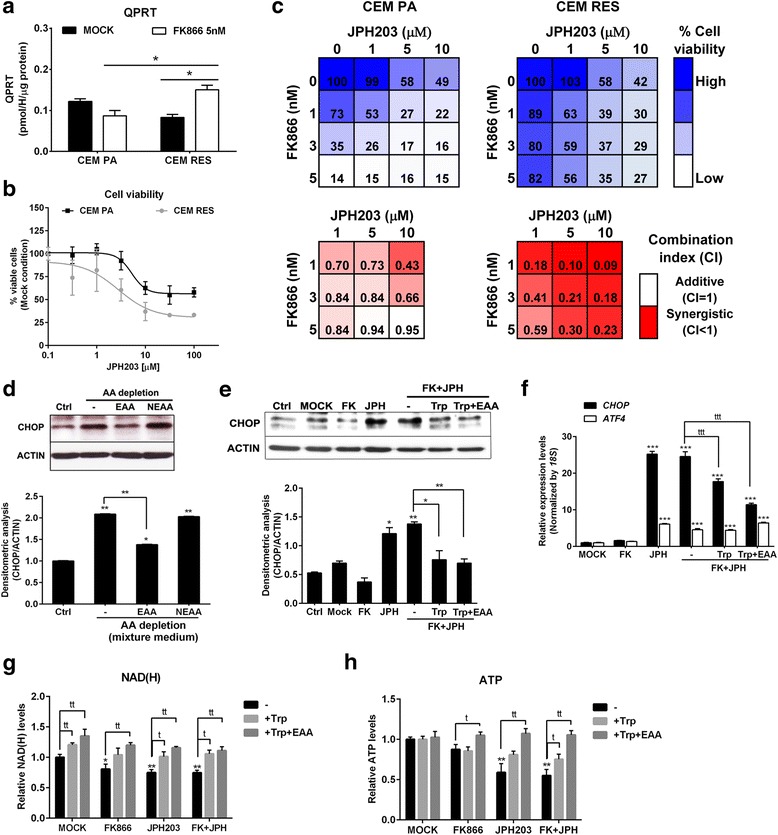
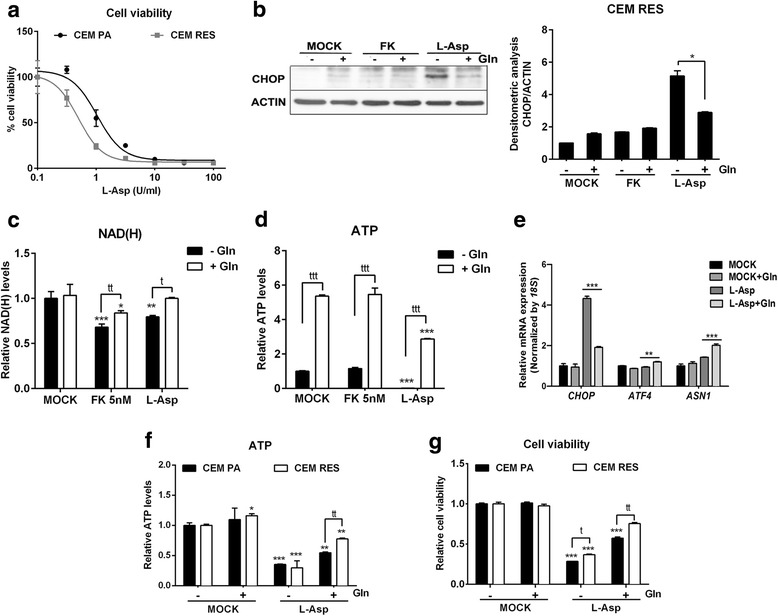
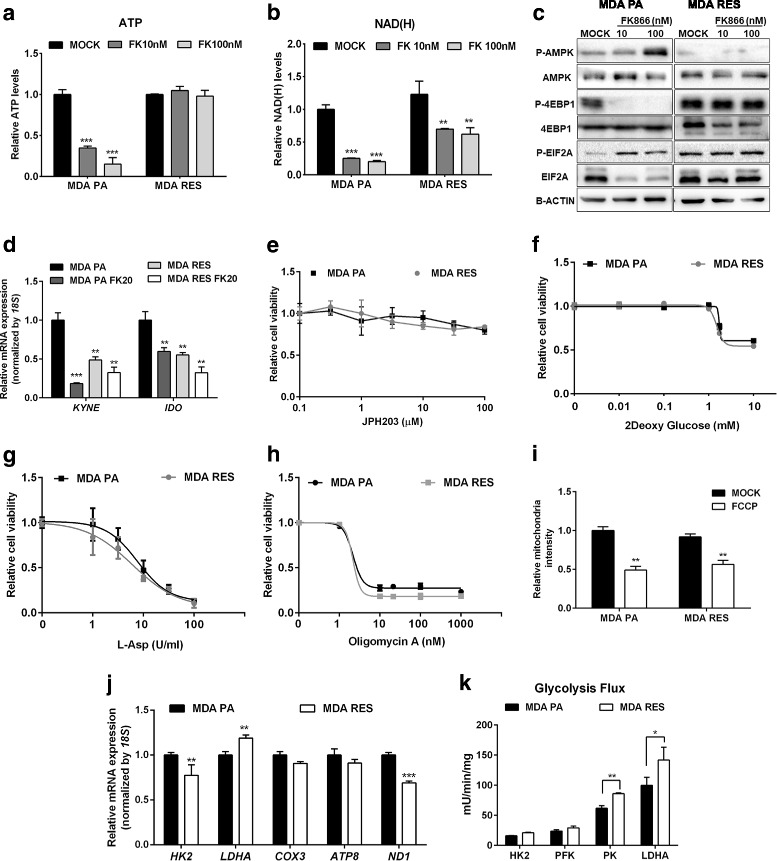
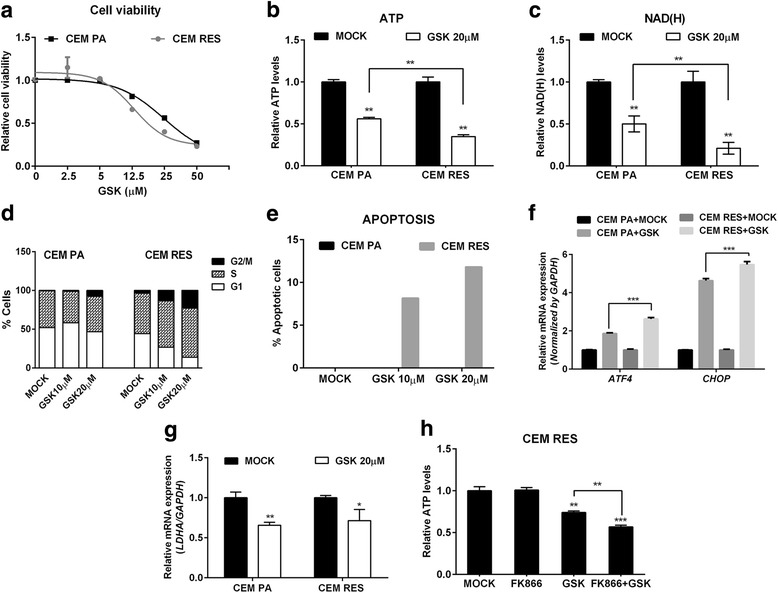
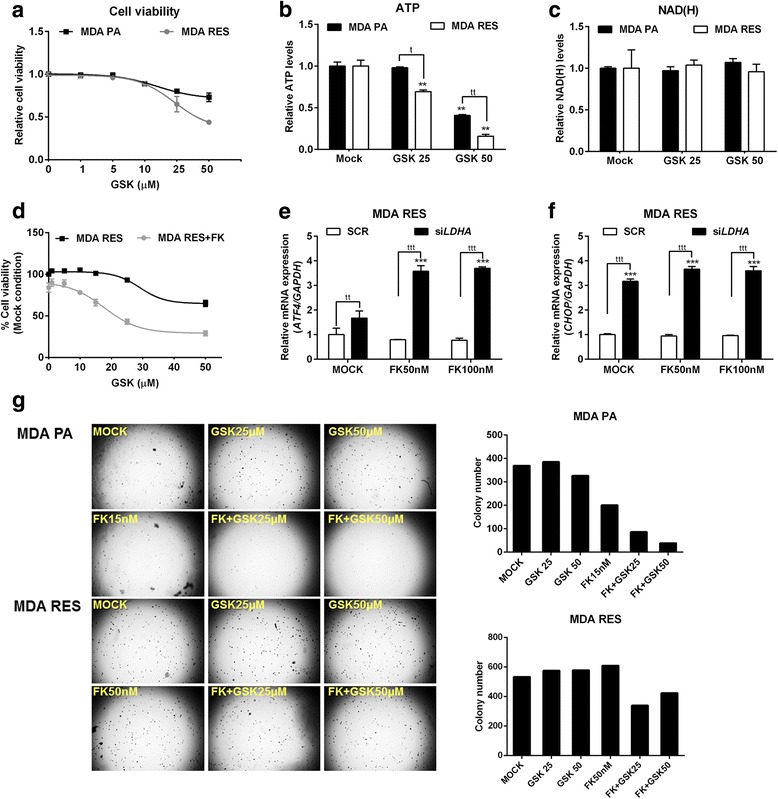
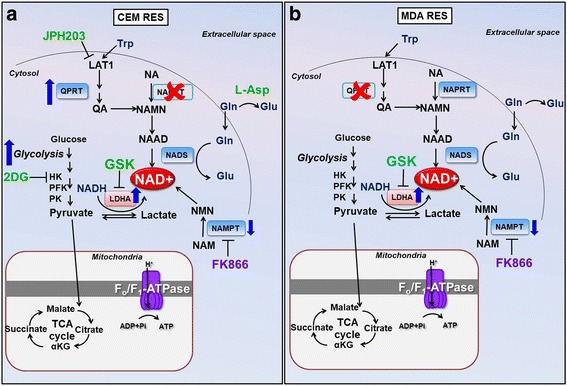
Results: Acquired resistance to FK866 was independent of NAMPT mutations but rather was based on a shift towards a glycolytic metabolism and on lactate dehydrogenase A (LDHA) activity. In addition, resistant CCRF-CEM cells, which exhibit high quinolinate phosphoribosyltransferase (QPRT) activity, also exploited amino acid catabolism as an alternative source for NAD+ production, becoming addicted to tryptophan and glutamine and sensitive to treatment with the amino acid transport inhibitor JPH203 and with l-asparaginase, which affects glutamine exploitation. Vice versa, in line with their low QPRT expression, FK866-resistant MDA MB231 did not rely on amino acids for their resistance phenotype.

Conclusions: Our study identifies novel mechanisms of resistance to NAMPT inhibition, which may be useful to design more rational strategies for targeting cancer metabolism.

Keywords: Amino acid metabolism; Drug resistance; LDHA; NAMPT; QPRT.


Conflict of interest statement

Not applicable.Not applicable.The authors declare that they have no competing interests.Springer Nature remains neutral with regard to jurisdictional claims in published maps and institutional affiliations.

Figures

Fig. 1
Fig. 1
Overview of NAD biosynthesis pathway and genetic differences in NAD(H) biosynthesis pathway between CCRF-CEM and MDA MB231 cell lines. a Schematic representation of salvage and de novo pathway of NAD biosynthesis. Pharmacological target of FK866 inhibiting NAMPT is displayed. Abbreviations: NAD, nicotinamide adenine dinucleotide; NA, nicotinic acid; NAMN, nicotinic acid mononucleotide; NAAD, nicotinic acid adenine dinucleotide; NAPRT, nicotinic acid phosphoribosyltransferase; NMNAT, nicotinamide mononucleotide adenylyltransferase; NADS, NAD synthase; NAM, nicotinamide; NMN, nicotinamide mononucleotide; NAMPT, nicotinamide phosphoribosyltransferase; NR, nicotinamide riboside; NRK, nicotinamide riboside kinase; QPRT, quinolinate phosphoribosyltransferase. b, c Expression of NAPRT and QPRT were determined in CCRF-CEM (CEM) and MDA MB231 (MDA) cell lines. d Western blot showing endogenous level of NAPRT, QPRT, and NAMPT in CEM and MDA cell lines. GAPDH was used as a loading control. e, f Sensitivity of CEM and MDA cells to FK866. CEM parental (CEM PA) and FK866-resistant CEM (CEM RES) cells (e) and MDA parental (MDA PA) and FK866-MDA resistant (MDA RES) cells (f) were exposed to various concentrations of FK866 (0.1–100 nM) for 48 h. Percentage of cell viability and EC50 were analyzed by MTT assay. g Downregulation of NAMPT in the resistant cells. Quantitative RT-PCR showing the expression of NAMPT in CEM PA, CEM RES, MDA PA, and MDA RES cells. ACTIN was used as a housekeeping gene
Fig. 2
Fig. 2
Characterization of FK866-resistant cells. a, b Administration of FK866 decreases intracellular ATP and NAD(H) levels in CEM PA cells. CEM PA and CEM RES cells were treated with 5 and 100 nM FK866 for 48 h. Relative ATP and NAD(H) levels were normalized to number of viable cells. c FK866 inhibits global protein translation. CEM PA and CEM RES cells were treated with 100 nM FK866 for 48 h. Protein synthesis was monitored by Click-it chemistry based on the incorporation of an amino acid analog (AHA). The histogram quantifies FK866-induced protein synthesis arrest in the viable cell population. d Time course of the NAMPT enzymatic activity assayed in lysates from CEM PA and CEM RES cells. Assays were performed in the absence and in the presence of 1 μM FK866 in the reaction mixtures. e NAMPT enzymatic activity was analyzed in lysates from CEM RES cells in the absence and in the presence of the indicated FK866 concentrations. All data were conducted in three independent experiments with technical triplicates (*p < 0.05, **p < 0.01, ***p < 0.001 compared to Mock)
Fig. 3
Fig. 3
Genome-wide analysis of gene expression in CCRF-CEM cells. a MA plot of transcriptome profiling in FK866-treated vs. untreated CEM PA cells. For each gene, the average log10 signal against the log2 fold change is plotted. Genes significantly up (orange)- or down (violet)-regulated upon FK866 treatment are highlighted. b Top enriched gene ontology (GO) terms and KEGG pathways among up- and downregulated genes upon FK866 treatment in CEM PA and CEM RES cells. The heatmap, colored according to enrichment p values, displays categories associated with lysine acetylation, modulation of key epigenetic regulators, and transcription factors involved in energetic stress response. The number of genes corresponding to each term is reported in each tile. c MA plot of transcriptome profiling in FK866-treated vs. untreated CEM RES cells. For each gene, the average log10 signal against the log2 fold change is plotted. d CEM PA cells were treated with 5 and 100 nM FK866 for 48 h. Western blot showing expression of AMPK, mTOR, 4EBP1, and EIF2A in CEM PA cells. e No translation inhibition and drug-induced energetic stress occurs upon FK866 treatment in the resistance. Western blot analysis of CEM RES cells treated 100 nM FK866 for 48 h. Quantitative data are expressed as relative expression to MOCK (normalized by ACTIN). f CEM RES cells treated with 5 nM FK866 for 48 h. Expression of CHOP was determined. Quantitative data were derived from three independent experiments and expressed as the mean ± S.D. (***p < 0.001). g Barplot displaying genes belonging to the enriched metabolic pathways OXPHOS and glycolysis (KEGG annotation) and with significantly altered expression between CEM PA and CEM RES cells
Fig. 4
Fig. 4
Enhanced glycolysis dependency of CEM RES cells. a Production of ATP from mitochondria and glycolysis were measured in CEM PA and CEM RES cells. Ratio of ATP production in the cytosol/mitochondria is shown. bf Metabolic enhanced towards glycolysis in CEM RES cells; CEM PA and CEM RES subclones at 10, 40, and 100 nM of FK866 were determined the aerobic metabolism, oxygen consumption (b), and ATP synthesis (c). Cells were analyzed in the presence of 5 mM pyruvate + 2.5 mM malate (P/M) or 20 mM succinate (Succ) to stimulate the pathways composed by complexes I, III, and IV or complexes II, III, and IV, respectively. To measure the glycolytic flux, glucose consumption (d), lactate production (e), and the activity of hexokinase (HK), 6-phospho-fructokinase (PFK), pyruvate kinase (PK), and lactate dehydrogenase (LDH) (f) were analyzed. gh CEM PA and CEM RES cells were treated with 2-deoxyglucose (g) and oligomycin A (h) for 48 h. Relative cell viability is shown. i Analysis of mitochondria content was conducted in CEM PA and CEM RES cells. Cells were exposed to mitotracker staining. FCCB was used as a negative control. Data was shown as mean ± S.D. of three independent experiments with technical triplicates, *p < 0.05, **p < 0.01, and ***p < 0.001
Fig. 5
Fig. 5
Tryptophan was served as an alternative source for NAD production in the resistant cells. a CEM PA and CEM RES cells were treated with 5 nM FK866 for 48 h. QPRT enzymatic activity was determined. b Percentage of cell viability indicates the response of CEM PA and CEM RES cells to JPH203 (LAT1 inhibitor) at 48 h of treatment. c Synergistic effect of FK866 and JPH203 in CEM cells. Strong synergistic effect as detected by low value of combination index (CI < 1) is more evident in CEM RES compared to CEM PA. Percentage of cell viability and CI are shown in respect to DMSO. d Activation of CHOP by amino acid deprivation. Western blot depicts the level of CHOP in CEM RES cells. CEM RES cells were treated with normal RPMI-1640 (10% FBS + 2 mM l-glutamine) (lane1), 20:80 mixture of normal RPMI-1640 (10% FBS + 2 mM l-glutamine) with Eagle’s balanced salt solution (10% FBS) (lanes 2–4) in the presence of essential amino acid (EAA) or non-essential amino acid (NEAA) for 24 h. e Tryptophan (Trp) rescues amino acid sensitized CEM RES cells to JPH203. This experiment was performed in normal RPMI-1640 (10% FBS + 2 mM l-glutamine) (lane 1) and mixture medium (lanes 2–6). CEM RES cells were treated with 5 nM FK866, 10 μM JPH203 (after O/N washout) or FK866 + JPH203. Supplementation of 0.25 mM tryptophan or 1× EAA was addressed to FK866 + JPH203 co-treatment. CHOP level was determined at 24 h after treatment. fh CEM RES cells were treated with indicated conditions, and expression of CHOP and ATF4 mRNA (f), NAD(H) level (g), and ATP level (h) were determined, respectively. Experiments in ac were performed in the normal RPMI-1640 medium and in dh were performed in the mixture medium. Data were plotted as mean ± S.D. from three independent experiments (*p < 0.05, ***p < 0.001 compared to MOCK) and (ttp < 0.01, tttp < 0.001 compared among treatments)
Fig. 6
Fig. 6
The resistant cells are sensitive to l-asparaginase. a CEM PA and CEM RES cells were treated with l-asparaginase (L-Asp) for 48 h. This experiment was performed in normal RPMI-1640 (10% FBS + 2 mM l-glutamine). Percentage of cell viability was determined. b CEM RES cells were treated with 5 nM FK866 and 3 U/ml L-Asp in the presence or absence of Gln supplementation. Twenty-four hours post-treatment, western blot analysis of CHOP expression was conducted. c, d CEM RES cells were treated with 5 nM FK866 and 3 U/ml L-Asp in the presence or absence of Gln supplementation. Twenty-four hours post-treatment, NAD(H) (c) and ATP level (d) were measured. e CEM RES cells were treated with 3 U/ml L-Asp in the presence and absence of Gln supplementation for 24 h. Expression of CHOP, ATF4, and ASNS were determined. Expression of 18S was served as a housekeeping gene. f, g CEM PA and CEM RES cells were treated with 3 U/ml L-Asp in the presence and absence of Gln exposure for 24 h. ATP level (f) and cell viability (g) were measured. Experiments in bg were performed in 20:80 mixture of normal RPMI-1640 (10% FBS + 2 mM l-glutamine) with Eagle’s balanced salt solution (10% FBS). Data were plotted as mean ± S.D. from three independent experiments with technical triplicates (*p < 0.05, **p < 0.01, ***p < 0.001 compared to MOCK) and (ttp < 0.01, tttp < 0.001 compared among treatments)
Fig. 7
Fig. 7
Characterization of MDA MB231 and FK866-resistant MDA MB231 cells. a, b MDA MB231 parental (MDA PA) and resistant cells (MDA RES) cells were treated with 10 and 100 nM FK866 for 48 h. ATP (a) and NAD(H) (b) levels were measured. c Western blot showing no alter in translation inhibition in MDA RES along with FK866 treatment in respect to MDA PA. Protein expression from total lysates were determined by detecting with indicated antibodies. B-ACTIN was used as a loading control. d MDA PA and MDA RES cells were treated with 20 nM FK866 for 48 h. Expression of KYNE and IDO, genes involved in the de novo pathway for NAD+ synthesis, were evaluated. eh Relative cell viability of CEM PA and CEM RES cells treated with JPH203 (e), 2-deoxyglucose (f), L-Asp (g), and oligomycin A (h) for 48 h was displayed. i Analysis of mitochondria content. MDA PA and MDA RES cells were exposed to mitotracker staining. FCCB was used as a negative control. j Expression of genes involved in glycolysis and OXPHOS pathway were determined in MDA PA and MDA RES cells. Expression of 18S was served as a housekeeping gene. k Enhanced LDHA activity in the resistance. Enzymatic activity of glycolysis pathway was measured in MDA PA and MDA RES cells. Data were plotted as mean ± S.D. from three biological experiments with technical triplicates (*p < 0.05, **p < 0.01, ***p < 0.001)
Fig. 8
Fig. 8
LDHA regulates metabolic resistance in CEM cells. a CEM PA and CEM RES cells were treated with LDH inhibitor (GSK) for 48 h. Relative cell viability was analyzed using MTT assay in respect to Mock. b, c CEM PA and CEM RES cells were treated with 20 μM GSK for 48 h; ATP (b) and NAD(H) (c) levels were determined. d, e CEM PA and CEM RES cells were treated with 10 and 20 μM GSK for 48 h. Cell cycle analysis and percentage of apoptotic cell were determined, respectively. f, g CEM PA and CEM RES cells were treated with 20 μM GSK for 48 h; quantitative RT-PCR of ATF4/CHOP (f) and LDHA (g) was determined, respectively. Expression of GAPDH was used as a housekeeping gene. h Synergistic effect of FK866 and GSK was detected by a strong reduction of ATP level in CEM RES cells. ATP level was measured in CEM RES cells treated with 5 nM FK866, 20 μM GSK, and co-treatment between FK866 and GSK for 48 h. All data were represent as mean ± S.D. from three independent experiments (*p < 0.05, **p < 0.01, ***p < 0.001)
Fig. 9
Fig. 9
Pharmacological and genetic inhibition of LDHA in MDA MB231 cells. a MDA PA and MDA RES cells were treated with GSK for 48 h. Relative cell viability was analyzed. b, c MDA PA and MDA RES cells were treated with 25 and 50 μM GSK for 48 h; ATP (b) and NAD(H) (c) levels were determined, respectively. d Synergistic effect of FK866 and GSK inhibits cell growth in MDA RES cells. MDA RES cells were treated with various concentrations of GSK and co-treatment with 20 nM FK866 for 48 h. Percentage of cell viability was determined. e, f Downregulation of LDHA by siRNA was performed in MDA RES cells. Twenty-four hours after silencing, MDA RES cells were treated with GSK for 48 h. Expression levels of ATF4 (e) and CHOP (f) were evaluated. Expression of GAPDH was used as a housekeeping gene. All data were represent as mean ± S.D. from three independent experiments (*p < 0.05, **p < 0.01, ***p < 0.001). g MDA PA and MDA RES cells were performed anchorage-independent growth (colony formation assay) in soft agar along with indicated concentrations of FK866 and GSK treatment for 21 days. A representative colony formation experiment was illustrated and colony number was counted by operetta
Fig. 10
Fig. 10
Schematic representation of different metabolic responses in acquiring FK866 resistance in CEM RES (a) and MDA RES (b) cells. CEM RES cells are NAPRT-negative and QPRT-positive cells and appear to increase the de novo pathway for NAD production. The metabolic resistance of CEM is more dependent on glycolysis and LDHA activity whereas MDA RES shows very low level of QPRT and primarily rely on LDHA activity for its resistance to FK866. The small molecules having a pro-death pharmacological effect are indicated in green. Abbreviations: NAD, nicotinamide adenine dinucleotide; NA, nicotic acid; NAMN, nicotinic acid mononucleotide; NAAD, nicotinic acid adenine dinucleotide, NAPRT, nicotinic acid phosphoribosyltransferase; NMNAT, nicotinamide mononucleotide adenylyltransferase; NADS, NAD synthase; NAM, nicotinamide; NMN, nicotinamide mononucleotide; NAMPT, nicotinamide phosphoribosyltransferase; NR, nicotinamide riboside; NRK, nicotinamide riboside kinase; QPRT, quinolinate phosphoribosyltransferase; HK, hexokinase; PFK, phosphofructokinase; PK, pyruvate kinase; LDH, lactate dehydrogenase; Gln, glutamine; Glu, glutamic acid; GSK, LDHA inhibitor; 2DG, 2-deoxyglucose; JPH, JPH203; L-Asp, l-asparaginase; GSK, GSK2837808A; LAT1, L-type amino acid transporter 1

References

    1. Holohan C, Van Schaeybroeck S, Longley DB, Johnston PG. Cancer drug resistance: an evolving paradigm. Nat. Rev. Cancer. 2013;13:714–726. doi: 10.1038/nrc3599. - DOI - PubMed
    1. Housman G, Byler S, Heerboth S, Lapinska K, Longacre M, Snyder N, et al. Drug resistance in cancer: an overview. Cancers (Basel) 2014;6:1769–1792. doi: 10.3390/cancers6031769. - DOI - PMC - PubMed
    1. Szakács G, Paterson JK, Ludwig JA, Booth-Genthe C, Gottesman MM. Targeting multidrug resistance in cancer. Nat Rev Drug Discov. 2006;5:219–234. doi: 10.1038/nrd1984. - DOI - PubMed
    1. Sharma SV, Bell DW, Settleman J, Haber DA. Epidermal growth factor receptor mutations in lung cancer. Nat Rev Cancer. 2007;7:169–181. doi: 10.1038/nrc2088. - DOI - PubMed
    1. Watson PA, Arora VK, Sawyers CL. Emerging mechanisms of resistance to androgen receptor inhibitors in prostate cancer. Nat Rev Cancer. 2015;15:701–711. doi: 10.1038/nrc4016. - DOI - PMC - PubMed