Review
. 2018 Feb;8(1):86-99.
doi: 10.21037/qims.2018.01.01.

Diagnostic imaging of osteoporosis and sarcopenia: a narrative review

Affiliations
Review

Diagnostic imaging of osteoporosis and sarcopenia: a narrative review

Carmelo Messina et al. Quant Imaging Med Surg. 2018 Feb.

Erratum in

Abstract

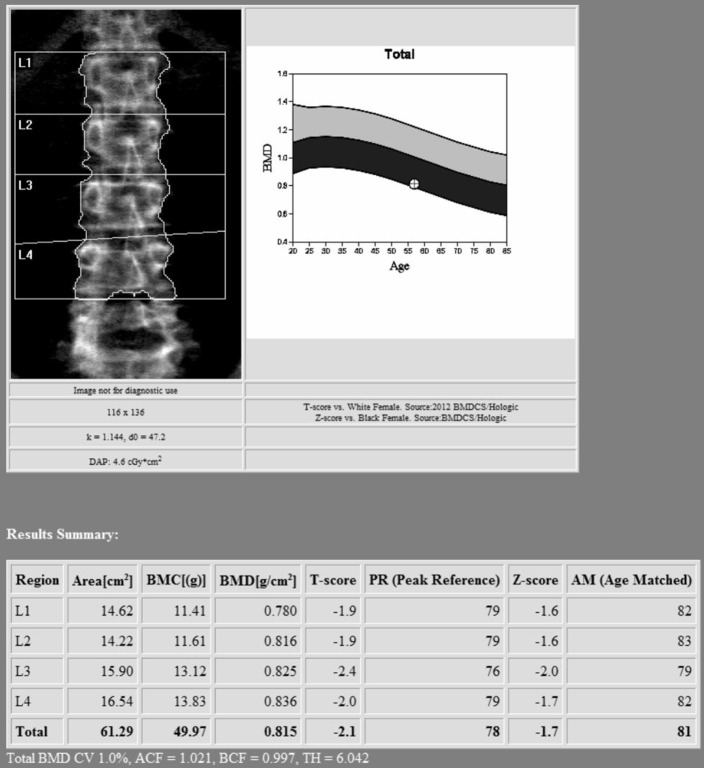
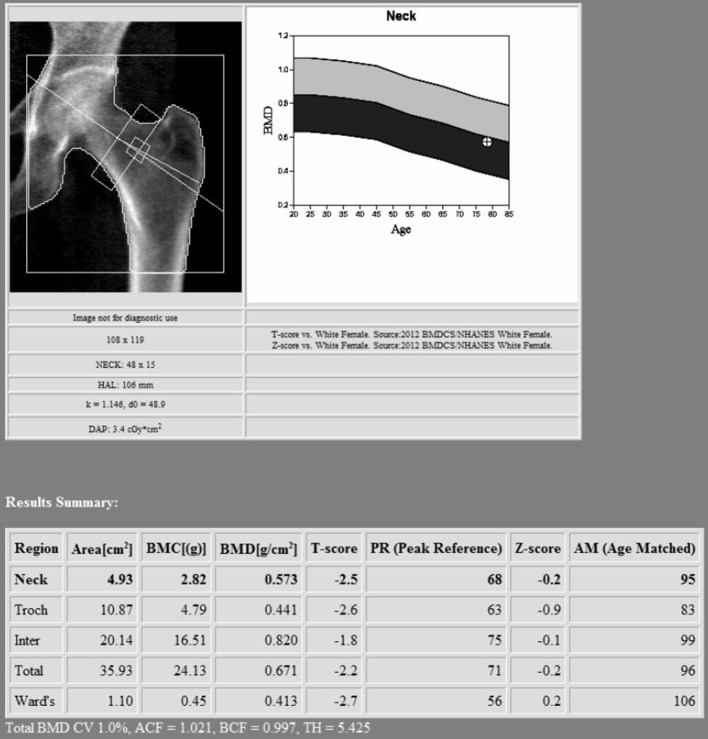
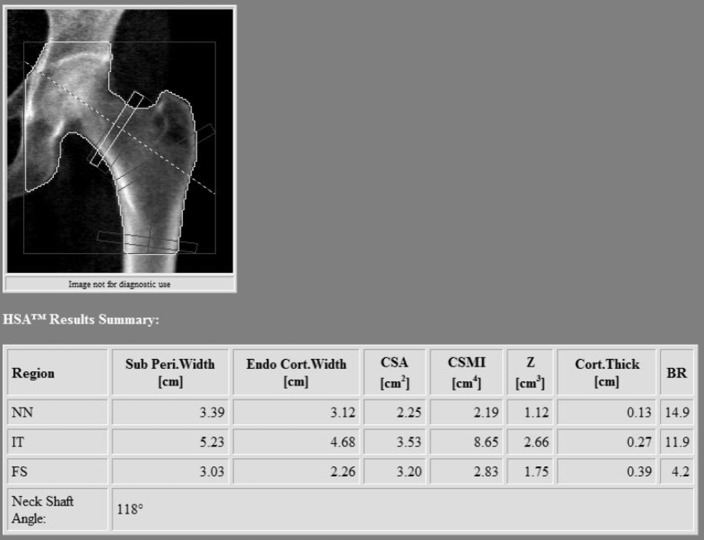
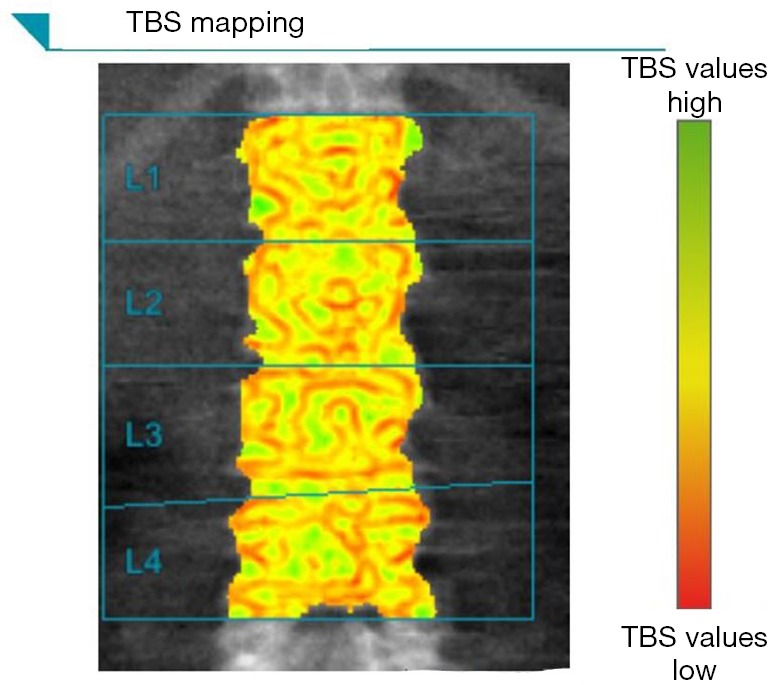
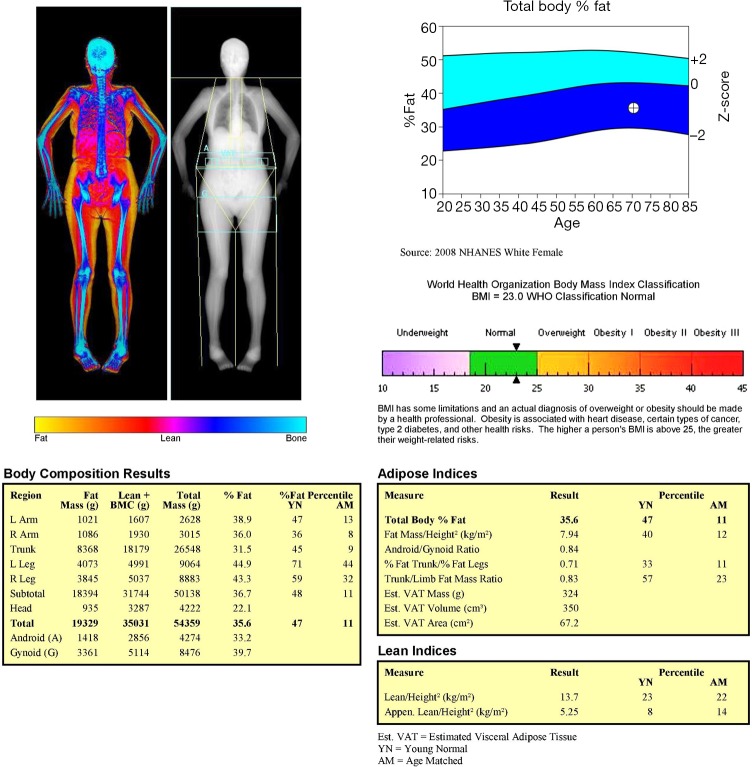
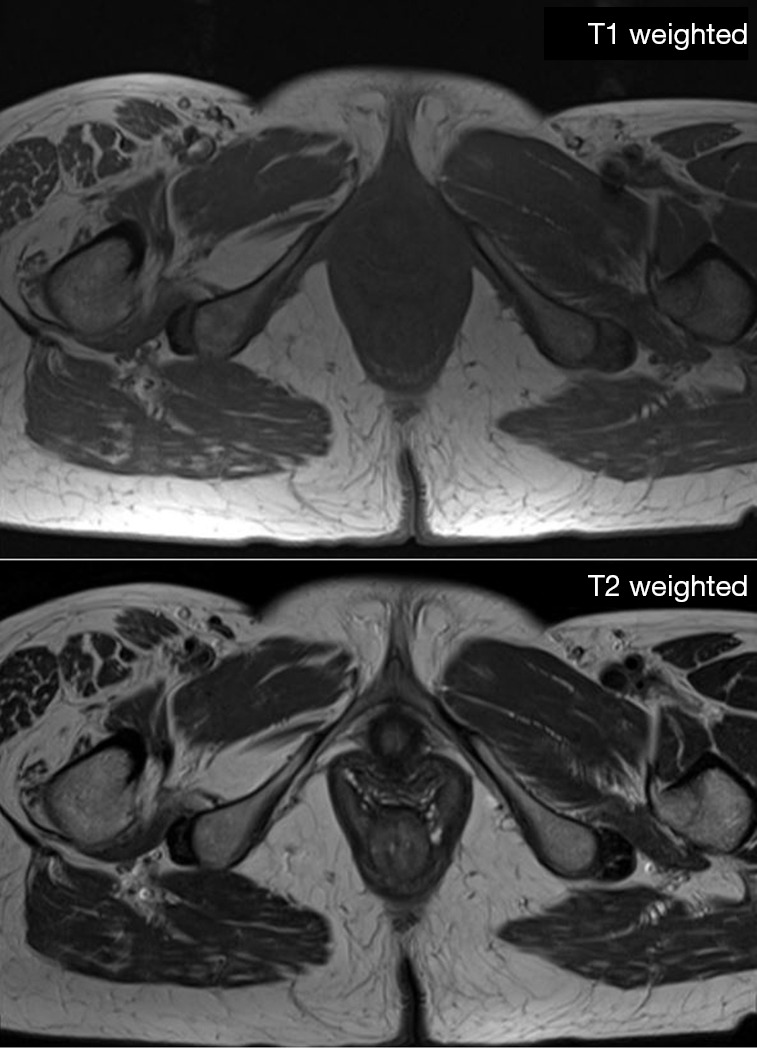
Osteoporosis and sarcopenia represent two major health problems with an increasing prevalence in the elderly population. The correlation between these diseases has been widely reported, leading to the development of the term "osteosarcopenia" to diagnose those patients suffering from both diseases. Several imaging methods for the diagnosis and management of osteoporosis exist, with dual-energy X-ray absorptiometry (DXA) being the most commonly used for measuring bone mineral density (BMD). Imaging technique other than DXA is represented by conventional radiography, computed tomography (CT) and ultrasound (US). Similarly, the imaging technologies used to detect loss of skeletal muscle mass in sarcopenia include DXA, CT, US and magnetic resonance imaging (MRI). These methods differ in terms of reliability, radiation exposure and costs. CT and MRI represent the gold standard for evaluating body composition (BC), but are costly and time-consuming. DXA remains the most often used technology for studying BC, being quick, widely available and with low radiation exposure.

Keywords: Osteoporosis; dual energy X-ray absorptiometry (DXA); imaging; sarcopenia.


Conflict of interest statement

Conflicts of Interest: The authors have no conflicts of interest to declare.

Figures

Figure 1
Figure 1
Lumbar spine is one of the most commonly used site for DXA. Image shows proper positioning and analysis of the L1–L4 lumbar spine. Diagnosis should be made on the average L1–L4 value; at least two vertebrae must be used. DXA, dual-energy X-ray absorptiometry; BMC, body mineral content; BMD, bone mineral density.
Figure 2
Figure 2
The image shows the proper way to position and analyse the proximal femur with DXA. The preferred region of interest (ROI) for diagnosis is femoral neck, but total hip ROI can be used if it presents lower values. DXA, dual-energy X-ray absorptiometry; BMC, body mineral content; BMD, bone mineral density.
Figure 3
Figure 3
Hip structural analysis (HSA) represents an additional tool of DXA. It provides information about several parameters of hip geometry obtained by two-dimensional DXA scans. DXA, dual-energy X-ray absorptiometry; CSA, cross-sectional area; CSMI, cross-sectional moment of inertia.
Figure 4
Figure 4
Trabecular bone score (TBS) is another additional and more recent tool provided by DXA. It offers an indirect analysis of bone microarchitecture, being a promising tool to use in adjunction with conventional BMD analysis. DXA, dual-energy X-ray absorptiometry; BMD, bone mineral density.
Figure 5
Figure 5
Body composition results showing a graphical body scan with different colours, according to the percentage of fat mass, lean mass and bone (depicted in yellow, red and blue, respectively). Body mass index (BMI) is represented, according to World Health Organization classification. Adipose and lean indices are reported as well. Appen. lean/height2 (kg/m2) represents the appendicular lean mass index (ALMI), commonly used for diagnosing sarcopenia. BMC, body mineral content.
Figure 6
Figure 6
Magnetic resonance imaging (MRI) of a 53 years old female with right lumbosacral radiculoplexus neuropathy. Both T1- and T2-weighted images show severe fatty infiltration of pelvic and thigh muscles on the right side. The left side is normal.
Figure 7
Figure 7
Example of the use of Dixon MRI sequences to evaluate separately water and fat components in a thigh. The sequence provides four images: both fat and water components, water and fat only, and fat fraction that can be used for quantification purposes.

References

    1. Kanis JA, McCloskey EV, Johansson H, Cooper C, Rizzoli R, Reginster JY. European guidance for the diagnosis and management of osteoporosis in postmenopausal women. Osteoporos Int 2013;24:23-57. 10.1007/s00198-012-2074-y - DOI - PMC - PubMed
    1. Beaudart C, Dawson A, Shaw SC, Harvey NC, Kanis JA, Binkley N, Reginster JY, Chapurlat R, Chan DC, Bruyère O, Rizzoli R, Cooper C, Dennison EM, IOF-ESCEO Sarcopenia Working Group Nutrition and physical activity in the prevention and treatment of sarcopenia: systematic review. Osteoporos Int 2017;28:1817-33. 10.1007/s00198-017-3980-9 - DOI - PMC - PubMed
    1. Consensus development conference : diagnosis, prophylaxis, and treatment of osteoporosis. Am J Med 1993;94:646-50. 10.1016/0002-9343(93)90218-E - DOI - PubMed
    1. Cruz-Jentoft AJ, Baeyens JP, Bauer JM, Boirie Y, Cederholm T, Landi F, Martin FC, Michel JP, Rolland Y, Schneider SM, Topinkova E, Vandewoude M, Zamboni M, European Working Group on Sarcopenia in Older People Sarcopenia: European consensus on definition and diagnosis: Report of the European Working Group on Sarcopenia in Older People. Age Ageing 2010;39:412-23. 10.1093/ageing/afq034 - DOI - PMC - PubMed
    1. Hirschfeld HP, Kinsella R, Duque G. Osteosarcopenia: where bone, muscle, and fat collide. Osteoporos Int 2017;28:2781-90. 10.1007/s00198-017-4151-8 - DOI - PubMed

LinkOut - more resources