

Global, Regional, and Megacity Trends in the Highest Temperature of the Year: Diagnostics and Evidence for Accelerating Trends
- PMID: 29541645
- PMCID: PMC5838410
- DOI: 10.1002/2017EF000709
Global, Regional, and Megacity Trends in the Highest Temperature of the Year: Diagnostics and Evidence for Accelerating Trends
Abstract
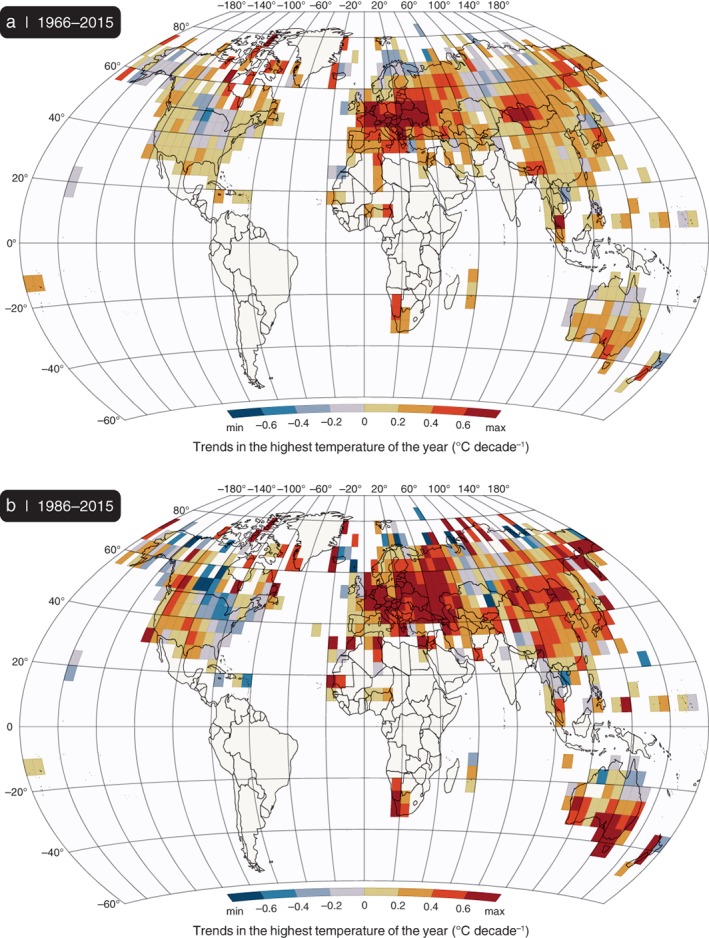
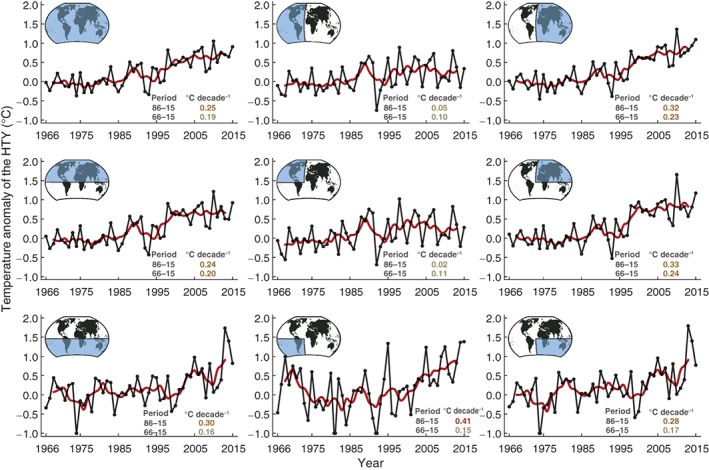
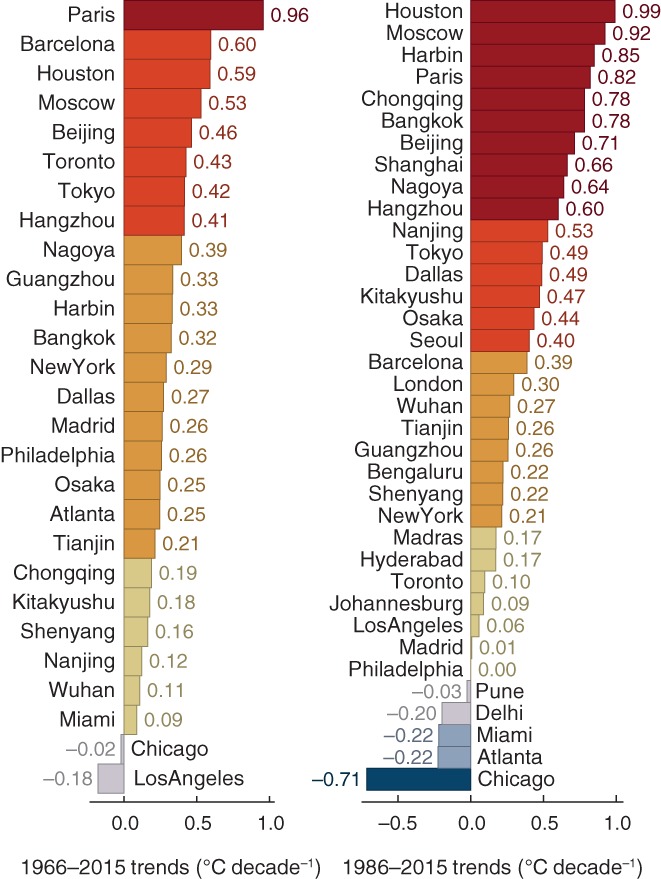
Trends in short-lived high-temperature extremes record a different dimension of change than the extensively studied annual and seasonal mean daily temperatures. They also have important socioeconomic, environmental, and human health implications. Here, we present analysis of the highest temperature of the year for approximately 9000 stations globally, focusing on quantifying spatially explicit exceedance probabilities during the recent 50- and 30-year periods. A global increase of 0.19°C per decade during the past 50 years (through 2015) accelerated to 0.25°C per decade during the last 30 years, a faster increase than in the mean annual temperature. Strong positive 30-year trends are detected in large regions of Eurasia and Australia with rates higher than 0.60°C per decade. In cities with more than 5 million inhabitants, where most heat-related fatalities occur, the average change is 0.33°C per decade, while some east Asia cities, Paris, Moscow, and Houston have experienced changes higher than 0.60°C per decade.
Keywords: Extreme high temperatures; Global change; Heat waves; Megacities; Regional.
Figures
Similar articles
-
Asymmetric trends in seasonal temperature variability in instrumental records from ten stations in Switzerland, Germany and the UK from 1864 to 2012.Int J Climatol. 2016 Jan;36(1):13-27. doi: 10.1002/joc.4326. Epub 2015 Apr 2. Int J Climatol. 2016. PMID: 27478303 Free PMC article.
-
The changing PM2.5 dynamics of global megacities based on long-term remotely sensed observations.Environ Int. 2020 Sep;142:105862. doi: 10.1016/j.envint.2020.105862. Epub 2020 Jun 26. Environ Int. 2020. PMID: 32599351
-
Temperature and geographic attribution of change in the Taraxacum mongolicum growing season from 1990 to 2009 in eastern China's temperate zone.Int J Biometeorol. 2015 Oct;59(10):1437-52. doi: 10.1007/s00484-015-0955-4. Epub 2015 Jan 28. Int J Biometeorol. 2015. PMID: 25627826
-
Impact of extreme high temperature on mortality and regional level definition of heat wave: a multi-city study in China.Sci Total Environ. 2015 Feb 1;505:535-44. doi: 10.1016/j.scitotenv.2014.10.028. Epub 2014 Oct 22. Sci Total Environ. 2015. PMID: 25461056
-
Assessing Global Water Storage Variability from GRACE: Trends, Seasonal Cycle, Subseasonal Anomalies and Extremes.Surv Geophys. 2016;37:357-395. doi: 10.1007/s10712-016-9367-1. Epub 2016 Feb 26. Surv Geophys. 2016. PMID: 27471333 Free PMC article. Review.
Cited by
-
Climate Change, Health and Existential Risks to Civilization: A Comprehensive Review (1989⁻2013).Int J Environ Res Public Health. 2018 Oct 16;15(10):2266. doi: 10.3390/ijerph15102266. Int J Environ Res Public Health. 2018. PMID: 30332777 Free PMC article. Review.
-
Probabilistic Evaluation of Drought in CMIP6 Simulations.Earths Future. 2021 Oct;9(10):e2021EF002150. doi: 10.1029/2021EF002150. Epub 2021 Oct 11. Earths Future. 2021. PMID: 34820470 Free PMC article.
-
Avian mortality risk during heat waves will increase greatly in arid Australia during the 21st century.Conserv Physiol. 2020 Jun 4;8(1):coaa048. doi: 10.1093/conphys/coaa048. eCollection 2020. Conserv Physiol. 2020. PMID: 32523698 Free PMC article.
-
Investigation of heat stress responses and adaptation mechanisms by integrative metabolome and transcriptome analysis in tea plants (Camellia sinensis).Sci Rep. 2024 May 1;14(1):10023. doi: 10.1038/s41598-024-60411-0. Sci Rep. 2024. PMID: 38693343 Free PMC article.
-
Heavy rainfalls in Poland and their hyetographs.Ambio. 2025 Jan;54(1):86-104. doi: 10.1007/s13280-024-02069-6. Epub 2024 Sep 16. Ambio. 2025. PMID: 39283542 Free PMC article.
References
-
- Alexander, L. V. , Zhang, X. , Peterson, T. C. , Caesar, J. , Gleason, B. , Klein Tank, A. M. G. , … Vazquez‐Aguirre, J. L. (2006). Global observed changes in daily climate extremes of temperature and precipitation. Journal of Geophysical Research – Atmospheres, 111(D5), D05109. https://doi.org/10.1029/2005JD006290 - DOI
-
- Allen, C. D. , Macalady, A. K. , Chenchouni, H. , Bachelet, D. , McDowell, N. , Vennetier, M. , … Cobb, N. (2010). A global overview of drought and heat‐induced tree mortality reveals emerging climate change risks for forests. Forest Ecology and Management, 259(4), 660–684. https://doi.org/10.1016/j.foreco.2009.09.001 - DOI
-
- Arnfield, A. J. (2003). Two decades of urban climate research: A review of turbulence, exchanges of energy and water, and the urban heat island. International Journal of Climatology, 23(1), 1–26. https://doi.org/10.1002/joc.859 - DOI
-
- Barnes, E. A. (2013). Revisiting the evidence linking Arctic amplification to extreme weather in midlatitudes. Geophysical Research Letters, 40(17), 4734–4739. https://doi.org/10.1002/grl.50880 - DOI
LinkOut - more resources
Full Text Sources
Other Literature Sources
Miscellaneous