. 2019 Mar;10(3):178-195.
doi: 10.1007/s13238-018-0521-z. Epub 2018 Mar 14.

Identification of serotonin 2A receptor as a novel HCV entry factor by a chemical biology strategy

Affiliations

Identification of serotonin 2A receptor as a novel HCV entry factor by a chemical biology strategy

Lin Cao et al. Protein Cell. 2019 Mar.

Abstract

Hepatitis C virus (HCV) is a leading cause of liver disease worldwide. Although several HCV protease/polymerase inhibitors were recently approved by U.S. FDA, the combination of antivirals targeting multiple processes of HCV lifecycle would optimize anti-HCV therapy and against potential drug-resistance. Viral entry is an essential target step for antiviral development, but FDA-approved HCV entry inhibitor remains exclusive. Here we identify serotonin 2A receptor (5-HT2AR) is a HCV entry factor amendable to therapeutic intervention by a chemical biology strategy. The silencing of 5-HT2AR and clinically available 5-HT2AR antagonist suppress cell culture-derived HCV (HCVcc) in different liver cells and primary human hepatocytes at late endocytosis process. The mechanism is related to regulate the correct plasma membrane localization of claudin 1 (CLDN1). Moreover, phenoxybenzamine (PBZ), an FDA-approved 5-HT2AR antagonist, inhibits all major HCV genotypes in vitro and displays synergy in combination with clinical used anti-HCV drugs. The impact of PBZ on HCV genotype 2a is documented in immune-competent humanized transgenic mice. Our results not only expand the understanding of HCV entry, but also present a promising target for the invention of HCV entry inhibitor.

Keywords: HCV; antiviral drug; entry; serotonin 2A receptor.


Figures
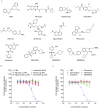
Figure 1
Figure 1
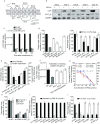
Chemical probes help to identify the antagonism of 5-HT2AR inhibiting HCVcc. (A) Chemical probes are composed by a subset of selected FDA-approved adrenergic receptors and serotonin receptors antagonists. (B and C) The HCV inhibition of all chemical probes. Huh7.5.1 cells infected by HCVcc were treated with various adrenergic receptors antagonists (B) and serotonin receptors antagonists (C) at the indicated concentrations at 37 °C for 48 h. The infections are quantified by qRT-PCR measuring virus RNA. All results are graphed as the mean ± SD for triplicate samples
Figure 2
Figure 2
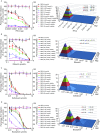
5-HT2AR plays a role in HCV infection. (A) The topology of 5-HT2AR. (B) Expression of 5-HT2AR, HCV core and GADPH in HCV-infected or mock Huh7.5.1 cells. HCVcc at 2 MOI was used to infected cells over the course of 10 days. The expression of host GADPH is shown as a control protein. (C) Silencing of 5-HT2AR and CD81 impairs HCV infection. Huh7.5.1 cells were silenced with sh-NC, sh-5HT2AR-3 or sh-CD81, followed by HCVcc infection over the course of 5 days. The transcript levels of 5-HT2AR and CD81 were quantified by qRT-PCR, normalized to GAPDH and graphed as a percentage of the maximum number of copies determined in sh-NC-containing cells. All results are graphed as the mean ± SD for triplicate samples. (D) The infection of HCVcc, but not VSV-Gpp, is correlated with 5-HT2AR expression. Huh7.5.1 cells containing shRNAs or sh-NC were infected with HCVcc or VSV-Gpp at 37 °C for 48 h. The transcript levels were quantified by qRT-PCR, normalized to GAPDH and graphed as a percentage of copies determined in sh-NC-containing cells. The infections were quantified by measuring the luciferase activity in relative luminescence units. Virus infection is expressed as a percentage relative to that in sh-NC-containing cells. (E) HCVcc infection is rescued by 5-HT2AR overexpression. Huh7.5.1 cells containing sh-NC, sh-5HT2AR and pcDNA empty plasmid, sh-5HT2AR and p5HT2ARwt, or sh-5HT2AR and p5HT2ARshRes were infected by HCVcc at 37 °C for 48 h. The expression levels of 5-HT2AR were examined by Western blot and normalized to GADPH. Virus infection and protein expression are expressed as a percentage relative to sh-NC-containing cells. (F) Huh7.5.1 cells infected by HCVcc in the presence of antibodies or blocking peptide at 50 μg/mL at 37 °C for 48 h. Virus infection is expressed as percentages relative to buffer-treated control cells. (G) PBZ inhibits HCVcc in Huh7.5.1, Huh7 and PHHs. All cells infected by HCVcc were treated with PBZ at the indicated concentrations at 37 °C for 48 h. HCV RNAs are quantified by qRT-PCR and expressed as percentages relative to 0.5% DMSO-treated control cells. (H) Silencing of 5-HT2AR in Huh7.5.1, Huh7 and PHHs impair HCV infection. Huh7.5.1 cells, Huh7 cells and PHHs were silenced with sh-NC, sh-CD81 or sh-5HT2AR, followed by HCVcc infection at 37 °C for 48 h. HCV RNAs are quantified by qRT-PCR and expressed as percentages relative to sh-NC-containing control cells. (I) Intracellular HCV genome levels detected in Huh7.5.1 cells, which are infected by virus containing the structural region of the indicated genotypes, treated with 10 μmol/L PBZ. The infections are quantified by measuring HCV RNAs for detection by qRT-PCR and expressed as percentages relative to 0.5% DMSO-treated cells. (J) 5-HT2AR is required for HCV cell-to-cell spread. Cells containing sh-NC, sh-5HT2AR and sh-CD81 were infected with HCV (JFH-1) with an EGFP reporter. At 24 hpi, the cells were washed and incubated in fresh medium containing 1% methyl cellulose. To examine the effect of anti-CD81 mAb to HCV cell-to-cell spread, Huh7.5.1 cells were infected by HCV (JFH-1) with an EGFP reporter. At 24 hpi, the cells were washed and incubated in fresh medium containing anti-IgG or anti-CD81 mAb together with 1% methyl cellulose. At 72 hpi, the number of EGFP-positive cells per foci was counted, and the size of the foci observed is expressed as the average percentage of total foci. All results are graphed as the mean ± SD for triplicate samples. The data presented are representative of three independent experiments
Figure 3
Figure 3
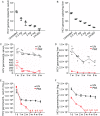
5-HT2AR functions in HCV late endocytosis at or before membrane fusion. (A) Inhibitory activities of PBZ on HCVcc (blue line), HCVpp (red line) and HCVrep (black line). Cells infected by HCVcc, HCVpp or that contains HCVrep were treated with PBZ at the indicated concentrations at 37 °C for 48 h. Virus infection and cell viability are expressed as percentages relative to 0.5% DMSO-treated control cells. (B) Cells containing sh-NC, sh-CD81 or sh-5HT2AR were infected by HCVcc, HCVpp or transfected with HCVrep and incubated at 37 °C for 48 h. Viral infections are quantified by qRT-PCR and expressed as percentages relative to sh-NC-containing cells. (C) The kinetics of HCV inhibition mediated by PBZ or other reagents was determined by time-of-addition assays. Huh7.5.1 cells were incubated with HCVcc at 4 °C for 2 h (T = − 2). At different time points (T = − 2 to T = 5), PBZ (10 μmol/L), bafilomycin A1 (10 nmol/L) and anti-CD81 mAb (5 μg/mL) were individually added to the cells at 37 °C for 2 h. (D) PBZ inhibits the post-attachment events. Huh7.5.1 cells were infected with HCVcc and incubated at 4 °C for 2 h. Unbound virus was removed by two washes with cold media. Fresh medium was subsequently added, and the cells were shifted to 37 °C to allow synchronous infection. PBZ (10 μmol/L), heparin (1 mg/mL), bafilomycin A1 (5 nmol/L) and anti-CD81 mAb (5 μg/mL) were provided in the media either continuously, during the 4 °C incubation only (initial attachment), or during the 37 °C incubation phase only (post-attachment). Virus infection is expressed as a percentage relative to control cells. (E) PBZ treatment does not affect the binding of HCV to host cells. Huh7.5.1 cells were incubated with wild-type HCVcc along with PBZ (10 μmol/L), heparin (0.5 mg/mL), anti-CD81 mAb (5 μg/mL) or NH4Cl (10 mmol/L) in culture at 4 °C for 2 h. Unbound virus was removed by two washes with cold media. The cells were then lysed, and viral RNA was extracted for detection by qRT-PCR. (F) The down-regulation of 5-HT2AR does not attenuate the binding of HCV to host cells. Huh7.5.1 cells containing sh-NC or sh-5HT2AR were incubated with HCVcc at 4 °C for 2 h. Unbound virus was removed by two washes with cold media. The cells were then lysed, and viral RNA was extracted for detection by qRT-PCR. (G) Huh7.5.1 cells are infected by HCVccDiD with the treatment of NH4Cl (20 mmol/L) and PBZ (20 μmol/L). Results are graphed as a percentage of maximum background-corrected relative fluorescence units (RFU) achieved in 0.5% DMSO-treated control cells. All results are graphed as the mean ± SD for triplicate samples
Figure 4
Figure 4
5-HT2AR plays a role in the membrane distribution of CLDN1. (A) The expression of 5-HT2AR, CD81, SR-BI, CLDN1 and OCLN in Huh7.5.1 whole cells containing sh-NC, sh-5HT2ARs and 5-HT2AR overexpression plasmids with indicated amounts. The expression of GAPDH is shown as an internal control. (B) The plasma membranes of Huh7.5.1 cells containing sh-NC, sh-5HT2ARs and 5-HT2AR overexpression plasmid were separated and the protein amounts of 5-HT2AR, CD81, SR-BI, CLDN1 and OCLN on the plasma membrane were analyzed by Western blot. (C) Cellular distribution of CLDN1 in the 5-HT2AR-silenced or overexpressed Huh7.5.1 cells. The localization of endogenous CLDN1 in Huh7.5.1 cells transfected with either an empty vector or 5HT2AR, or 5HT2AR-silenced cells was observed using confocal microscopy. CLDN1 expressions on the cell membrane in 5-HT2AR-silenced cells (D) or 5-HT2AR-overexpression cells (E) were assessed by flow cytometry. The situation of CLDN1 positioning on the membrane were plotted, during treatment with PBZ under various concentration (F) or either PBZ (20 μmol/L) (G) or H89 (1 μmol/L) (I) in 5-HT2AR-overexpression cells. (H) Exogenous CLDN1 was immunoprecipitated by CLDN1 antibody from indicated cell lysates, and immunoblotted with phosphorylation-Ser/Thr antibodies. The data presented are representative of three independent experiments
Figure 5
Figure 5
Drug-drug interaction of PBZ with selected different classes of anti-HCV drugs. Huh7.5.1 cells infected by HCVcc were treated with various concentrations of PBZ, IFN-α (A), ribavirin (B), sofosbuvir (C), boceprevir (D), telaprevir (E), daclatasvir (F) and cyclosporin A (G) alone, or in combinations at the indicated concentrations for 48 h. Antiviral activities were determined by measuring the reduction of luciferase activity in the cells. Differential surface plot at the 95% confidence level (CI) were calculated and generated by using MacSynergy II for the drug–drug interaction in the right panels. The 3-dimensional plot represents the differences between the actual experimental effects and the theoretical additive effects at various concentrations of two compounds in combination. Peaks above the theoretical additive plane indicate synergy. Only statistically significant (95% CI) differences between the two compounds were considered at any given concentration. The level of synergy is represented by the log volume values, and color-coded automatically. The level of synergy was defined in MacSynergy as moderate synergy (5 ≤ log volume < 9) and strong synergy (log volume ≥ 9). Results are graphed as the mean ± SD for duplicate samples
Figure 5
Figure 5
Drug-drug interaction of PBZ with selected different classes of anti-HCV drugs. Huh7.5.1 cells infected by HCVcc were treated with various concentrations of PBZ, IFN-α (A), ribavirin (B), sofosbuvir (C), boceprevir (D), telaprevir (E), daclatasvir (F) and cyclosporin A (G) alone, or in combinations at the indicated concentrations for 48 h. Antiviral activities were determined by measuring the reduction of luciferase activity in the cells. Differential surface plot at the 95% confidence level (CI) were calculated and generated by using MacSynergy II for the drug–drug interaction in the right panels. The 3-dimensional plot represents the differences between the actual experimental effects and the theoretical additive effects at various concentrations of two compounds in combination. Peaks above the theoretical additive plane indicate synergy. Only statistically significant (95% CI) differences between the two compounds were considered at any given concentration. The level of synergy is represented by the log volume values, and color-coded automatically. The level of synergy was defined in MacSynergy as moderate synergy (5 ≤ log volume < 9) and strong synergy (log volume ≥ 9). Results are graphed as the mean ± SD for duplicate samples
Figure 6
Figure 6
PBZ potently inhibits HCV in transgenic C/OTg mice. (A and B) HCV RNA levels in serum (genome copies per milliliter of serum) and liver (genome copies per milligram of liver) from mice infected by HCV with subsequent 1 week treatments with various concentrations of PBZ. The treatment of VX-950 with the concentration of 20 mg/kg/d was used as a positive control. (C and D) HCV RNA levels in serum (genome copies per milliliter of serum) and liver (genome copies per milligram of liver) from mice infected by HCV with the treatments of 2 mg/kg/d PBZ for 1 week to 8 weeks. (E and F) HCV RNA levels in serum (genome copies per milliliter of serum) and liver (genome copies per milligram of liver) from mice which PBZ treatment delayed the establishment of HCV infection in mice pretreated for 1 week before infection confirming the ability of this drug to inhibit HCV infection in vivo. Samples were analyzed by qRT-PCR. All results are graphed as the mean ± SD for triplicate samples. The data presented are representative of three independent experiments

Similar articles

Cited by

References

    1. Agnello V, Abel G, Elfahal M, Knight GB, Zhang QX. Hepatitis C virus and other flaviviridae viruses enter cells via low density lipoprotein receptor. Proc Natl Acad Sci USA. 1999;96(22):12766–12771. doi: 10.1073/pnas.96.22.12766. - DOI - PMC - PubMed
    1. Baldwin JJ, Christy ME, Denny GH, Habecker CN, Freedman MB, Lyle PA, et al. Beta 1-selective adrenoceptor antagonists: examples of the 2-[4-[3-(substituted amino)-2-hydroxypropoxy]phenyl]imidazole class. 2. J Med Chem. 1986;29(6):1065–1080. doi: 10.1021/jm00156a028. - DOI - PubMed
    1. Bang I, Choi HJ (2015) Structural features of beta2 adrenergic receptor: crystal structures and beyond. Mol Cells 38(2):105–111. 10.14348/molcells.2015.2301 (Epub 30 Dec 2014) - PMC - PubMed
    1. Barnes NM, Sharp T 91999) A review of central 5-HT receptors and their function. Neuropharmacology 38(8):1083–1152 (Epub 16 Aug 1999) - PubMed
    1. Berg KA, Clarke WP, Chen Y, Ebersole BJ, McKay RD, Maayani S. 5-Hydroxytryptamine type 2A receptors regulate cyclic AMP accumulation in a neuronal cell line by protein kinase C-dependent and calcium/calmodulin-dependent mechanisms. Mol Pharmacol. 1994;45(5):826–836. - PubMed

MeSH terms