. 2018 Mar 16;67(4):1-28.
doi: 10.15585/mmwr.ss6704a1.

Geographic Variations in Arthritis Prevalence, Health-Related Characteristics, and Management - United States, 2015

Affiliations

Geographic Variations in Arthritis Prevalence, Health-Related Characteristics, and Management - United States, 2015

Kamil E Barbour et al. MMWR Surveill Summ. .

Abstract

Problem/condition: Doctor-diagnosed arthritis is a common chronic condition affecting an estimated 23% (54 million) of adults in the United States, greatly influencing quality of life and costing approximately $300 billion annually. The geographic variations in arthritis prevalence, health-related characteristics, and management among states and territories are unknown. Therefore, public health professionals need to understand arthritis in their areas to target dissemination of evidence-based interventions that reduce arthritis morbidity.

Reporting period: 2015.

Description of system: The Behavioral Risk Factor Surveillance System is an annual, random-digit-dialed landline and cellular telephone survey of noninstitutionalized adults aged ≥18 years residing in the United States. Self-reported data are collected from the 50 states, the District of Columbia, Guam, and Puerto Rico. Unadjusted and age-standardized prevalences of arthritis, arthritis health-related characteristics, and arthritis management were calculated. County-level estimates were calculated using a validated statistical modeling method.

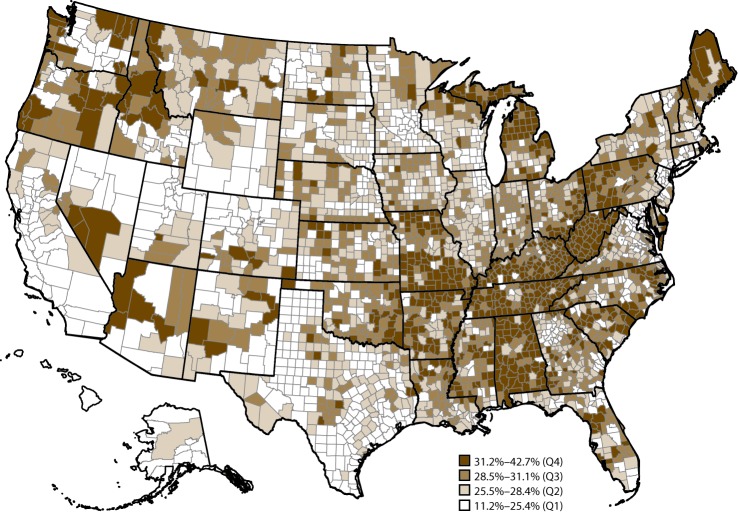
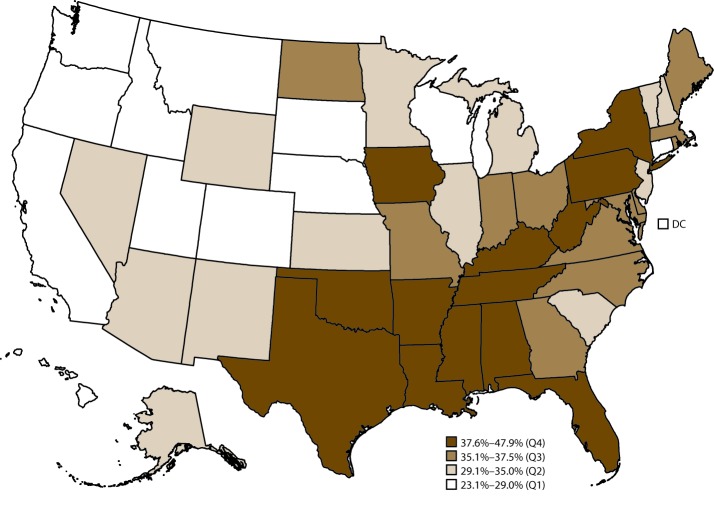
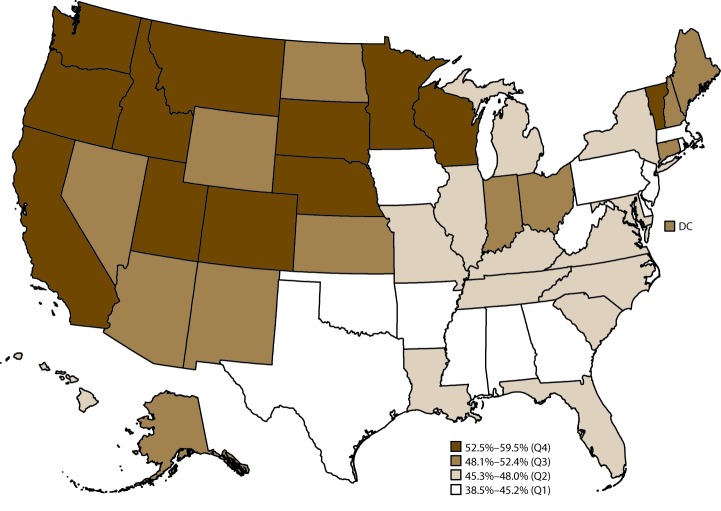
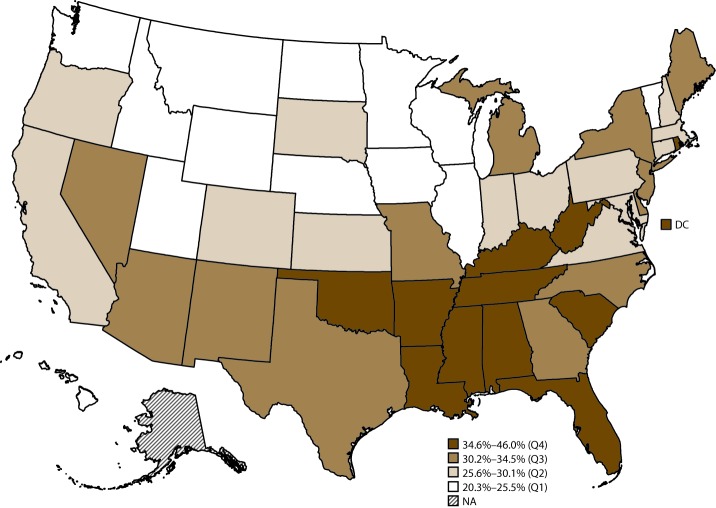
Results: In 2015, in the 50 states and the District of Columbia, median age-standardized prevalence of arthritis was 23.0% (range: 17.2%-33.6%). Modeled prevalence of arthritis varied considerably by county (range: 11.2%-42.7%). In 13 states that administered the arthritis management module, among adults with arthritis, the age-standardized median percentage of participation in a self-management education course was 14.5% (range: 9.1%-19.0%), being told by a health care provider to engage in physical activity or exercise was 58.5% (range: 52.3%-61.9%), and being told to lose weight to manage arthritis symptoms (if overweight or obese) was 44.5% (range: 35.1%-53.2%). Respondents with arthritis who lived in the quartile of states with the highest prevalences of arthritis had the highest percentages of negative health-related characteristics (i.e., arthritis-attributable activity limitations, arthritis-attributable severe joint pain, and arthritis-attributable social participation restriction; ≥14 physically unhealthy days during the past 30 days; ≥14 mentally unhealthy days during the past 30 days; obesity; and leisure-time physical inactivity) and the lowest percentage of leisure-time walking.

Interpretation: The prevalence, health-related characteristics, and management of arthritis varied substantially across states. The modeled prevalence of arthritis varied considerably by county.

Public health action: The findings highlight notable geographic variability in prevalence, health-related characteristics, and management of arthritis. Targeted use of evidence-based interventions that focus on physical activity and self-management education can reduce pain and improve function and quality of life for adults with arthritis and thus might reduce these geographic disparities.


Figures

FIGURE 1
FIGURE 1
Model-based prevalence* of arthritis among adults aged ≥18 years, by county — Behavioral Risk Factor Surveillance System, United States, 2015 Abbreviation: Q = quartile. * Prevalence of arthritis at the county level was estimated with a multilevel regression model and poststratification approach for counties (N = 3,142) in all 50 states and the District of Columbia. Prevalence was based on the Behavioral Risk Factor Surveillance System definition of arthritis. Doctor-diagnosed arthritis was defined as a yes response to the question “Has a doctor, nurse, or other health professional ever told you that you have some form of arthritis, rheumatoid arthritis, gout, lupus, or fibromyalgia?”
FIGURE 2
FIGURE 2
Age-standardized prevalence of physical inactivity* among adults aged ≥18 years with arthritis, by state — Behavioral Risk Factor Surveillance System, United States, 2015 Abbreviations: DC = District of Columbia; Q = quartile. * Physical inactivity was defined as a no response to the question “During the past month, other than your regular job, did you participate in any physical activities or exercises such as running, calisthenics, golf, gardening, or walking for exercise?”
FIGURE 3
FIGURE 3
Age-standardized prevalence of walking* among adults aged ≥18 years with arthritis, by state — Behavioral Risk Factor Surveillance System, United States, 2015 Abbreviations: DC = District of Columbia; Q = quartile. * Respondents with arthritis who reported walking or hiking for one of two questions: 1) “What type of physical activity or exercise did you spend the most time doing during the past month?” and 2) “What other type of physical activity gave you the next most exercise during the past month?”
FIGURE 4
FIGURE 4
Age-standardized prevalence of arthritis-attributable severe joint pain* among adults aged ≥18 years with arthritis, by state — Behavioral Risk Factor Surveillance System, United States, 2015 Abbreviations: DC = District of Columbia; NA = not applicable; Q = quartile. * Respondents with arthritis who answered 7, 8, 9, or 10 to the question “Please think about the past 30 days, keeping in mind all of your joint pain or aching and whether or not you have taken medication. During the past 30 days, how bad was your joint pain on average? Please answer on a scale of 0 to 10 where 0 is no pain or aching and 10 is pain or aching as bad as it can be.” Severe joint pain was defined as a pain level of 7–10. Estimate for one state (Alaska) with a relative standard error >30% or unweighted denominator <50 was suppressed as unreliable.

References

    1. Barbour KE, Helmick CG, Boring M, Brady TJ. Vital signs: prevalence of doctor-diagnosed arthritis and arthritis-attributable activity limitation—United States, 2013–2015. MMWR Morb Mortal Wkly Rep 2017;66:246–53. 10.15585/mmwr.mm6609e1 - DOI - PMC - PubMed
    1. Barbour KE, Helmick CG, Boring M, Zhang X, Lu H, Holt JB. Prevalence of doctor-diagnosed arthritis at state and county levels—United States, 2014. MMWR Morb Mortal Wkly Rep 2016;65:489–94. 10.15585/mmwr.mm6519a2 - DOI - PubMed
    1. Boring MA, Hootman JM, Liu Y, et al. Prevalence of arthritis and arthritis-attributable activity limitation by urban-rural county classification—United States, 2015. MMWR Morb Mortal Wkly Rep 2017;66:527–32. 10.15585/mmwr.mm6620a2 - DOI - PMC - PubMed
    1. Barbour KE, Boring M, Helmick CG, Murphy LB, Qin J. Prevalence of severe joint pain among adults with doctor-diagnosed arthritis—United States, 2002–2014. MMWR Morb Mortal Wkly Rep 2016;65:1052–6. 10.15585/mmwr.mm6539a2 - DOI - PubMed
    1. Hootman JM, Helmick CG, Barbour KE, Theis KA, Boring MA. Updated projected prevalence of self‐reported doctor‐diagnosed arthritis and arthritis‐attributable activity limitation among U.S. adults, 2015–2040. Arthritis Rheumatol 2016;68:1582–7. 10.1002/art.39692 - DOI - PMC - PubMed