The Deletion of Hdac4 in Mouse Osteoblasts Influences Both Catabolic and Anabolic Effects in Bone
- PMID: 29544022
- PMCID: PMC6457245
- DOI: 10.1002/jbmr.3422
The Deletion of Hdac4 in Mouse Osteoblasts Influences Both Catabolic and Anabolic Effects in Bone
Abstract
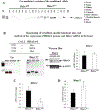
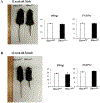
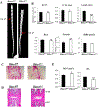
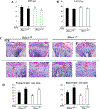
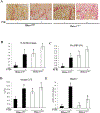
Histone deacetylase 4 (Hdac4) is known to control chondrocyte hypertrophy and bone formation. We have previously shown that parathyroid hormone (PTH) regulates many aspects of Hdac4 function in osteoblastic cells in vitro; however, in vivo confirmation was previously precluded by preweaning lethality of the Hdac4-deficient mice. To analyze the function of Hdac4 in bone in mature animals, we generated mice with osteoblast lineage-specific knockout of Hdac4 (Hdac4ob-/- ) by crossing transgenic mice expressing Cre recombinase under the control of a 2.3-kb fragment of the Col1a1 promoter with mice bearing loxP-Hdac4. The Hdac4ob-/- mice survive to adulthood and developed a mild skeletal phenotype. At age 12 weeks, they had short, irregularly shaped and stiff tails due to smaller tail vertebrae, with almost no growth plates. The tibial growth plate zone was also thinned, and Mmp13 and Sost mRNAs were increased in the distal femurs of Hdac4ob-/- mice. Immunohistochemistry showed that sclerostin was elevated in Hdac4ob-/- mice, suggesting that Hdac4 inhibits its gene and protein expression. To determine the effect of PTH in these mice, hPTH (1-34) or saline were delivered for 14 days with subcutaneously implanted devices in 8-week-old female Hdac4ob-/- and wild-type (Hdac4fl/fl ) mice. Serum CTX, a marker of bone resorption, was increased in Hdac4ob-/- mice with or without PTH treatment. Tibial cortical bone volume/total volume (BV/TV), cortical thickness (Ct.Th), and relative cortical area (RCA) were decreased in Hdac4ob-/- mice, but PTH caused no further decrease in Hdac4ob-/- mice. Tibial trabecular BV/TV and thickness were not changed significantly in Hdac4ob-/- mice but decreased with PTH treatment. These results indicate that Hdac4 inhibits bone resorption and has anabolic effects via inhibiting Mmp13 and Sost/sclerostin expression. Hdac4 influences cortical bone mass and thickness and knockout of Hdac4 prevents the catabolic effect of PTH in cortical bone. © 2018 American Society for Bone and Mineral Research.
Keywords: CATABOLIC EFFECTS OF PTH; CORTICAL BONE; HDAC4; OSTEOBLASTS; SCLEROSTIN.
© 2018 American Society for Bone and Mineral Research.
Conflict of interest statement
Figures



Similar articles
-
MMP-13 is one of the critical mediators of the effect of HDAC4 deletion on the skeleton.Bone. 2016 Sep;90:142-51. doi: 10.1016/j.bone.2016.06.010. Epub 2016 Jun 16. Bone. 2016. PMID: 27320207 Free PMC article.
-
Disruption of LRP6 in osteoblasts blunts the bone anabolic activity of PTH.J Bone Miner Res. 2013 Oct;28(10):2094-108. doi: 10.1002/jbmr.1962. J Bone Miner Res. 2013. PMID: 23609180 Free PMC article.
-
Differential temporal effects of sclerostin antibody and parathyroid hormone on cancellous and cortical bone and quantitative differences in effects on the osteoblast lineage in young intact rats.Bone. 2015 Dec;81:380-391. doi: 10.1016/j.bone.2015.08.007. Epub 2015 Aug 8. Bone. 2015. PMID: 26261096
-
The role of BMPs in bone anabolism and their potential targets SOST and DKK1.Curr Mol Pharmacol. 2012 Jun;5(2):153-63. doi: 10.2174/1874467211205020153. Curr Mol Pharmacol. 2012. PMID: 21787290 Review.
-
Studies on the mechanisms of the skeletal anabolic action of endogenous and exogenous parathyroid hormone.Arch Biochem Biophys. 2008 May 15;473(2):218-24. doi: 10.1016/j.abb.2008.03.003. Epub 2008 Mar 10. Arch Biochem Biophys. 2008. PMID: 18358824 Review.
Cited by
-
Histone Acetylation as a Regenerative Target in the Dentine-Pulp Complex.Front Genet. 2020 Feb 6;11:1. doi: 10.3389/fgene.2020.00001. eCollection 2020. Front Genet. 2020. PMID: 32117431 Free PMC article. Review.
-
Osteoblastic monocyte chemoattractant protein-1 (MCP-1) mediation of parathyroid hormone's anabolic actions in bone implicates TGF-β signaling.Bone. 2021 Feb;143:115762. doi: 10.1016/j.bone.2020.115762. Epub 2020 Nov 17. Bone. 2021. PMID: 33212319 Free PMC article.
-
FTY720 Attenuates LPS-Induced Inflammatory Bone Loss by Inhibiting Osteoclastogenesis via the NF-κB and HDAC4/ATF Pathways.J Immunol Res. 2023 Jan 6;2023:8571649. doi: 10.1155/2023/8571649. eCollection 2023. J Immunol Res. 2023. PMID: 36644540 Free PMC article.
-
Comprehensive analysis of Transcription Factors identified novel prognostic biomarker in human bladder cancer.J Cancer. 2021 Jul 25;12(18):5605-5621. doi: 10.7150/jca.58484. eCollection 2021. J Cancer. 2021. PMID: 34405021 Free PMC article.
-
Loss of Hdac4 in osteoprogenitors impairs postnatal trabecular and cortical bone formation, resulting in a dwarfism and osteopenia phenotype in mice.J Biol Chem. 2024 Dec;300(12):107941. doi: 10.1016/j.jbc.2024.107941. Epub 2024 Oct 29. J Biol Chem. 2024. PMID: 39481602 Free PMC article.
References
-
- Vega RB, Matsuda K, Oh J, Barbosa AC, Yang X, Meadows E, McAnally J, Pomajzl C, Shelton J, Richardson JA, Karsenty G, and Olson EN. Histone deacetylase 4 controls chondrocyte hypertrophy during skeletogenesis. Cell 2004;119: 555–66. - PubMed
-
- Arnold MA,Yim K, Czubryt MP, Phan D, McAnally J, Qi X, Shelton JM, Richardson JA,, Bassel-Duby R, and Olson EN. MEF2C transcription factor controls chondrocyte hypertrophy and bone development. Dev Cell 2007;12:377–89. - PubMed
Publication types
MeSH terms
Substances
Grants and funding
LinkOut - more resources
Full Text Sources
Other Literature Sources
Molecular Biology Databases
Research Materials
Miscellaneous

