Implicit ligand theory for relative binding free energies
- PMID: 29544299
- PMCID: PMC5851784
- DOI: 10.1063/1.5017136
Implicit ligand theory for relative binding free energies
Abstract
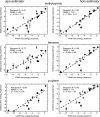
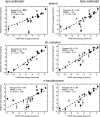
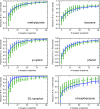
Implicit ligand theory enables noncovalent binding free energies to be calculated based on an exponential average of the binding potential of mean force (BPMF)-the binding free energy between a flexible ligand and rigid receptor-over a precomputed ensemble of receptor configurations. In the original formalism, receptor configurations were drawn from or reweighted to the apo ensemble. Here we show that BPMFs averaged over a holo ensemble yield binding free energies relative to the reference ligand that specifies the ensemble. When using receptor snapshots from an alchemical simulation with a single ligand, the new statistical estimator outperforms the original.
Figures


Similar articles
-
Alchemical Grid Dock (AlGDock): Binding Free Energy Calculations between Flexible Ligands and Rigid Receptors.J Comput Chem. 2020 Mar 15;41(7):715-730. doi: 10.1002/jcc.26036. Epub 2019 Aug 9. J Comput Chem. 2020. PMID: 31397498 Free PMC article.
-
Implicit ligand theory for relative binding free energies: II. An estimator based on control variates.J Phys Commun. 2020 Nov;4(11):115010. doi: 10.1088/2399-6528/abcbac. Epub 2020 Nov 26. J Phys Commun. 2020. PMID: 33817346 Free PMC article.
-
Using the fast fourier transform in binding free energy calculations.J Comput Chem. 2018 Apr 30;39(11):621-636. doi: 10.1002/jcc.25139. Epub 2017 Dec 22. J Comput Chem. 2018. PMID: 29270990 Free PMC article.
-
Implicit ligand theory: rigorous binding free energies and thermodynamic expectations from molecular docking.J Chem Phys. 2012 Sep 14;137(10):104106. doi: 10.1063/1.4751284. J Chem Phys. 2012. PMID: 22979849 Free PMC article.
-
Ligand-receptor affinities computed by an adapted linear interaction model for continuum electrostatics and by protein conformational averaging.J Chem Inf Model. 2014 Aug 25;54(8):2309-19. doi: 10.1021/ci500301s. Epub 2014 Aug 6. J Chem Inf Model. 2014. PMID: 25076043
Cited by
-
Alchemical Grid Dock (AlGDock): Binding Free Energy Calculations between Flexible Ligands and Rigid Receptors.J Comput Chem. 2020 Mar 15;41(7):715-730. doi: 10.1002/jcc.26036. Epub 2019 Aug 9. J Comput Chem. 2020. PMID: 31397498 Free PMC article.
-
Efficiency of Stratification for Ensemble Docking Using Reduced Ensembles.J Chem Inf Model. 2018 Sep 24;58(9):1915-1925. doi: 10.1021/acs.jcim.8b00314. Epub 2018 Aug 29. J Chem Inf Model. 2018. PMID: 30114370 Free PMC article.
-
Alchemical Grid Dock (AlGDock) calculations in the D3R Grand Challenge 3 : Binding free energies between flexible ligands and rigid receptors.J Comput Aided Mol Des. 2019 Jan;33(1):61-69. doi: 10.1007/s10822-018-0143-9. Epub 2018 Aug 6. J Comput Aided Mol Des. 2019. PMID: 30084078 Free PMC article.
-
Implicit ligand theory for relative binding free energies: II. An estimator based on control variates.J Phys Commun. 2020 Nov;4(11):115010. doi: 10.1088/2399-6528/abcbac. Epub 2020 Nov 26. J Phys Commun. 2020. PMID: 33817346 Free PMC article.
-
Developing end-point methods for absolute binding free energy calculation using the Boltzmann-quasiharmonic model.Phys Chem Chem Phys. 2022 Mar 9;24(10):6037-6052. doi: 10.1039/d1cp05075c. Phys Chem Chem Phys. 2022. PMID: 35212338 Free PMC article.
References
Grants and funding
LinkOut - more resources
Full Text Sources
Other Literature Sources

