Comparative Study
. 2018 Mar 15;19(1):33.
doi: 10.1186/s13059-018-1408-2.

Comparison of whole-genome bisulfite sequencing library preparation strategies identifies sources of biases affecting DNA methylation data

Affiliations
Comparative Study

Comparison of whole-genome bisulfite sequencing library preparation strategies identifies sources of biases affecting DNA methylation data

Nelly Olova et al. Genome Biol. .

Erratum in

Abstract

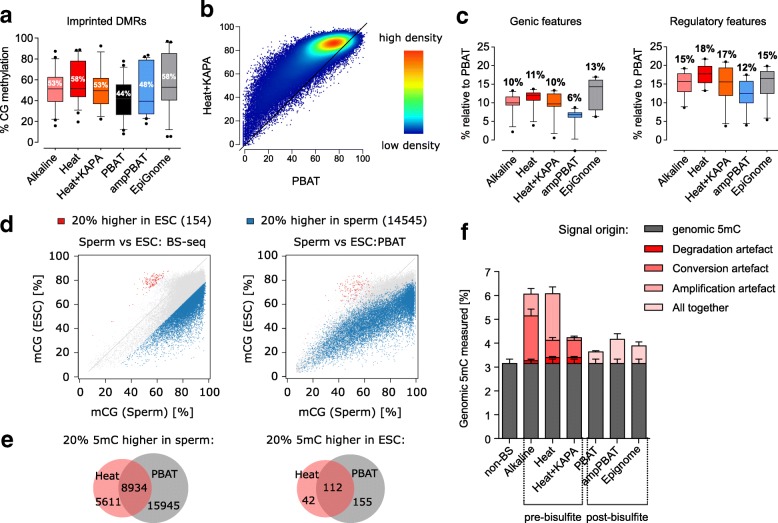
Background: Whole-genome bisulfite sequencing (WGBS) is becoming an increasingly accessible technique, used widely for both fundamental and disease-oriented research. Library preparation methods benefit from a variety of available kits, polymerases and bisulfite conversion protocols. Although some steps in the procedure, such as PCR amplification, are known to introduce biases, a systematic evaluation of biases in WGBS strategies is missing.

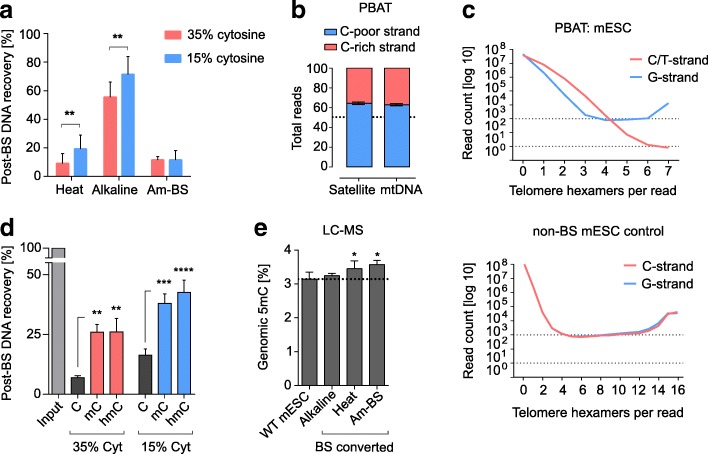
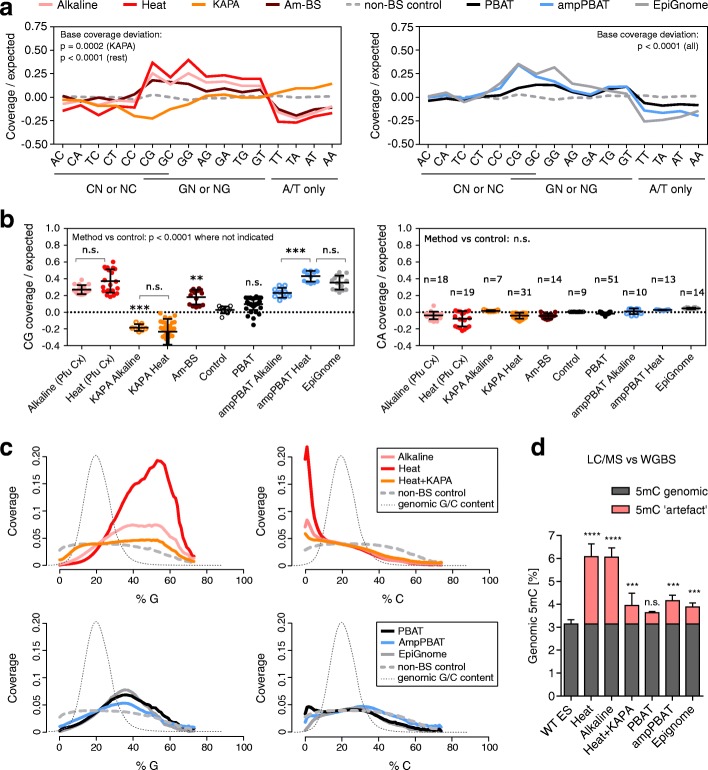
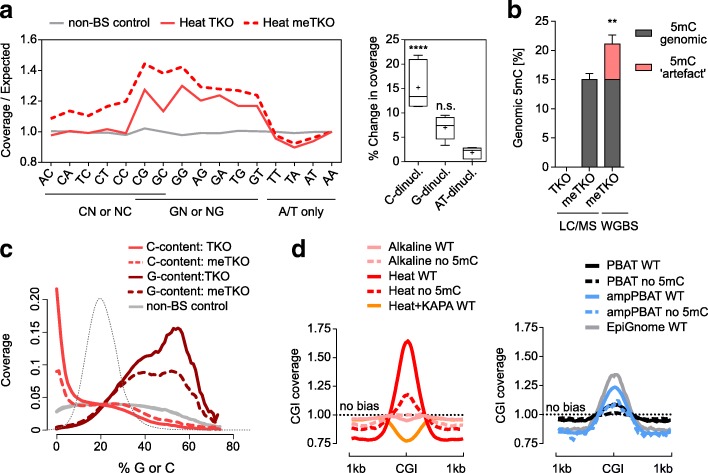
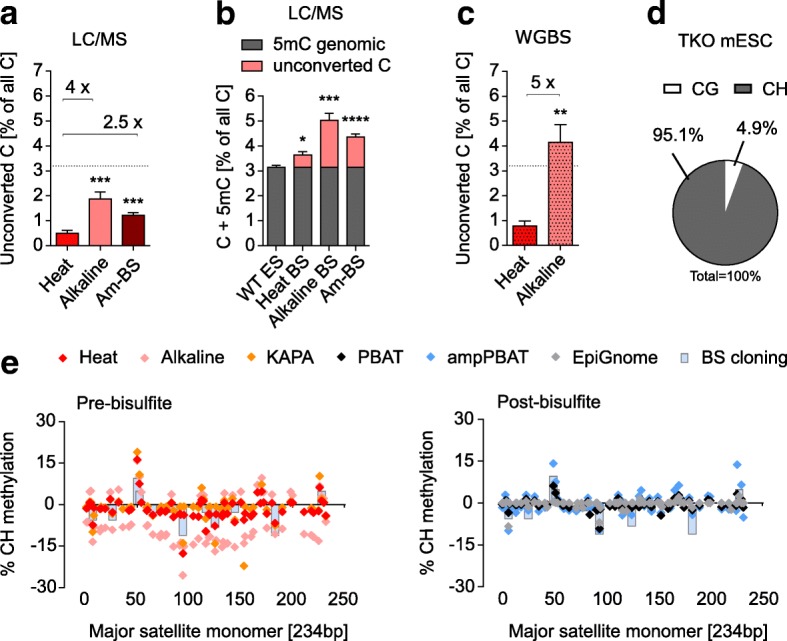
Results: We perform a comparative analysis of several commonly used pre- and post-bisulfite WGBS library preparation protocols for their performance and quality of sequencing outputs. Our results show that bisulfite conversion per se is the main trigger of pronounced sequencing biases, and PCR amplification builds on these underlying artefacts. The majority of standard library preparation methods yield a significantly biased sequence output and overestimate global methylation. Importantly, both absolute and relative methylation levels at specific genomic regions vary substantially between methods, with clear implications for DNA methylation studies.

Conclusions: We show that amplification-free library preparation is the least biased approach for WGBS. In protocols with amplification, the choice of bisulfite conversion protocol or polymerase can significantly minimize artefacts. To aid with the quality assessment of existing WGBS datasets, we have integrated a bias diagnostic tool in the Bismark package and offer several approaches for consideration during the preparation and analysis of WGBS datasets.

Keywords: Artefacts; Biases; Bisulfite conversion; DNA methylation; Degradation; GC skew; NGS; Polymerase; WGBS.


Conflict of interest statement

Ethics approval and consent to participate

Not applicable.

Consent for publication

Not applicable.

Competing interests

The authors declare no competing financial interests. WR is a consultant and shareholder at Cambridge Epigenetix Ltd.

Publisher’s Note

Springer Nature remains neutral with regard to jurisdictional claims in published maps and institutional affiliations.

Figures

Fig. 1
Fig. 1
Biased degradation of unmethylated C-rich DNA after bisulfite treatment. a Post-bisulfite recovery of C-rich and C-poor DNA fragments treated with different BS conversion protocols. Fragment sequences originate from the M13 phage sequence (Additional file 2: Table S1). Statistical analysis was performed with a two-way ANOVA, p = 0.0034 for cytosine content (‘Heat’ and ‘Alkaline’ only) and p < 0.0001 for the method. b Asymmetric C-rich (23–24% C) and C-poor (12–14% C) strand representation in the mouse major satellite repeat and mtDNA in amplification-free PBAT datasets. The total read count per strand is represented as a proportion of 100%. c Telomere repeat count per read in amplification-free PBAT and non-BS converted NGS control. To assess the fragmentation rate of the C-strand with increase of tandem count and cytosine content, reads containing G-strand tandems ([TTAGGG]n) were quantified separately from unconverted and BS converted (in PBAT) C-strand tandems ([CCCTAA]n and [TTTTAA]n, respectively). Each plot represents a single dataset. C-strand reads containing less than four to six tandems are genuine [TTTTAA]n repeats of non-telomere origin (results not shown; see “Methods”). d Post-bisulfite recovery of unmethylated, fully methylated and hydroxylated C-rich and C-poor DNA fragments treated with different BS conversion protocols. One-way ANOVA was performed with Tukey’s multiple comparisons test. e LC-MS measurement of total genomic 5mC levels in mouse ESC gDNA before (WT mESC) and after treatment with different BS-conversion protocols (Alkaline, Heat, Am-BS). 5mC is represented as a percentage of all cytosines; the converted cytosines were measured as uracils in the BS converted samples. Individual two-tailed paired t-tests were performed within matched sample–control pairs. Details on number of WGBS datasets used for each analysis are presented in Additional file 1. *p < 0.05, **p < 0.01, ***p<0.001, ****p<0.0001; error bars represent standard deviation
Fig. 2
Fig. 2
Effect of PCR and polymerase bias on sequence coverage and methylation estimates. a Coverage of dinucleotides in WGBS datasets generated with four pre-bisulfite (left panel) and three post-bisulfite (right panel) library preparation protocols. Averaged coverage values per method are expressed as log2 difference from the genomic expected and compared to a non-BS-treated control. For clarity, the dinucleotides are underlined as derived from C, G or A/T only. Statistical analysis of overall dinucleotide (base) coverage was performed on the average absolute deviations from control with one sample two-tailed t-tests followed by Bonferroni correction. Individual libraries/sequencing runs and studies per method are presented in Additional file 2: Figure S3a; details on study, laboratory and species can be found in Table 2 and Additional file 1. b CG dinucleotide coverage over expected for each individual library per method (left panel) and unbiased CA dinucleotide coverage for comparison (right panel). The main method groups are additionally split into subgroups of Heat and Alkaline for KAPA and ampPBAT, as shown also in Additional file 2: Figure S3a. The number of libraries per method is presented in the right panel. Pfu Cx in brackets next to the main Alkaline and Heat methods stands for the Pfu Turbo Cx polymerase, which they are generated with (all method details are provided in Table 2). Statistical analysis on CG coverage was performed with one-way ANOVA with Bonferroni correction. c Read coverage dependence on the G/C composition in 100-bp tiles. Cytosine content of reads was calculated from the corresponding genomic sequence and not the actual read sequence, where unmethylated cytosines appear as thymines. The tile distribution per G/C content is plotted in the background along the x-axis for reference. Am-BS was omitted from this analysis due to unavailability of same species datasets. d Global methylation levels of mESCs as measured by LC-MS and a panel of WGBS datasets. The LC-MS value is an average for J1 and E14 lines from different passages and studies to account for lineage and tissue culturing variances. The differences between the LC-MS values and WGBS measurements are marked as a methylation ‘artefact’ within each WGBS method. Significance is calculated by one-way ANOVA with Dunnett’s multiple comparisons test on the absolute WGBS values (‘genomic’ + ‘artefact’) against the LC-MS value. **p < 0.01, ***p < 0.001, ****p < 0.0001; n.s. not significant; error bars represent standard deviation
Fig. 3
Fig. 3
Effect of DNA methylation status on the degradation and amplification biases. a Coverage of dinucleotides in WGBS datasets from unmethylated and in vitro M.CviPI-methylated TKO DNA prepared with the Heat BS-seq protocol. For direct comparison, the increase in coverage is expressed as fold difference from the genomic average and normalised to the AA dinucleotide. The dinucleotides are grouped as derived from C, G or A/T only and presented in the box-plot panel (right) as total percentage increase in coverage; crosses mark mean values and error bars represent minimum and maximum values. Statistical analysis was performed with one-way ANOVA with Dunnett’s multiple comparisons test against the AT-only dinucleotides; ****p < 0.0001. b Global methylation levels of the in vitro M.CviPI-methylated TKO DNA. The difference between the LC-MS and WGBS values is marked as a methylation ‘artefact’ as in Fig. 2. Significance between the two values was assessed with a two-tailed unpaired t-test, **p < 0.01; error bars represent standard deviation; n.s. not significant. c Read coverage dependence on the G/C composition before and after in vitro M.CviPI methylation. Cytosine content of reads was calculated over 100-bp tiles and matched to the corresponding genomic sequence and not the actual read sequence, where unmethylated cytosines are converted to thymines. Dotted black line represents the tile count distribution in G/C content. d Coverage of CG islands (CGI) in WGBS datasets of mouse WT ESCs (i.e. with similar level of methylation) compared to unmethylated DNA generated with the same library preparation protocols. Heat+KAPA and EpiGnome protocols are included only as WT values for reference, due to unavailability of corresponding unmethylated DNA datasets. Values are expressed as fold-difference from a coverage ‘no bias’ line
Fig. 4
Fig. 4
Effect of conversion artefacts on the biases in WGBS. a Presence of unconverted cytosines as percentage of total cytosine content, measured by LC-MS for three different BS-conversion protocols. The three protocols differ by denaturation method (Heat or Alkaline) or molarity of bisulfite (4.5 vs 9 M for Am-BS) but not by BS incubation temperature (65–70 °C). Averaged fold differences in quantity are shown above horizontal brackets, and a dotted line shows the usual level of genomic 5mC for reference of scale. For conversion differences between methods with 50 and 65 °C incubation temperatures, see Additional file 2: Figure S10a. b A theoretical sum of 5mC and unconverted C as measured by LC-MS for J1 WT mESCs for three BS conversion protocols. Both 5mC and unconverted C will be interpreted as 5mC after amplification of WGBS libraries, boosting the overall levels of methylation, depending on the BS treatment protocol. c Absolute quantification of unconverted cytosines in the unmethylated TKO mESC line, as measured by Heat and Alkaline BS-seq. d Context distribution of BS conversion artefacts; the value is the same for Heat and Alkaline and therefore plotted as an average. e CH methylation on both strands of the mouse major satellite repeat as measured by pre- and post-bisulfite WGBS methods. 5mC percentage from the BS cloning from Additional file 2: Figure S5a is plotted in both panels for reference. Positive y-axis values indicate the top strand and negative the bottom strand. Statistical analyses in ac were performed for matched experimental pairs with unpaired two-tailed t-tests against Heat in a and c, and WT ES in b. Error bars in ac represent standard error of the mean, *p < 0.05, **p < 0.01, ***p < 0.001, ****p < 0.0001
Fig. 5
Fig. 5
Effect of biases and artefacts on the output of 5mC quantification. a Average methylation values of iDMRs. Numbers indicate the mean value, error bars span the 10–90 percentile. b Genome-wide comparison of absolute methylation levels for the amplification-free PBAT approach and the Heat+KAPA BS-seq. c Differences in the absolute quantification of genomic and regulatory features between the amplification-free PBAT (at value 0) and amplified WGBS datasets. Numbers indicate the mean value, error bars show the 10–90 percentile. d Comparison of relative methylation differences between sperm and ESC sequenced with either amplification-free PBAT or Heat BS-seq. Each dot represents a probe over 150 consecutive cytosines from the same genomic region in ESC and sperm. The plotted over 20% mCG differences are generated from the BS-seq method (left panel) and visualised with the same colour onto the PBAT data (right panel). Averaged values were used for BS-seq (2 × ESC and 5 × sperm replicates) and a single replicate for PBAT. e Venn diagrams showing how many of the over 20% mCG regions from d overlap between BS-seq and PBAT. f A breakdown of relative contribution of biases for the BS-seq protocols as measured by LC-MS and WGBS. For post-bisulfite protocols, the overall combined bias is shown as individual contributions are less trivial to dissect. The non-BS 5mC measurement averages LC-MS measurements for mESC lines from different studies and passages to account for culturing and lineage variances. Error bars represent standard deviation
Fig. 6
Fig. 6
Dealing with biases and artefacts. a A screenshot from the Bismark ‘bam2nuc’ module output, showing base and dinucleotide content in a Heat dataset against the genomic expected value. The C base indicates the extent of degradation-caused bias (negative correlation), the G-base and its derivative dinucleotides as well as the A/T bases and dinucleotides show the extent and direction of amplification bias—G(C)- or AT-biasing. b Comparison of two methylation quantification strategies to overcome or decrease the effects of GC- or AT-biasing protocols. Counting a total number of methylation calls within a probe (region), irrespective of their position and depth, is compared to calculating methylation values of individual CGs and averaging those for the whole probe. None of those approaches applies initial coverage depth filtering, which is shown in Additional file 2: Figure S9. ce Non-CG methylation in the major satellite after removing conversion noise by c setting a 10 or 20% 5mC cut-off threshold value, d after a bioinformatic filter was applied to remove every read with three or more methylated CH cytosines, and e after subtracting the background values from an unmethylated genome control (TKO mESC). Positive y-axis values indicate the top strand and negative the bottom strand

References

    1. Frommer M, Mcdonald LE, Millar DS, Collist CM, Wattt F, Griggt GW, et al. A genomic sequencing protocol that yields a positive display of 5-methylcytosine residues in individual DNA strands. Proc Natl Acad Sci U S A. 1992;89:1827–1831. doi: 10.1073/pnas.89.5.1827. - DOI - PMC - PubMed
    1. Grunau C, Clark SJ, Rosenthal A. Bisulfite genomic sequencing: systematic investigation of critical experimental parameters. Nucleic Acids Res. 2001;29:E65. doi: 10.1093/nar/29.13.e65. - DOI - PMC - PubMed
    1. Warnecke PM, Stirzaker C, Song J, Grunau C, Melki JR, Clark SJ. Identification and resolution of artifacts in bisulfite sequencing. Methods. 2002;27:101–107. doi: 10.1016/S1046-2023(02)00060-9. - DOI - PubMed
    1. Harris RA, Wang T, Coarfa C, Nagarajan RP, Hong C, Downey SL, et al. Comparison of sequencing-based methods to profile DNA methylation and identification of monoallelic epigenetic modifications. Nat Biotechnol. 2010;28:1097–1105. doi: 10.1038/nbt.1682. - DOI - PMC - PubMed
    1. Genereux DP, Johnson WC, Burden AF, Stöger R, Laird CD. Errors in the bisulfite conversion of DNA: modulating inappropriate- and failed-conversion frequencies. Nucleic Acids Res. 2008;36:e150. doi: 10.1093/nar/gkn691. - DOI - PMC - PubMed

Publication types