Review
. 2018 Jul:65:1-27.
doi: 10.1016/j.preteyeres.2018.03.002. Epub 2018 Mar 12.

Epigenetic control of gene regulation during development and disease: A view from the retina

Affiliations
Review

Epigenetic control of gene regulation during development and disease: A view from the retina

Ximena Corso-Díaz et al. Prog Retin Eye Res. 2018 Jul.

Abstract

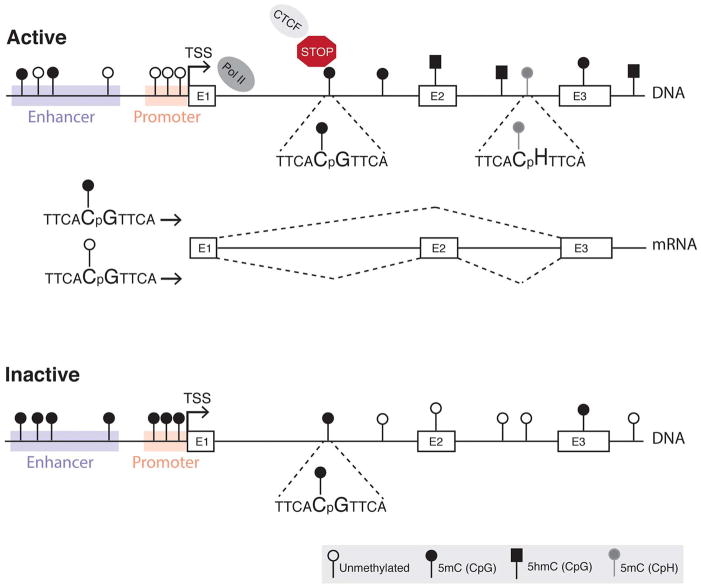
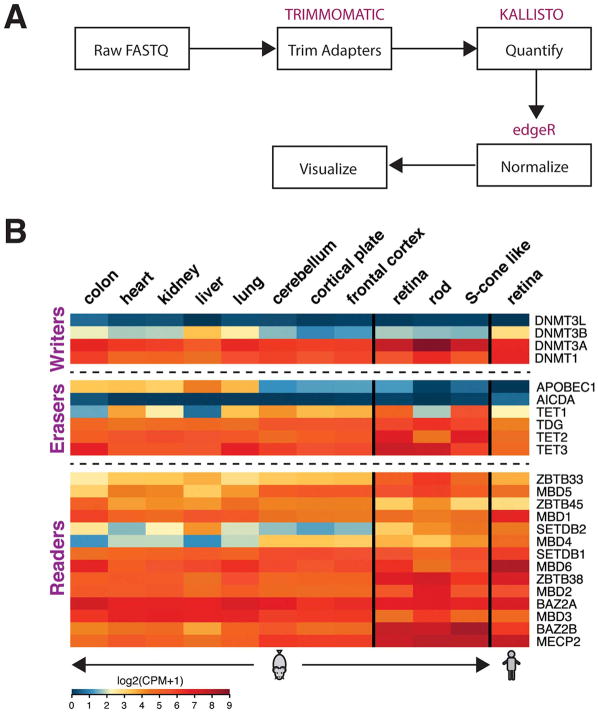
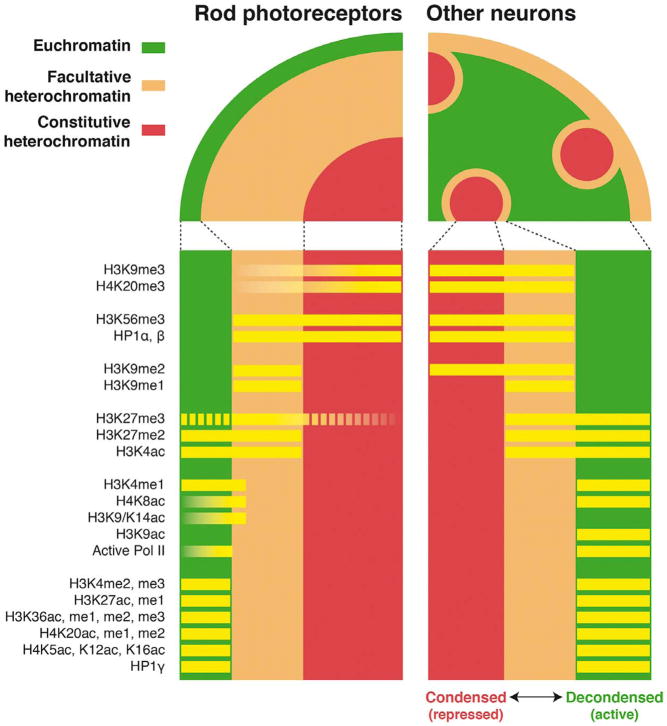
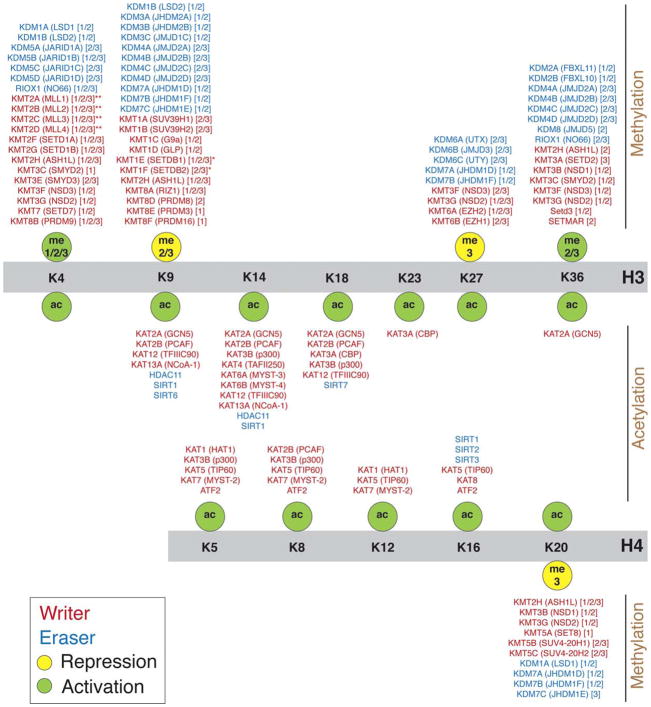
Complex biological processes, such as organogenesis and homeostasis, are stringently regulated by genetic programs that are fine-tuned by epigenetic factors to establish cell fates and/or to respond to the microenvironment. Gene regulatory networks that guide cell differentiation and function are modulated and stabilized by modifications to DNA, RNA and proteins. In this review, we focus on two key epigenetic changes - DNA methylation and histone modifications - and discuss their contribution to retinal development, aging and disease, especially in the context of age-related macular degeneration (AMD) and diabetic retinopathy. We highlight less-studied roles of DNA methylation and provide the RNA expression profiles of epigenetic enzymes in human and mouse retina in comparison to other tissues. We also review computational tools and emergent technologies to profile, analyze and integrate epigenetic information. We suggest implementation of editing tools and single-cell technologies to trace and perturb the epigenome for delineating its role in transcriptional regulation. Finally, we present our thoughts on exciting avenues for exploring epigenome in retinal metabolism, disease modeling, and regeneration.

Keywords: Chromatin; DNA methylation; Histone modification; Neuronal differentiation; Next generation sequencing; Photoreceptor; Retina neurodegeneration.


Figures

Fig. 1
Fig. 1
Context-dependent roles of DNA methylation. In active genes, DNA methylation is usually absent at the promoter, is low at enhancer regions and variable at gene bodies (Jones, 2012). Neuronal genes may harbor 5hmC and 5mC in the CpG context and/or 5mC in the CpH context (H = A, T or C) at their gene bodies (Lister et al., 2013). CTCF links DNA methylation to RNA splicing by binding to DNA near an alternative exon (E2), halting RNA polymerase and allowing the incorporation of E2 into the transcript (Shukla et al., 2011). DNA methylation can prevent CTCF binding, and thereby the incorporation of alternative exons. Inactive genes usually are methylated at their promoter and enhancer regions, and contain variable methylation at gene bodies with no 5hmC or 5mC in the CpH context.
Fig. 2
Fig. 2
Expression of writers, erasers and readers of DNA methylation. (A) Schematic of expression analysis. Raw RNA-seq reads from adult mouse tissues and human retina were initially filtered for low quality and adapter contamination using Trimmomatic (v0.36). Transcript level quantification was performed using the kallisto (v0.43) utility. All data were analyzed as single end sequences. Gene level quantification was computed using the tximport R package on Ensembl (version 84 and 82 for mouse and human data sets, respectively). Normalization was performed using trimmed mean of M-values (TMM) and counts per million (CPM) values were computed using the edgeR package. RNA-seq data were obtained from the following sources: sorted rods and S-cone-like cells (Kim et al., 2016b), mouse retina (Hoshino et al., 2017), unpublished human retina (available at https://neicommons.nei.nih.gov/#/), and non-retinal tissues (Pervouchine et al., 2015). (B) Heatmaps of expression data from indicated adult tissues. We included only genes having a one-to-one mapping between human and mouse annotations. The retina expression data are more similar to neural tissues. Scale of expression values is shown as log2 of Counts per million (CPM) +1, with blue representing low and red high expression values.
Fig. 3
Fig. 3
Distribution of histone modifications and associated proteins along distinct chromatin domains in retinal neurons. All neurons in the mouse retina, except rods, have conventional nuclei comprising of central euchromatin and peripheral clusters of heterochromatin; however, rod photoreceptors have central domains of heterochromatin with euchromatin localized at the periphery (Eberhart et al., 2013; Solovei et al., 2009). H3K9me2 is the only mark exhibiting a differential distribution between rod photoreceptors and other retinal neurons, and the presence of H3K27me3 in euchromatin and constitutive heterochromatin is discordant between studies (represented by dashed lines). The data was compiled from (Eberhart et al., 2013) and (Kizilyaprak et al., 2010).
Fig. 4
Fig. 4
Targets of (de)acetylating and (de)methylating enzymes on lysine (K) residues of histone H3 and H4 Nter tails. A diverse group of enzymes can add (writers, shown in red) or remove (erasers, shown in blue) acetyl or methyl groups to/from histone tails. Enzyme names are according to the nomenclature established in (Allis et al., 2007) with common names indicated in parenthesis. The degree of methylation targeted by the methyltransferases and demethylases are shown in square brackets. The key hallmarks associated with gene activation (shown in green) and repression (shown in yellow) are explained in Section 3.1. *Methyltransferases containing the methyl-CpG binding domain (MBD). **Methyltransferases containing the CXXC domain recognizing unmethylated cytosines. Additional details pertaining to these enzymes are provided in Tables 1 and 2.
Fig. 5
Fig. 5
Heatmaps showing gene expression of enzymes that catalyze (de)acetylation and (de)methylation of lysine residues in histone H3 and H4 Nter tails. Expression data was extracted from RNA-seq profiles of indicated tissues and cell types, as elaborated in the legend of Fig. 2. While a majority of genes are widely expressed, the retina displays unique patterns of expression. High expression of Setd7, Hdac7 and Prdm16 in the retina, but not in photoreceptors, suggests their potential functions in the inner retina. Scale of expression values is shown as log2 of Counts per million (CPM) +1, with blue representing low and red high expression values.
Fig. 6
Fig. 6
Survey of DNA methylation. Methods to identify 5-methyl-cytosine (5mC) and 5-methyl-hydroxy-cytosine (5hmC) are frequently used in combination with polymerase chain reaction (PCR), next-generation sequencing, or DNA microarrays. Some of these methods, such as genomewide bisulfite sequencing (WGBS-seq) and reduced representation bisulfite sequencing (RRBS), cannot distinguish between 5mC and 5hmC. In bisulfite sequencing, a bisulfite salt converts all unmethylated cytosines to uracyl. In RRBS, specific methylation-insensitive enzymes are used to digest DNA and, after size selection, only a fraction of the genome biased towards CpG rich regions is surveyed (Meissner et al., 2005). To distinguish 5mC from 5hmC, specific antibodies are used in Methylated DNA immunoprecipitation (MeDIP) method (Thu et al., 2009). Nanopore sequencing can detect the electrolytic current signals of base modifications by moving the single-strand DNA molecule through a protein pore (Laszlo et al., 2013). In Tet-assisted bisulfite sequencing (TAB-seq) (Yu et al., 2012), 5hmC is glucosylated by β-glucosyltransferase (βGT) to protect 5hmC from the action of TET enzymes, which convert the 5mC into 5caC. Bisulfite treatment then converts 5caC into U leaving the glucosylated 5hmC intact.
Fig. 7
Fig. 7
Chromatin immunoprecipitation of specific retinal cell types to investigate histone modifications. Various retinal cell types can be purified by: immunopanning (Wang et al., 2007), immunomagnetic purification (Sajgo et al., 2017), laser capture microdissection (Kim et al., 2006), isolation of nuclei tagged in specific cell types (INTACT) (Mo et al., 2016), or fluorescence-activated cell sorting (FACS) (Kim et al., 2016b). FACS and INTACT have been used for ChIP of histone modifications in the retina (Kim et al., 2016b; Mo et al., 2016). Several fluorescent reporter lines could be used to purify different retinal populations (Siegert et al., 2009). Whole retina or purified cell populations are crosslinked with paraformaldehyde (Park, 2009). The nuclear fraction is isolated, followed by sonication to shear chromatin into small fragments. Antibodies against specific histone modifications can pulldown accompanying genomic DNA regions. Reverse-crosslinking and DNA purification are then followed by PCR and/or next generation sequencing. Mapping to the genome and subsequent comparison with transcriptome datasets permit correlations of histone modifications with transcription (Chaitankar et al., 2016; Yang et al., 2015).
Fig. 8
Fig. 8
Whole-genome bisulfite sequencing workflow and analysis. Genomic DNA from cells or tissues is fragmented and treated with sodium bisulfite to convert unmethylated cytosine residues to uracyl (Lizardi et al., 2017). Unmethylated DNA from lambda phage is often added to control for bisulfite conversion efficiency. Library preparation includes adapter ligation and PCR amplification. Addition of a high-complexity library is necessary to obtain high quality sequencing reads. Raw FASTQ sequencing reads are validated for quality and adapter contamination. After trimming low quality reads and adapters, the reads are aligned to a bisulfite-converted reference genome, duplicate alignments are removed and differentially methylated regions (DMRs) are identified. Further downstream analysis includes annotation of DMRs and their correlation to the transcriptome.
Fig. 9
Fig. 9
Heatmaps showing gene expression of epigenetic enzymes during mouse retinal development. Gene-level analysis of RNA-seq data during mouse retinogenesis shows variable patterns of expression of epigenetic modifiers involved in DNA methylation (upper panel) and histone modifications (lower panel). This temporal and spatial distribution contributes to the regulation of distinct biological processes and cellular diversity during retinal development. The figure shows only enzymes whose function has been studied in mice or that are differentially expressed during development. The RNA-seq data was obtained from (Hoshino et al., 2017).
Fig. 10
Fig. 10
Interaction of transcription factors with epigenetic modifiers in the mammalian retina. Binding of transcription factors to distinct epigenetic modifiers helps in establishing cell-type specific epigenetic signatures and transcriptional profiles. A few examples are given here. PAX6, which is expressed in RPCs and interneurons, can interact with both histone acetyltransferase KAT5 (Kim et al., 2012a) and deacetylase HDAC1 (Kim et al., 2017), respectively regulating activation and repression of its target genes. Similarly, NRL can be phosphorylated by JNK1 and interacts with the histone acetyltransferase KAT5 to drive the expression of its target genes in rod photoreceptors (Kim et al., 2012b). CRX can interact with various histone-modifying complexes (ATXN7 and P300/CBP) that contain histone deacetylases to activate its target genes (Palhan et al., 2005; Peng and Chen, 2007). NR2E3 is shown to interact with SMAD7 to repress gene expression in rod photoreceptors through the PRC1 complex (Omori et al., 2017). REST interacts with TET3 to increase 5hmC in the gene bodies of neuronal-specific genes, and TET3, in turn, recruits the histone methyltransferase NSD3, which methylates H3K36 in those regions (Perera et al., 2015).
Fig. 11
Fig. 11
Aging-associated epigenetic alterations. An aging cell undergoes changes in its epigenetic landscape with varying alterations in histone modifications, global loss of core histones, histone variant exchange (e.g., incorporation of H3.3 or macroH2A), global reduction with local increase in DNA methylation levels, and redistribution and loss of heterochromatin (Benayoun et al., 2015; Pal and Tyler, 2016).

Similar articles

Cited by

References

    1. Aapola U, Liiv I, Peterson P. Imprinting regulator DNMT3L is a transcriptional repressor associated with histone deacetylase activity. Nucleic Acids Research. 2002;30:3602–3608. - PMC - PubMed
    1. Agathocleous M, Harris WA. From progenitors to differentiated cells in the vertebrate retina. Annu Rev Cell Dev Biol. 2009;25:45–69. - PubMed
    1. Akiyama T, Wakabayashi S, Soma A, Sato S, Nakatake Y, Oda M, Murakami M, Sakota M, Chikazawa-Nohtomi N, Ko SB, Ko MS. Transient ectopic expression of the histone demethylase JMJD3 accelerates the differentiation of human pluripotent stem cells. Development. 2016;143:3674–3685. - PMC - PubMed
    1. Albini S, Coutinho P, Malecova B, Giordani L, Savchenko A, Forcales SV, Puri PL. Epigenetic reprogramming of human embryonic stem cells into skeletal muscle cells and generation of contractile myospheres. Cell Rep. 2013;3:661–670. - PMC - PubMed
    1. Aldiri I, Ajioka I, Xu B, Zhang J, Chen X, Benavente C, Finkelstein D, Johnson D, Akiyama J, Pennacchio LA, Dyer MA. Brg1 coordinates multiple processes during retinogenesis and is a tumor suppressor in retinoblastoma. Development (Cambridge, England) 2015;142:4092–4106. - PMC - PubMed

Publication types