

Mice Expressing Myc in Neural Precursors Develop Choroid Plexus and Ciliary Body Tumors
- PMID: 29545198
- PMCID: PMC5971223
- DOI: 10.1016/j.ajpath.2018.02.009
Mice Expressing Myc in Neural Precursors Develop Choroid Plexus and Ciliary Body Tumors
Abstract
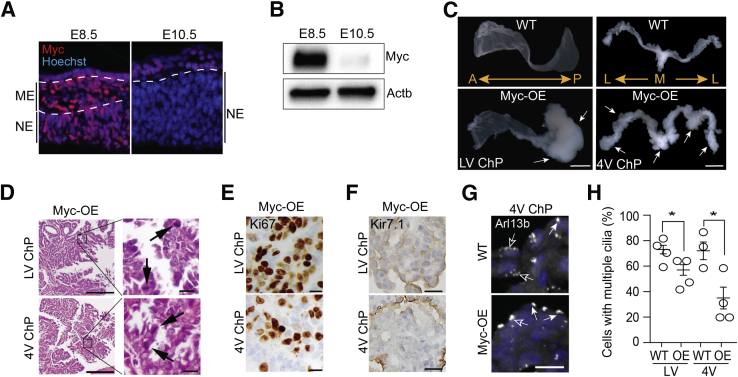
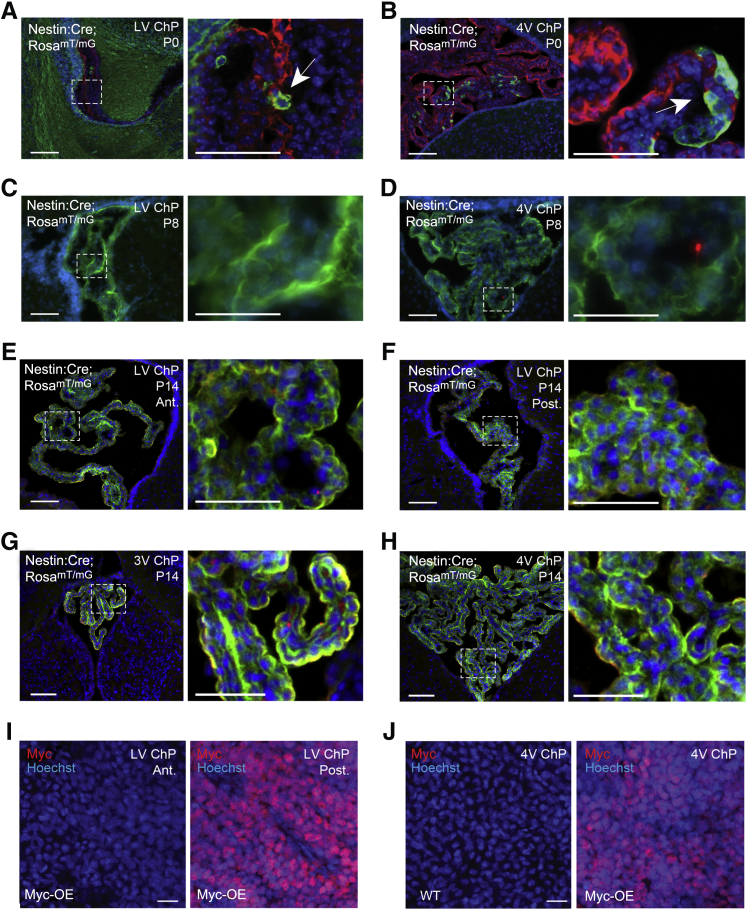
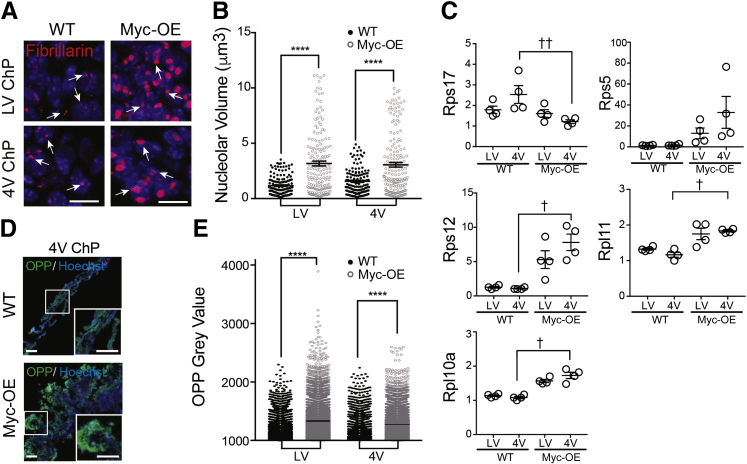
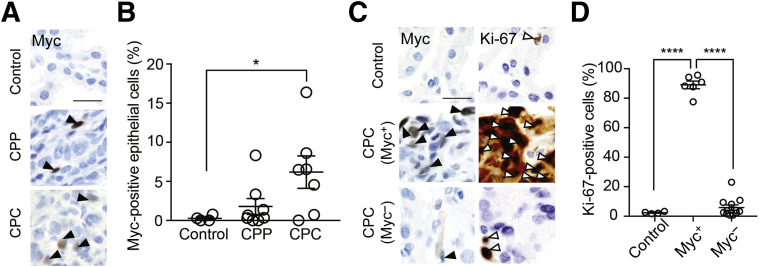
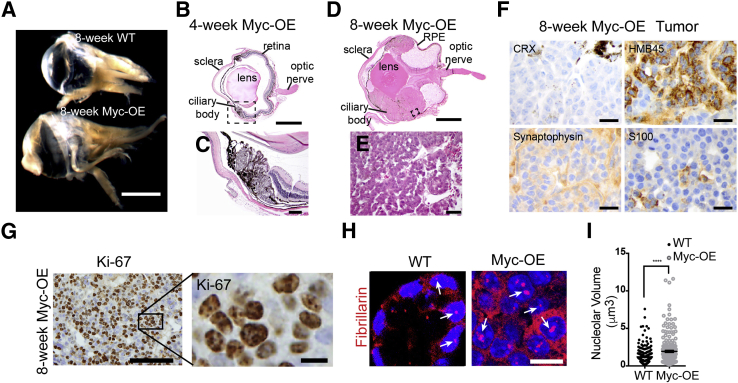
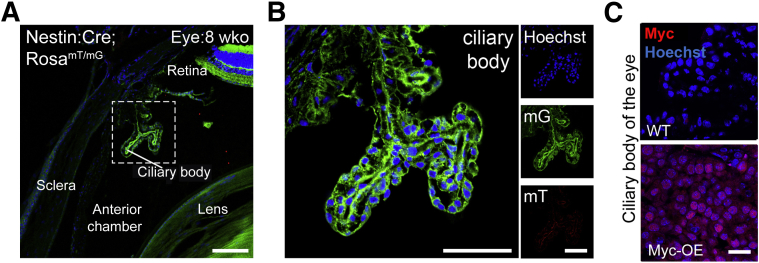
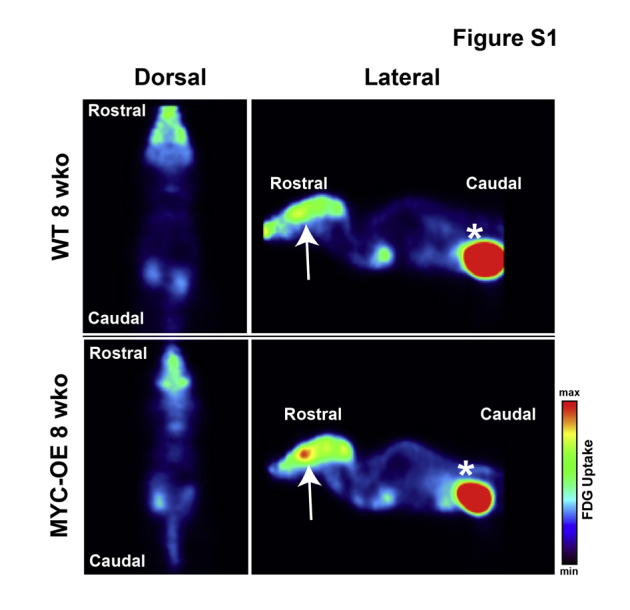
Choroid plexus tumors and ciliary body medulloepithelioma are predominantly pediatric neoplasms. Progress in understanding the pathogenesis of these tumors has been hindered by their rarity and lack of models that faithfully recapitulate the disease. Here, we find that endogenous Myc proto-oncogene protein is down-regulated in the forebrain neuroepithelium, whose neural plate border domains give rise to the anterior choroid plexus and ciliary body. To uncover the consequences of persistent Myc expression, MYC expression was forced in multipotent neural precursors (nestin-Cre:Myc), which produced fully penetrant models of choroid plexus carcinoma and ciliary body medulloepithelioma. Nestin-mediated MYC expression in the epithelial cells of choroid plexus leads to the regionalized formation of choroid plexus carcinoma in the posterior domain of the lateral ventricle choroid plexus and the fourth ventricle choroid plexus that is accompanied by loss of multiple cilia, up-regulation of protein biosynthetic machinery, and hydrocephalus. Parallel MYC expression in the ciliary body leads also to up-regulation of protein biosynthetic machinery. Additionally, Myc expression in human choroid plexus tumors increases with aggressiveness of disease. Collectively, our findings expose a select vulnerability of the neuroepithelial lineage to postnatal tumorigenesis and provide a new mouse model for investigating the pathogenesis of these rare pediatric neoplasms.
Copyright © 2018 American Society for Investigative Pathology. Published by Elsevier Inc. All rights reserved.
Figures
Similar articles
-
c-MYC overexpression induces choroid plexus papillomas through a T-cell mediated inflammatory mechanism.Acta Neuropathol Commun. 2019 May 29;7(1):95. doi: 10.1186/s40478-019-0739-x. Acta Neuropathol Commun. 2019. PMID: 31142360 Free PMC article.
-
A new genetically engineered mouse model of choroid plexus carcinoma.Biochem Biophys Res Commun. 2018 Feb 5;496(2):568-574. doi: 10.1016/j.bbrc.2017.11.192. Epub 2018 Jan 12. Biochem Biophys Res Commun. 2018. PMID: 29339161 Free PMC article.
-
Myc and Loss of p53 Cooperate to Drive Formation of Choroid Plexus Carcinoma.Cancer Res. 2019 May 1;79(9):2208-2219. doi: 10.1158/0008-5472.CAN-18-2565. Epub 2019 Mar 18. Cancer Res. 2019. PMID: 30885981 Free PMC article.
-
Tumors of the choroid plexus.Microsc Res Tech. 2001 Jan 1;52(1):104-11. doi: 10.1002/1097-0029(20010101)52:1<104::AID-JEMT12>3.0.CO;2-3. Microsc Res Tech. 2001. PMID: 11135453 Review.
-
Spinal drop metastasis from a benign fourth ventricular choroid plexus papilloma in a pediatric patient: case report.J Neurosurg Pediatr. 2017 Nov;20(5):471-479. doi: 10.3171/2017.5.PEDS17130. Epub 2017 Aug 25. J Neurosurg Pediatr. 2017. PMID: 28841111 Review.
Cited by
-
The choroid plexus: a missing link in our understanding of brain development and function.Physiol Rev. 2023 Jan 1;103(1):919-956. doi: 10.1152/physrev.00060.2021. Epub 2022 Sep 29. Physiol Rev. 2023. PMID: 36173801 Free PMC article. Review.
-
c-MYC overexpression induces choroid plexus papillomas through a T-cell mediated inflammatory mechanism.Acta Neuropathol Commun. 2019 May 29;7(1):95. doi: 10.1186/s40478-019-0739-x. Acta Neuropathol Commun. 2019. PMID: 31142360 Free PMC article.
-
"Dangling choroid" with contralateral glomus displacement and ischemic torsion in congenital hydrocephalus: illustrative case.J Neurosurg Case Lessons. 2024 Dec 2;8(23):CASE24505. doi: 10.3171/CASE24505. Print 2024 Dec 2. J Neurosurg Case Lessons. 2024. PMID: 39622046 Free PMC article.
-
A concerted metabolic shift in early forebrain alters the CSF proteome and depends on MYC downregulation for mitochondrial maturation.Development. 2019 Oct 24;146(20):dev182857. doi: 10.1242/dev.182857. Development. 2019. PMID: 31575649 Free PMC article.
-
Activation of Wnt/β-catenin signaling is critical for the tumorigenesis of choroid plexus.Neuro Oncol. 2025 Jan 12;27(1):106-122. doi: 10.1093/neuonc/noae176. Neuro Oncol. 2025. PMID: 39215664 Free PMC article.
References
-
- Kaliki S., Shields C.L., Eagle R.C., Jr., Vemuganti G.K., Almeida A., Manjandavida F.P., Mulay K., Honavar S.G., Shields J.A. Ciliary body medulloepithelioma: analysis of 41 cases. Ophthalmology. 2013;120:2552–2559. - PubMed
-
- Li L., Grausam K.B., Wang J., Lun M.P., Ohli J., Lidov H.G., Calicchio M.L., Zeng E., Salisbury J.L., Wechsler-Reya R.J., Lehtinen M.K., Schüller U., Zhao H. Sonic hedgehog promotes proliferation of Notch-dependent monociliated choroid plexus tumour cells. Nat Cell Biol. 2016;18:418–430. - PMC - PubMed
-
- Valdez J.M., Nichols K.E., Kesserwan C. Li-Fraumeni syndrome: a paradigm for the understanding of hereditary cancer predisposition. Br J Haematol. 2017;176:539–552. - PubMed
Publication types
MeSH terms
Substances
Grants and funding
LinkOut - more resources
Full Text Sources
Other Literature Sources
Molecular Biology Databases
