. 2018 May 4;293(18):7040-7057.
doi: 10.1074/jbc.RA117.000363. Epub 2018 Mar 15.

Structural implications of hERG K+ channel block by a high-affinity minimally structured blocker

Affiliations

Structural implications of hERG K+ channel block by a high-affinity minimally structured blocker

Matthew V Helliwell et al. J Biol Chem. .

Abstract

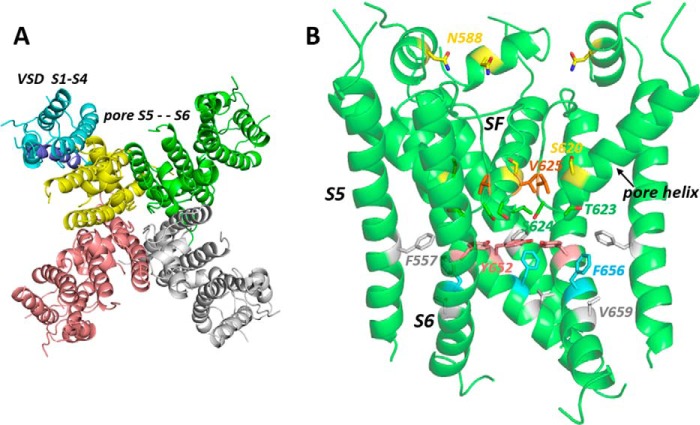
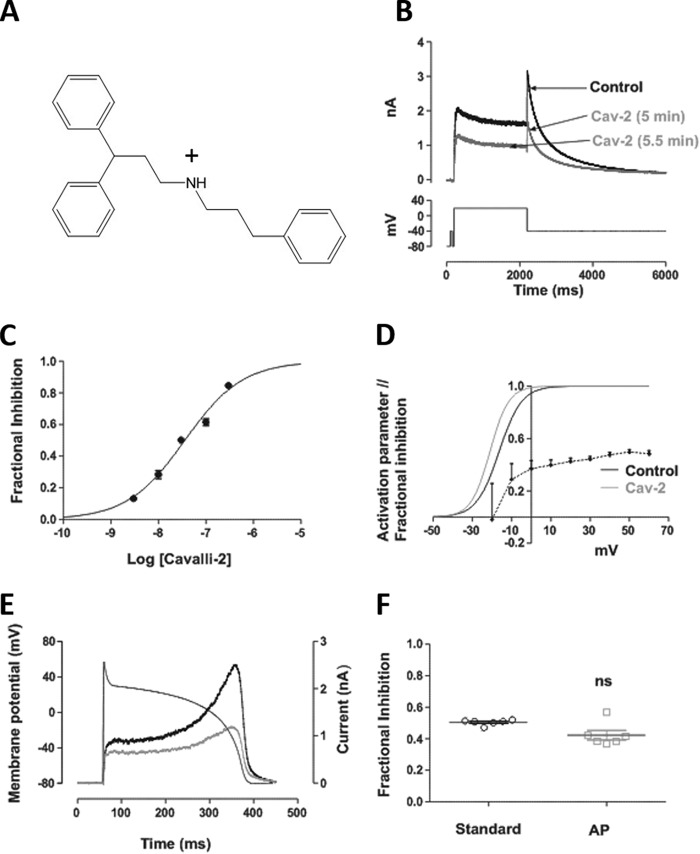
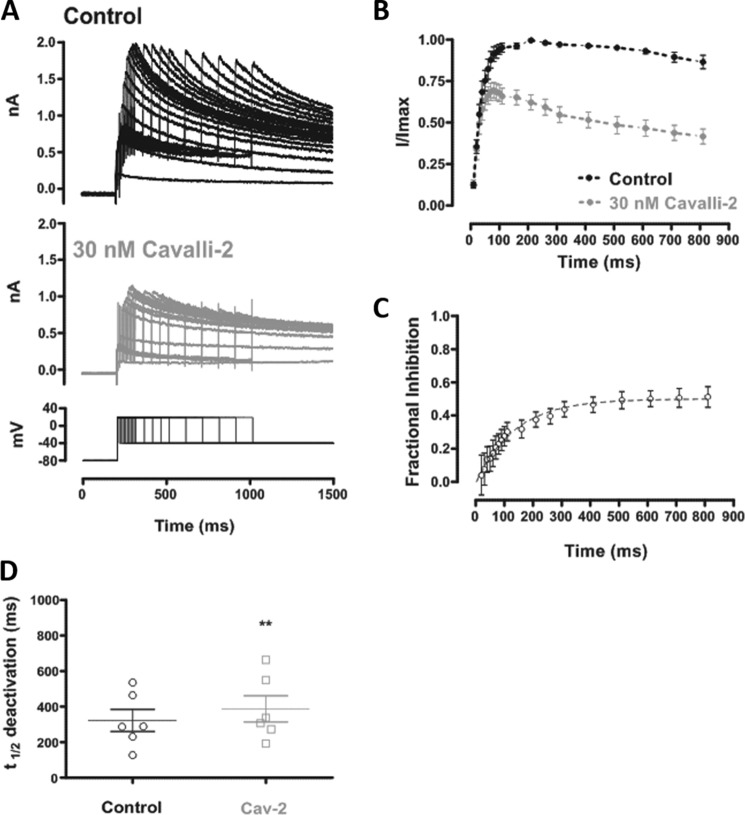
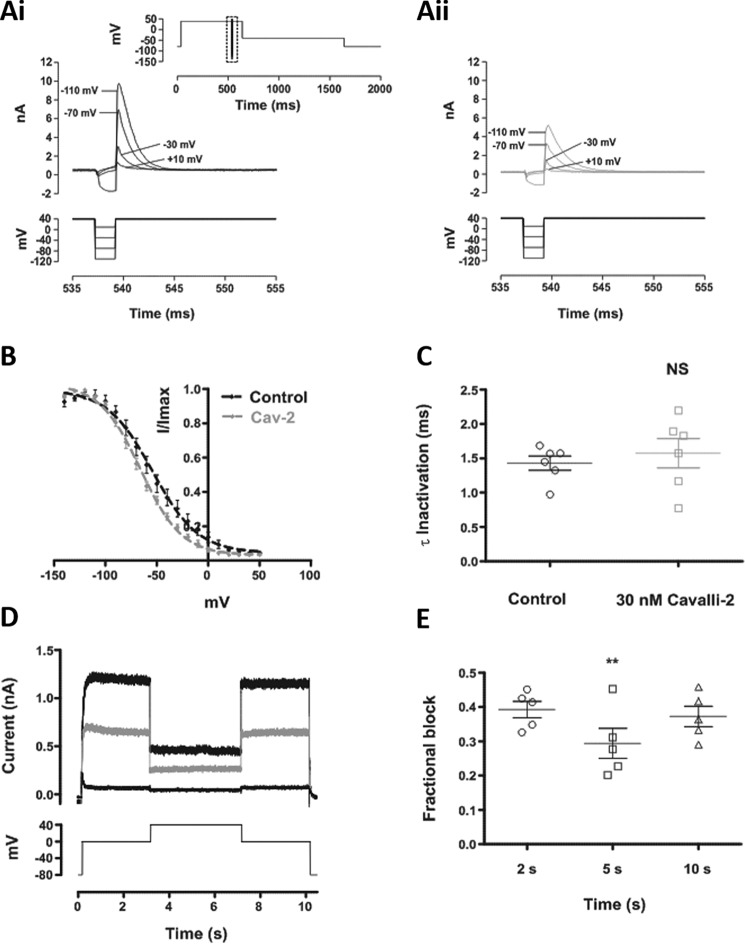
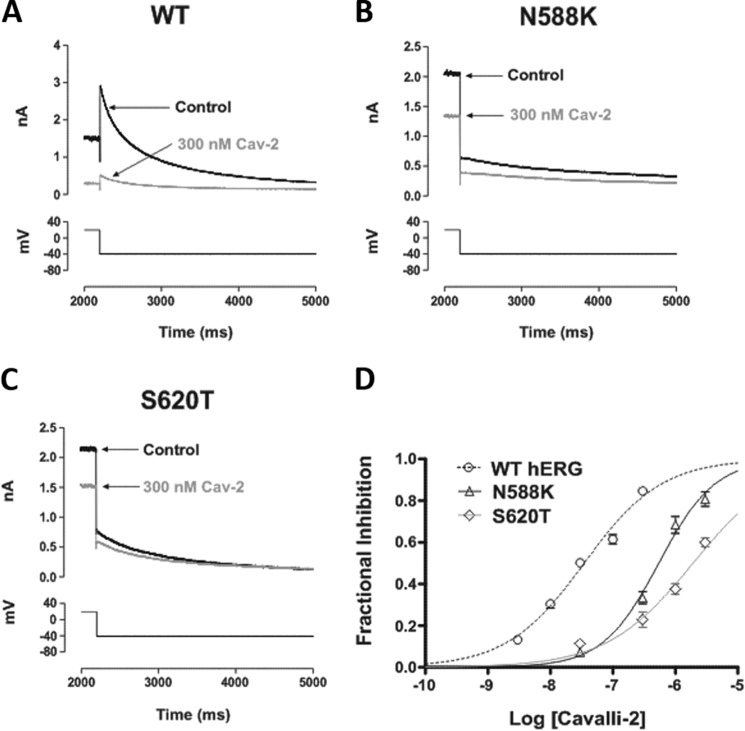
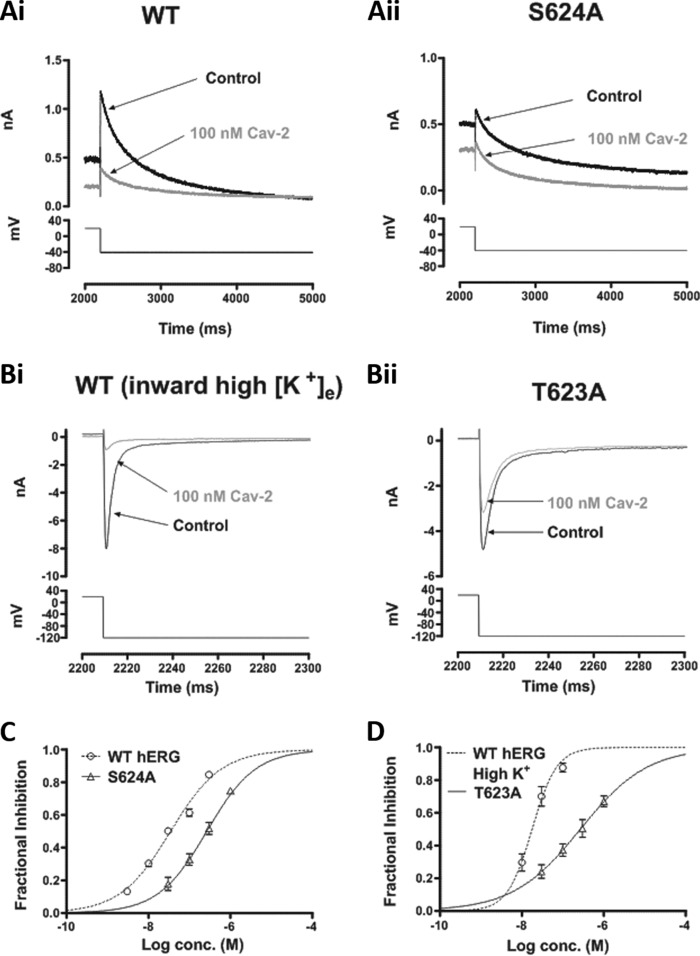
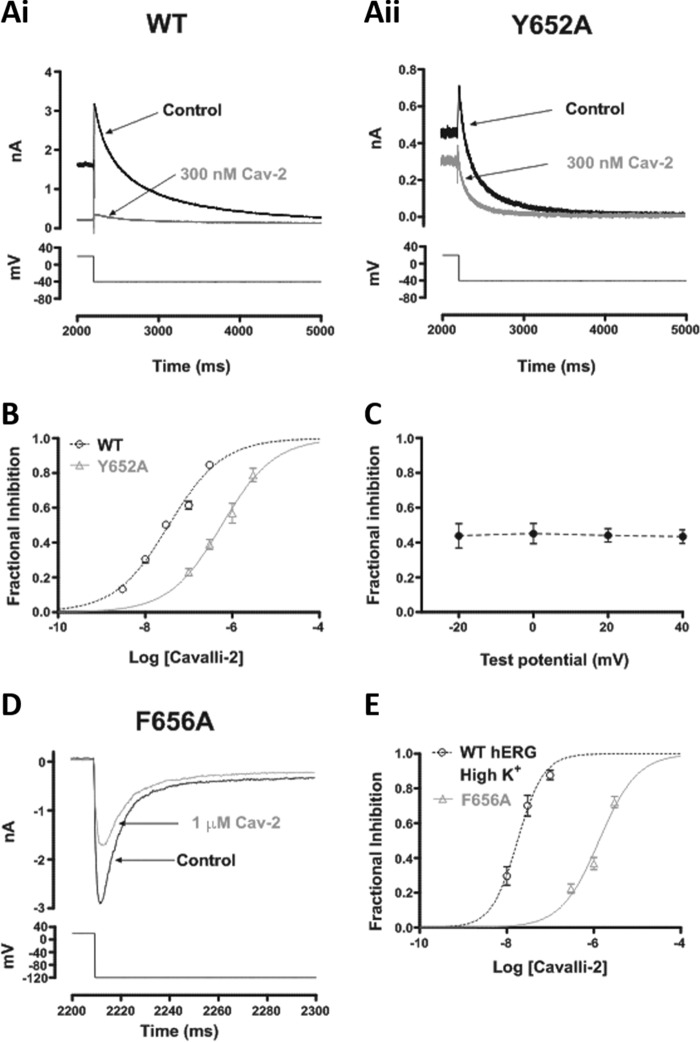
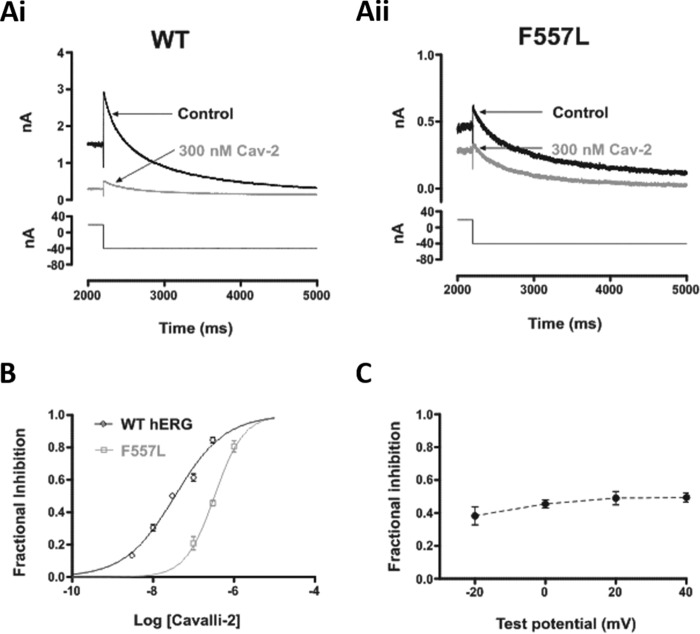
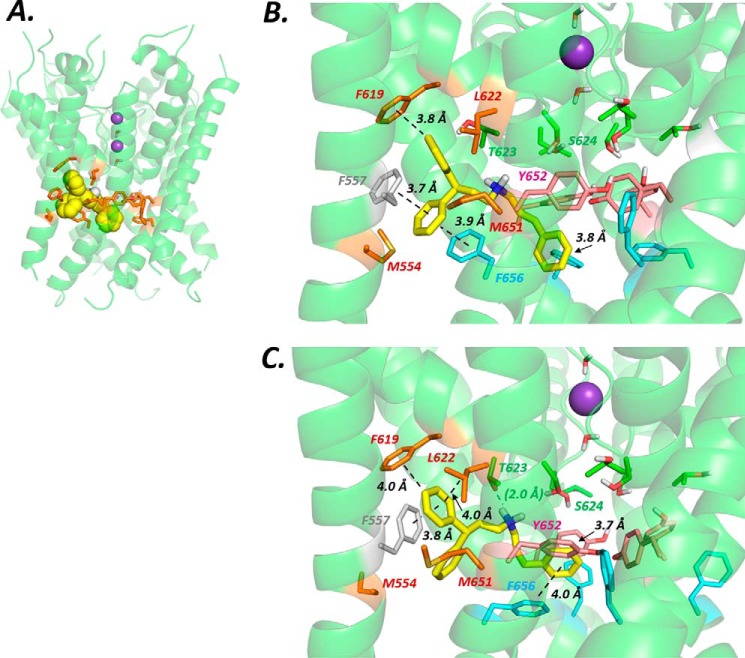
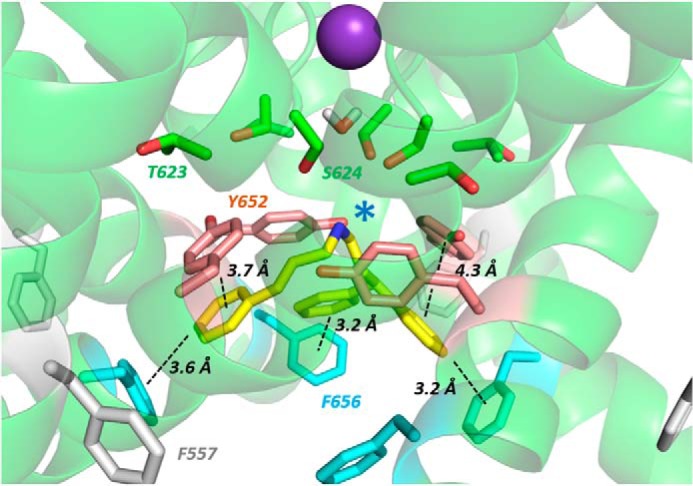
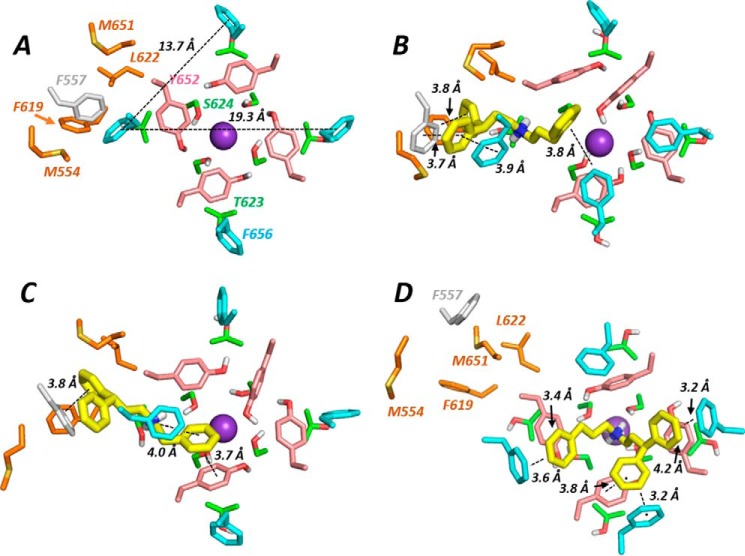
Cardiac potassium channels encoded by human ether-à-go-go-related gene (hERG) are major targets for structurally diverse drugs associated with acquired long QT syndrome. This study characterized hERG channel inhibition by a minimally structured high-affinity hERG inhibitor, Cavalli-2, composed of three phenyl groups linked by polymethylene spacers around a central amino group, chosen to probe the spatial arrangement of side chain groups in the high-affinity drug-binding site of the hERG pore. hERG current (IhERG) recorded at physiological temperature from HEK293 cells was inhibited with an IC50 of 35.6 nm with time and voltage dependence characteristic of blockade contingent upon channel gating. Potency of Cavalli-2 action was markedly reduced for attenuated inactivation mutants located near (S620T; 54-fold) and remote from (N588K; 15-fold) the channel pore. The S6 Y652A and F656A mutations decreased inhibitory potency 17- and 75-fold, respectively, whereas T623A and S624A at the base of the selectivity filter also decreased potency (16- and 7-fold, respectively). The S5 helix F557L mutation decreased potency 10-fold, and both F557L and Y652A mutations eliminated voltage dependence of inhibition. Computational docking using the recent cryo-EM structure of an open channel hERG construct could only partially recapitulate experimental data, and the high dependence of Cavalli-2 block on Phe-656 is not readily explainable in that structure. A small clockwise rotation of the inner (S6) helix of the hERG pore from its configuration in the cryo-EM structure may be required to optimize Phe-656 side chain orientations compatible with high-affinity block.

Keywords: alanine scan mutagenesis; drug action; hERG; heart; long QT syndrome; molecular docking; molecular pharmacology; mutagenesis; potassium channel.


Conflict of interest statement

The authors declare that they have no conflicts of interest with the contents of this article

Figures

Figure 1.
Figure 1.
Open pore cryo-EM structure of a hERG construct from Wang and MacKinnon (8). A is a top-down view illustrating the subunit arrangement of the hERG construct membrane domain tetramer. The voltage sensor domain (VSD) (transmembrane helices S1–S4) of one subunit is colored blue. B, side view of the pore domain comprising the S5 helix, pore helix, selectivity filter (SF), and S6 helix; the extracellular turret linking the top of S5 and the N-terminal end of the pore helix has some missing atom density. Amino acid residues mutated in this study or otherwise described in the text are highlighted.
Figure 2.
Figure 2.
Effect of Cavalli-2 on WT IhERG. A, structure of the “minimally structured” compound Cavalli-2. B, upper panel, shows representative traces recorded in 4 mm normal [K+]e elicited by depolarizing voltage command (lower panel) in the absence (black) and presence (gray) of 30 nm Cavalli-2 (Cav-2) after 5 and 5.5 min to demonstrate steady-state block. C, concentration-response relationships for inhibition of IhERG tails at −40 mV by Cavalli-2 (n ≥ 5 for each point). D, voltage dependence of Cavalli-2 block (black dotted line) and voltage-dependent activation relationships for IhERG in control (black continuous line) and in the presence of 30 nm Cavalli-2 (gray line) (n = 6). V0.5 = −16.0 ± 3.6 mV and k = 5.37 ± 0.75 and V0.5 = −21.2 ± 2.9 mV and k = 5.03 ± 1.50 in control and in the presence of 30 nm Cavalli-2, respectively. E, representative IhERG records in control (black) and in the presence of 30 nm Cavalli-2 (red line) elicited by the superimposed action potential waveform. F, scatter plot comparing fractional block of IhERG by 30 nm Cavalli-2 using the standard protocol and action potential waveform. n = 6; p < 0.05, unpaired t test. Error bars represent means ± S.E. ns, not significant.
Figure 3.
Figure 3.
The time dependence of IhERG inhibition by Cavalli-2. A, representative traces of IhERG in control (upper panel) and in the presence of 30 nm Cavalli-2 (lower panel) elicited by the “envelope-of-tails” protocol shown at the bottom of the lower panel. B, time dependence of normalized tail IhERG in control (black) and in the presence of 30 nm Cavalli-2 (gray) (n = 6). Data at each time point were normalized to the maximum tail current elicited by the protocol in control. Lines connect successive points in each plot. C, time dependence of fractional block of IhERG by 30 nm Cavalli-2 fitted with a monoexponential function (n = 6; time constant = 140.9 ± 33.4 ms). D, scatter plot comparing t½ of IhERG deactivation in control and after application of 30 nm Cavalli-2 (Cav-2) using the protocol shown in Fig. 2B. n = 6; unpaired t test. Error bars represent means ± S.E.
Figure 4.
Figure 4.
Effect of Cavalli-2 on hERG channel availability. A, upper traces show WT IhERG elicited by the “availability protocol” (from a holding potential of −80 mV, the membrane was depolarized to +40 mV (500 ms) and then briefly (2 ms) repolarized to a test potential ranging from −140 to +50 mV before returning to +40 mV). The full protocol is shown in the inset; the traces focus on the boxed area from the full protocol in control (A, panel i) and in the presence of 30 nm Cavalli-2 (A, panel ii). B, voltage dependence of the normalized resurgent current elicited by the third step of the availability protocol in control (black) and in the presence of 30 nm Cavalli-2 (Cav-2) (gray) (n = 6). V0.5 = −56.0 ± 1.9 mV and k = 21.3 ± 1.9 and V0.5 = −62.4 ± 1.4 mV and k = 20.1 ± 1.3 in control and in the presence of 30 nm Cavalli-2, respectively. C, scatter plots comparing time constants of IhERG inactivation calculated by fitting the peak transient current at +40 mV after a 2-ms step to −120 mV with a monoexponential decay function (n = 6; NS, not significant, p > 0.05, Wilcoxon matched-pairs signed-rank test). D, current records in control (thick black line) and after application of 30 nm Cavalli-2 (gray line) elicited by the voltage protocol shown (lower trace) applied from a holding potential of −80 mV. The thin black line shows current remaining after application of 5 μm E-4031. E, scatter plot comparing level of IhERG block at 2 (0 mV), 5 (+40 mV), and 10 s (0 mV). n = 5; **, p < 0.005, one-way ANOVA. Scatter plots in C and E show individual data points. All error bars represent means ± S.E.
Figure 5.
Figure 5.
Cavalli-2 blockade of IhERG carried by inactivation-attenuated mutants. Representative current traces from inactivation-attenuated mutants (B, N588K; C, S620T, which is more profoundly inactivation-deficient than N588K) in the absence and presence of 300 nm Cavalli-2 (Cav-2) using the voltage protocol described in Fig. 1 are shown. WT IhERG traces in control and after application of 300 nm Cavalli-2 are shown in A as a comparator. D, concentration-response relationships for inhibition of N588K and S620T IhERG tails at −40 mV by Cavalli-2. n ≥ 5 for each concentration of each curve. Error bars represent means ± S.E.
Figure 6.
Figure 6.
Effect of pore helix mutations on IhERG blockade by Cavalli-2. Representative current traces from two pore helix mutants (A, panel ii, S624A; B, panel ii, T623A) before and after application of 100 nm Cavalli-2 (Cav-2) with their respective WT control current traces (A, panel i, and B, panel i) under appropriate recording conditions (see “Materials and methods”) are shown. C, concentration-response relationships for inhibition of S624A and WT IhERG tails at −40 mV by Cavalli-2 (n ≥ 5 for each concentration of each curve). D, concentration-response relationships for inhibition of T623A and WT IhERG tails by Cavalli-2 at −120 mV in high K+. n ≥ 5 for each concentration of each curve. Error bars represent means ± S.E.
Figure 7.
Figure 7.
Effect of S6 aromatic residue mutations on IhERG by Cavalli-2. Representative current traces from Y652A (B) before and after application of 300 nm Cavalli-2 (Cav-2) and its WT control (A) are shown. C, mean ± S.E. fractional block data for Y652A IhERG tails following voltage commands to −20, 0, +20, and +40 mV. Data are from six cells. D, concentration-response relationships for inhibition of Y652A and WT IhERG tails at −40 mV by Cavalli-2 (n ≥ 5 for each concentration of each curve). E, representative current traces from F656A at −120 mV in high K+ before and after application of 1 μm Cavalli-2. F, concentration-response relationships for inhibition of F656A and WT IhERG tails at −120 mV in high K+. n ≥ 5 for each concentration of each curve. Error bars represent means ± S.E.
Figure 8.
Figure 8.
Effect of S5 aromatic residue mutation on IhERG by Cavalli-2. Representative current traces from F557L (A, panel ii) before and after application of 300 nm Cavalli-2 (Cav-2) and its WT control (A, panel i) are shown. B, concentration-response relationships for inhibition of F557L and WT IhERG tails at −40 mV by Cavalli-2 (n ≥ 5 for each concentration of each curve). C, mean ± S.E. fractional block data for F557L IhERG tails following voltage commands to −20, 0, +20, and +40 mV. Data are from six cells. Error bars represent means ± S.E.
Figure 9.
Figure 9.
A, location of one of four equivalent hydrophobic pockets in the pore domain of the hERG cryo-EM structure with Cavalli-2 docked in the configuration shown in B. Amino acid side chains that comprise the pocket (brown) were allowed to rotate freely during docking runs to accommodate the drug. Potassium ions (purple spheres) in the 1 and 3 positions of the selectivity filter and waters (in positions 2 and 4) were added for docking runs. Cavalli-2 is represented as a space-filling yellow surface. B, low-energy-score pose for Cavalli-2 docked into the hERG pore with docking biased to promote occupation of a hydrophobic pocket. In this run, rotamers of two Phe-656 side chains adjacent to the pocket containing Cavalli-2 were selected to orient the side chain Cα–Cβ bond toward the pore and fixed during docking to allow Cavalli-2 to interact with more than one Phe-656 side chain. Annotations define noncovalent interactions between drug and amino acid side chains according to the criteria in Table 2 of Dempsey et al. (29); only interactions that satisfy these criteria are annotated. C, as in B but no side chain rotamers were fixed during docking. In all structure figures, the hERG pore amino acid side chains are colored as follows: Phe-557, gray; Met-554, Phe-619, Leu-622, and Met-651, brown; Thr-623 and Ser-624, green; Tyr-652, pink; and Phe-656, blue. Cavalli-2 is yellow.
Figure 10.
Figure 10.
Low-energy-score pose for Cavalli-2 docked into the MthK-based hERG pore model. Annotations are as described in Fig. 9 legend. The blue star indicates the location of the protonated aliphatic amino group of Cavalli-2 near the internal binding site for a K+ ion where the C-terminal negative helix dipole charges from the four pore helices are focused. Amino acid side chain colors are as described in Fig. 9 legend.
Figure 11.
Figure 11.
Lowest-energy-score docked poses viewed from the cytoplasmic side of the channel pore. A, the hERG construct cryo-EM structure (8) with distances between Phe-656 phenyl group centers marked. B, Cavalli-2 docked into hERG EM structure with selected Phe-656 side chains constrained to project toward the pore during docking; this is the same docking output as in Fig. 9B. C, as in B but with Phe-656 side chains unconstrained during docking as in Fig. 9C. D, unconstrained docking of Cavalli-2 into the hERG MthK-based model as in Fig. 10.

References

    1. Sanguinetti M. C., and Tristani-Firouzi M. (2006) hERG potassium channels and cardiac arrhythmia. Nature 440, 463–469 10.1038/nature04710 - DOI - PubMed
    1. Vandenberg J. I., Perry M. D., Perrin M. J., Mann S. A, Ke Y., and Hill A. P. (2012) hERG K+ channels: structure, function, and clinical significance. Physiol. Rev. 92, 1393–1478 10.1152/physrev.00036.2011 - DOI - PubMed
    1. Hancox J. C., McPate M. J., El Harchi A., and Zhang Y. H. (2008) The hERG potassium channel and hERG screening for drug-induced torsades de pointes. Pharmacol. Ther. 119, 118–132 10.1016/j.pharmthera.2008.05.009 - DOI - PubMed
    1. Sanguinetti M. C., and Mitcheson J. S. (2005) Predicting drug-hERG channel interactions that cause acquired long QT syndrome. Trends Pharmacol. Sci. 26, 119–124 10.1016/j.tips.2005.01.003 - DOI - PubMed
    1. Gintant G. A., Su Z., Martin R. L., and Cox B. F. (2006) Utility of hERG assays as surrogate markers of delayed cardiac repolarization and QT safety. Toxicol. Pathol. 34, 81–90 10.1080/01926230500431376 - DOI - PubMed

Publication types

MeSH terms

LinkOut - more resources