Multicenter Study
. 2018 Jun 21;131(25):2846-2855.
doi: 10.1182/blood-2018-01-822957. Epub 2018 Mar 15.

MAGIC biomarkers predict long-term outcomes for steroid-resistant acute GVHD

Affiliations
Multicenter Study

MAGIC biomarkers predict long-term outcomes for steroid-resistant acute GVHD

Hannah Major-Monfried et al. Blood. .

Abstract

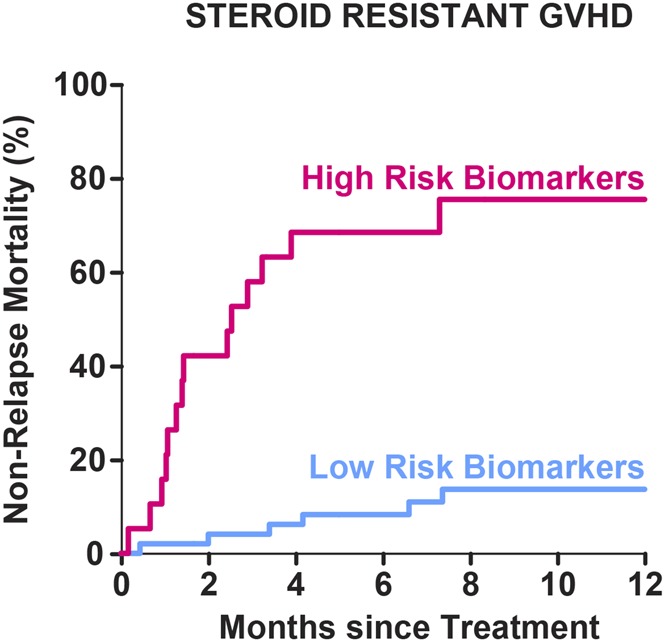
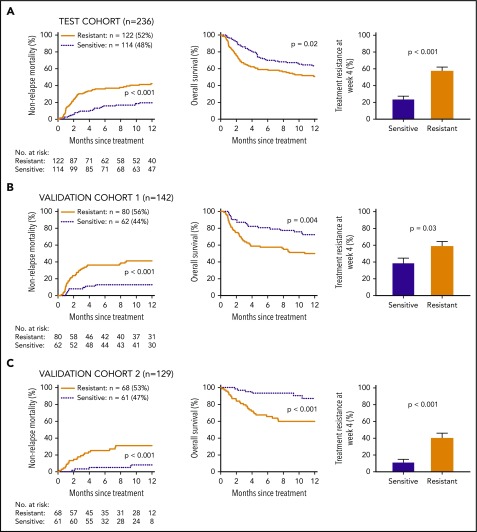
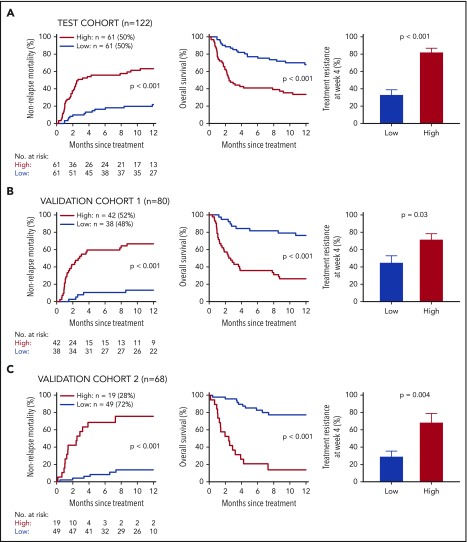
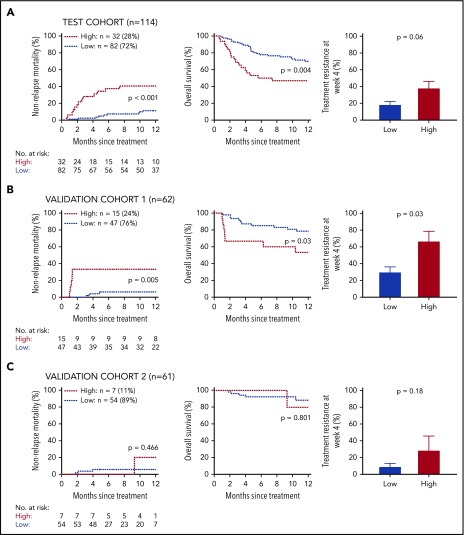
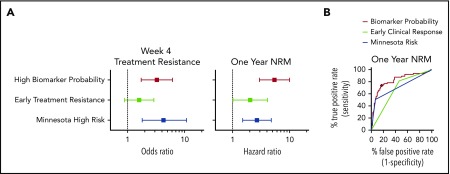
Acute graft-versus-host disease (GVHD) is treated with systemic corticosteroid immunosuppression. Clinical response after 1 week of therapy often guides further treatment decisions, but long-term outcomes vary widely among centers, and more accurate predictive tests are urgently needed. We analyzed clinical data and blood samples taken 1 week after systemic treatment of GVHD from 507 patients from 17 centers of the Mount Sinai Acute GVHD International Consortium (MAGIC), dividing them into a test cohort (n = 236) and 2 validation cohorts separated in time (n = 142 and n = 129). Initial response to systemic steroids correlated with response at 4 weeks, 1-year nonrelapse mortality (NRM), and overall survival (OS). A previously validated algorithm of 2 MAGIC biomarkers (ST2 and REG3α) consistently separated steroid-resistant patients into 2 groups with dramatically different NRM and OS (P < .001 for all 3 cohorts). High biomarker probability, resistance to steroids, and GVHD severity (Minnesota risk) were all significant predictors of NRM in multivariate analysis. A direct comparison of receiver operating characteristic curves showed that the area under the curve for biomarker probability (0.82) was significantly greater than that for steroid response (0.68, P = .004) and for Minnesota risk (0.72, P = .005). In conclusion, MAGIC biomarker probabilities generated after 1 week of systemic treatment of GVHD predict long-term outcomes in steroid-resistant GVHD better than clinical criteria and should prove useful in developing better treatment strategies.


Conflict of interest statement

Conflict-of-interest disclosure: J.E.L., J.L.M.F., and U.Ö. are joint inventors on a GVHD biomarker patent. The remaining authors declare no competing financial interests.

Figures

None
Graphical abstract
Figure 1.
Figure 1.
Long-term outcomes by clinical response to 1 week of treatment in all patients. Patients were divided into 2 groups based on response to treatment: early treatment sensitive (ETS; dotted line) and early treatment resistant (ETR; solid line). (A) Test cohort (n = 236). Twelve-month cumulative incidence of NRM (ETS 20% vs ETR 42%, P < .001) and OS (ETS 63% vs ETR 51%, P = .02) and proportion of patients resistant to treatment at week 4 (ETS 24% vs ETR 57%, P < .001). (B) Validation cohort 1 (n = 142). Twelve-month cumulative incidence of NRM (ETS 13% vs ETR 41%, P < .001) and OS (ETS 72% vs ETR 50%, P = .004) and proportion of patients resistant to treatment at week 4 (ETS 39% vs ETR 59%, P = .03). (C) Validation cohort 2 (n = 129). Twelve-month cumulative incidence of NRM (ETS 8% vs ETR 31%, P = .001) and OS (ETS 87% vs ETR 60%, P < .001) and proportion of patients resistant to treatment at week 4 (ETS 11% vs ETR 41%, P < .001).
Figure 2.
Figure 2.
Long-term outcomes by biomarker probabilities in early treatment–resistant patients. Early treatmentresistant patients were subdivided based on biomarker probabilities into low and high groups. (A) Test cohort of patients (n = 122). Twelve-month cumulative incidence of NRM (low 22% vs high 63%, P < .001) and OS (low 68% vs high 34%, P < .001) and proportion of patients resistant to treatment at week 4 (low 33% vs high 82%, P < .001). (B) Validation cohort 1 (n = 80). Twelve-month cumulative incidence of NRM (low 13% vs high 67%, P < .001) and OS (low 76% vs high 26%, P < .001) and proportion of patients resistant to treatment at week 4 (low 45% vs high 71%, P = .03). (C) Validation cohort 2 (n = 68). Twelve-month cumulative incidence of NRM (low 14% vs high 75%, P < .001) and OS (low 78% vs high 14%, P < .001) and proportion of patients resistant to treatment at week 4 (low 29% vs high 68%, P = .004).
Figure 3.
Figure 3.
Long-term outcomes by biomarker probabilities in early treatment sensitive patients. Early treatmentsensitive patients were subdivided based on biomarker probabilities into low and high groups. (A) Test cohort of patients (n = 114). Twelve-month cumulative incidence of NRM (low 11% vs high 41%, P < .001) and OS (low 70% vs high 47%, P = .004) and proportion of patients resistant to treatment at week 4 (low 18% vs high 38%, P = .06). (B) Validation cohort 1 (n = 62). Twelve-month cumulative incidence of NRM (low 6% vs high 33%, P = .005) and OS (low 79% vs high 53%, P = .03) and proportion of patients resistant to treatment at week 4 (low 30% vs high 67%, P = .03). (C) Validation cohort 2 (n = 61). Twelve-month cumulative incidence of NRM (low 6% vs high 20%, P = .46) and OS (low 88% vs high 80%, P = .80) and proportion of patients resistant to treatment at week 4 (low 8% vs high 28%, P = .18).
Figure 4.
Figure 4.
Prediction of long-term outcomes by early clinical response and biomarker probability status. (A) Forest plots. Left panel: Effect of early treatment resistance, Minnesota high-risk and high biomarker probability status on odds of resistance to treatment at week 4. Right panel: Effect of early treatment resistance, Minnesota high risk and high biomarker probability status on hazard of NRM at 1 year. Data are ratios and 95% confidence intervals. (B) Receiver operating characteristic curves to predict NRM. Curves are shown for early treatment response, biomarker probabilities, and Minnesota risk. The diamond (♦) indicates the threshold that defines low- versus high-risk groups. AUC for early treatment response = 0.68 (P = .004 compared with biomarker probability), for Minnesota risk = 0.72 (P = .005 compared with biomarker probability), and for biomarker probability = 0.82.

References

    1. Majhail NS, Chitphakdithai P, Logan B, et al. . Significant improvement in survival after unrelated donor hematopoietic cell transplantation in the recent era. Biol Blood Marrow Transplant. 2015;21(1):142-150. - PMC - PubMed
    1. Hahn T, Sucheston-Campbell LE, Preus L, et al. . Establishment of definitions and review process for consistent adjudication of cause-specific mortality after allogeneic unrelated-donor hematopoietic cell transplantation. Biol Blood Marrow Transplant. 2015;21(9):1679-1686. - PMC - PubMed
    1. Anasetti C, Logan BR, Lee SJ, et al. ; Blood and Marrow Transplant Clinical Trials Network. Peripheral-blood stem cells versus bone marrow from unrelated donors. N Engl J Med. 2012;367(16):1487-1496. - PMC - PubMed
    1. Deeg HJ. How I treat refractory acute GVHD. Blood. 2007;109(10):4119-4126. - PMC - PubMed
    1. MacMillan ML, DeFor TE, Weisdorf DJ. The best endpoint for acute GVHD treatment trials. Blood. 2010;115(26):5412-5417. - PubMed

Publication types

MeSH terms