. 2018 Jun 8;122(12):1675-1688.
doi: 10.1161/CIRCRESAHA.117.312513. Epub 2018 Mar 15.

Atlas of the Immune Cell Repertoire in Mouse Atherosclerosis Defined by Single-Cell RNA-Sequencing and Mass Cytometry

Affiliations

Atlas of the Immune Cell Repertoire in Mouse Atherosclerosis Defined by Single-Cell RNA-Sequencing and Mass Cytometry

Holger Winkels et al. Circ Res. .

Abstract

Rationale: Atherosclerosis is a chronic inflammatory disease that is driven by the interplay of pro- and anti-inflammatory leukocytes in the aorta. Yet, the phenotypic and transcriptional diversity of aortic leukocytes is poorly understood.

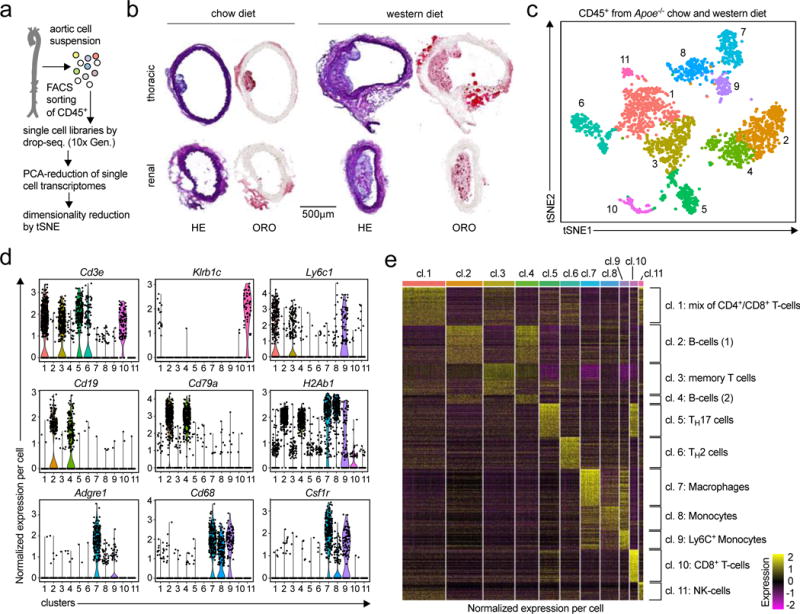
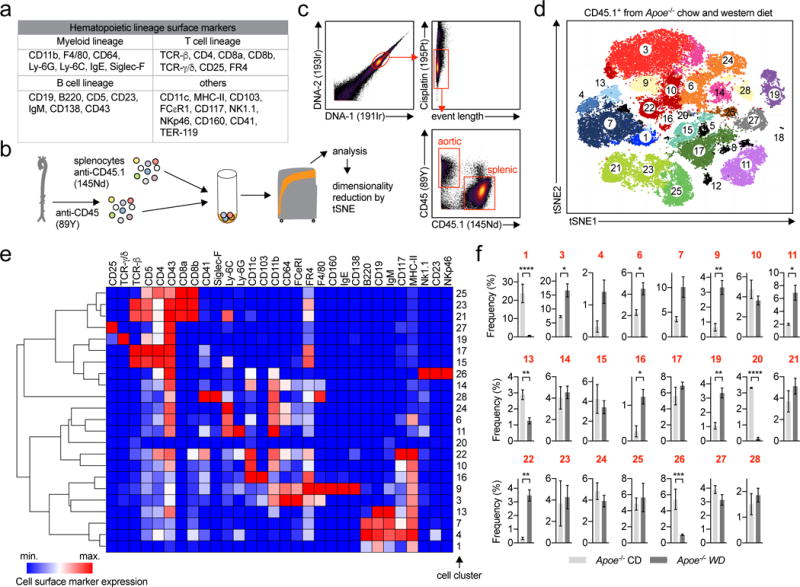
Objective: We characterized leukocytes from healthy and atherosclerotic mouse aortas in-depth by single-cell RNA-sequencing and mass cytometry (cytometry by time of flight) to define an atlas of the immune cell landscape in atherosclerosis.

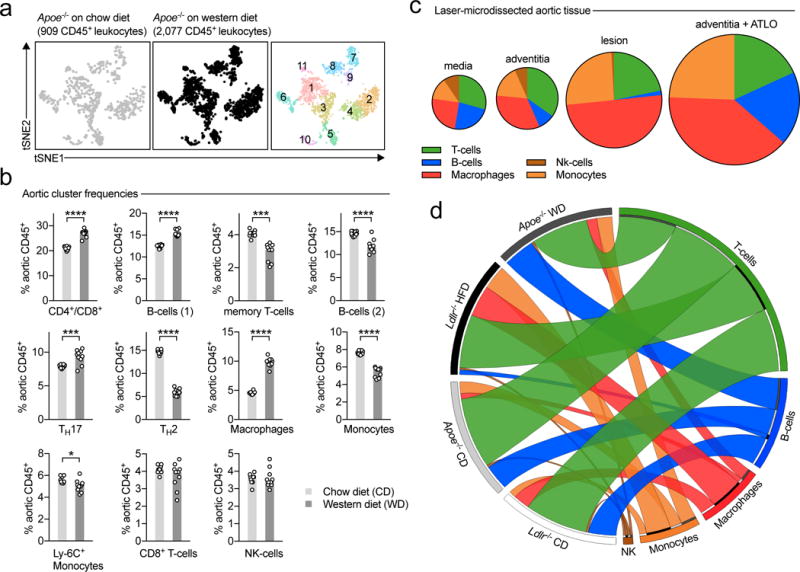
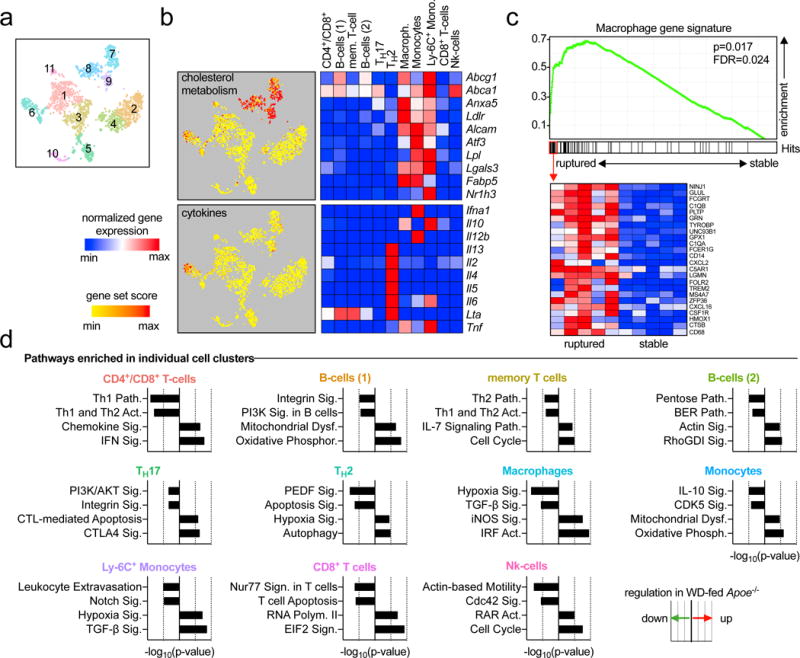
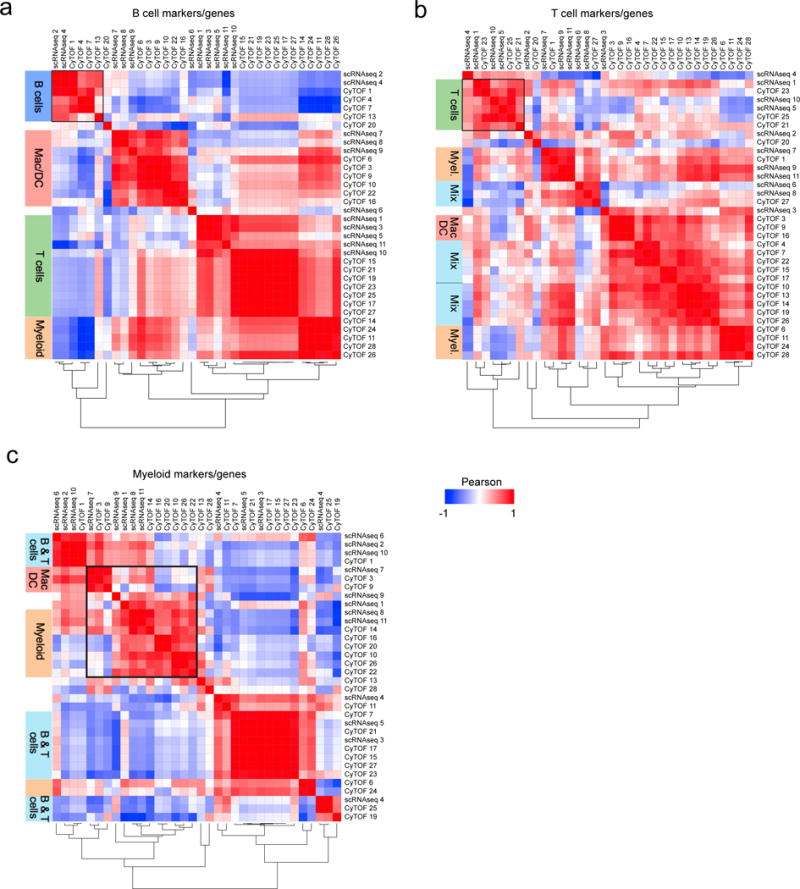
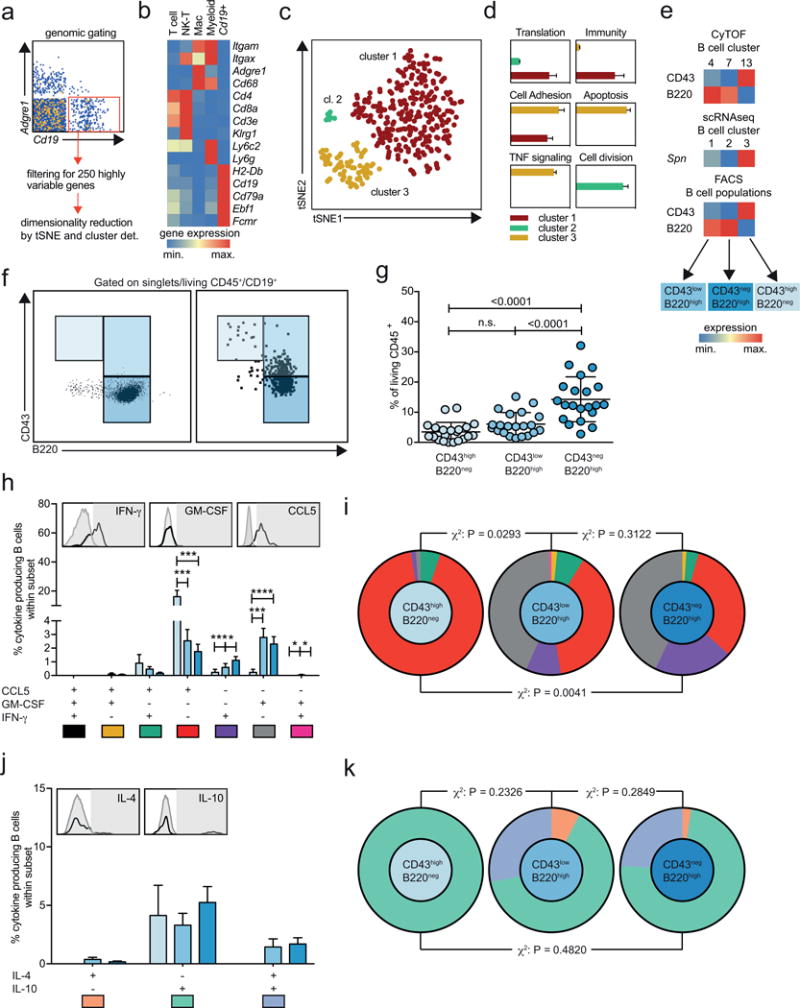
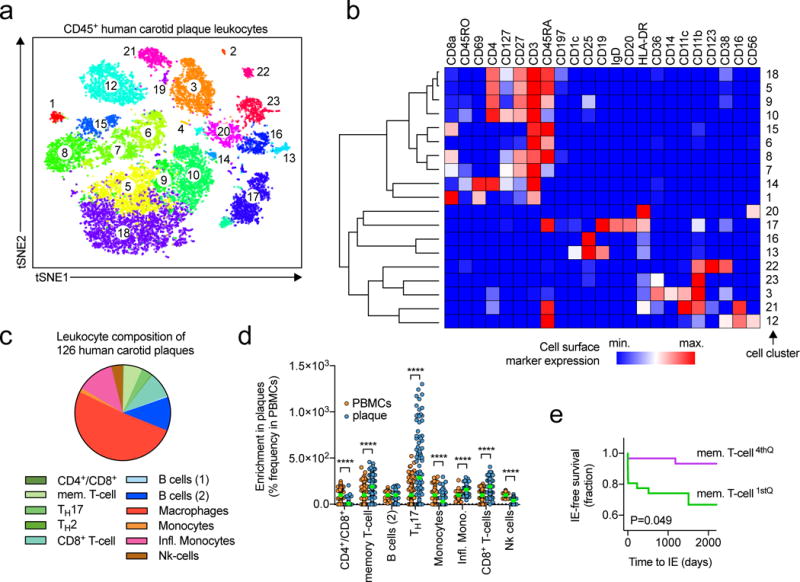
Methods and results: Using single-cell RNA-sequencing of aortic leukocytes from chow diet- and Western diet-fed Apoe-/- and Ldlr-/- mice, we detected 11 principal leukocyte clusters with distinct phenotypic and spatial characteristics while the cellular repertoire in healthy aortas was less diverse. Gene set enrichment analysis on the single-cell level established that multiple pathways, such as for lipid metabolism, proliferation, and cytokine secretion, were confined to particular leukocyte clusters. Leukocyte populations were differentially regulated in atherosclerotic Apoe-/- and Ldlr-/- mice. We confirmed the phenotypic diversity of these clusters with a novel mass cytometry 35-marker panel with metal-labeled antibodies and conventional flow cytometry. Cell populations retrieved by these protein-based approaches were highly correlated to transcriptionally defined clusters. In an integrated screening strategy of single-cell RNA-sequencing, mass cytometry, and fluorescence-activated cell sorting, we detected 3 principal B-cell subsets with alterations in surface markers, functional pathways, and in vitro cytokine secretion. Leukocyte cluster gene signatures revealed leukocyte frequencies in 126 human plaques by a genetic deconvolution strategy. This approach revealed that human carotid plaques and microdissected mouse plaques were mostly populated by macrophages, T-cells, and monocytes. In addition, the frequency of genetically defined leukocyte populations in carotid plaques predicted cardiovascular events in patients.

Conclusions: The definition of leukocyte diversity by high-dimensional analyses enables a fine-grained analysis of aortic leukocyte subsets, reveals new immunologic mechanisms and cell-type-specific pathways, and establishes a functional relevance for lesional leukocytes in human atherosclerosis.

Keywords: atherosclerosis; flow cytometry; immune system; leukocytes; lymphocytes; macrophages; mass cytometry; single-cell RNA-sequencing.


Conflict of interest statement

Disclosures

All authors have declared that no conflict of interest exists.

Figures

Figure 1
Figure 1. The single cell transcriptome identifies 11 distinct leukocyte populations in the atherosclerotic aorta
(a) The workflow for single cell RNA-sequencing (scRNAseq) included cell isolation of aortic leukocytes, flow sorting, and drop-sequencing. (b) 8-week old, female Apoe−/− mice consumed either a chow (CD) or a western diet (WD) for 12 weeks. Cross-sections of the thoracic and renal aorta were stained with hematoxylin and eosin (H&E) to display cellularity or Oil-Red-O (ORO) to assess lipid depositions. (c) Single cell transcriptomes of aortic leukocytes from CD and WD-fed mice were analyzed with an unsupervised dimensionality reduction algorithm (SEURAT) to identify groups of cells with similar gene expression. (d) Expression of principal hematopoietic lineage markers in the eleven identified cell clusters shown as normalized gene expression per cell. (e) Top 500 differentially expressed genes among all detected aortic leukocyte clusters. Normalized single cell gene expression is shown. Retrieved clusters were assigned to known leukocyte lineages by an integrated analysis of lineage markers and the comparison to published mouse PBMC gene signatures (Online-Fig.IV). 10 aortas from Apoe−/− mice per group were included in the pool of leukocytes (c-f). Representative sections are shown in (b).
Figure 2
Figure 2. Spatial and numeric differences in the aortic leukocyte repertoire in atherosclerosis
8-week old, female Apoe-deficient (Apoe−/−) mice consumed either a standard chow diet (CD) or a cholesterol-rich western diet (WD) for 12 weeks. Aortic leukocytes were isolated, subjected to scRNAseq, and distinct leukocyte clusters in CD and WD-fed mice were identified by dimensionality reduction of single cell transcriptomes. (a) tSNE plot for aortic leukocytes from CD (left) and WD (middle) consuming mice. Principal leukocyte clusters are displayed on the right graph. (b) Frequencies of the eleven clusters among all CD45+ leukocytes in both dietary interventions. (c) To characterize spatial differences of the identified leukocyte clusters, we applied a deconvolution algorithm on bulk mRNA arrays from micro-dissected tissue specimen that were obtained from female Apoe−/− mice on WD (GSE21419) and enumerated the relative frequency of the according leukocyte clusters (grouped in principal hematopoietic lineages) within the different locations. The relative proportion is shown in cake diagrams. The size of diagrams corresponds to the overall leukocyte content. (d) To compare the specific impact of the pro-atherogenic Apoe−/− background on leukocyte composition, we compared our results to scRNAseq on aortic leukocytes from healthy or atherosclerotic Ldlr−/− mice. Relative proportions of major hematopoietic lineages within the four combinations of dietary intervention and genotypes are displayed as Circos plot. Data are presented as mean±SEM. 10 aortas from Apoe−/− mice per group were included in the pool of leukocytes (b,d). Statistical significance was assessed by a two-sided, unpaired Student’s T-test on multiple iterations (b). *P<0.05, ***P<0.001, ****P<0.0001. DC: dendritic cells, ATLO: arterial tertiary lymphoid organs.
Figure 3
Figure 3. Enrichment of distinct genetic pathways in aortic leukocyte populations
Single cell transcriptomes of the eleven identified leukocyte clusters (a) were analyzed for the enrichment of specific genes and pathways. (b) The expression of genes contributing to cholesterol metabolism (GSEA M5892, upper graph) and cytokine secretion (GSEA M6910, lower graph) was retrieved and summarized as gene set score (specific enrichment normalized for background) per cell. Gene set scores were overlaid on single cells on a tSNE plot to identify leukocyte clusters with an enrichment of the indicated gene sets. The mean expression of some key genes in the specified gene sets is presented as heatmap with a row min.-max. score (left). (c) To establish a relationship between cluster gene expression and clinical disease, the enrichment of differentially expressed (DE) cluster genes compared to all other clusters was tested on bulk mRNA arrays of stable and ruptured human plaques (GSE41571) in a gene set enrichment analysis (GSEA). The specific genetic repertoire of the macrophage cluster is shown. (d) To identify the regulation of specific pathways between CD and WD for each individual cluster, DE genes were subjected to Ingenuity Pathway Analysis (IPA) with a significance threshold of P<0.05. The top 2 down- and upregulated pathways are displayed.
Figure 4
Figure 4. Mass cytometry (CyTOF) confirms the phenotypical heterogeneity of aortic leukocytes
(a) Markers of the 35-marker pan-leukocyte CyTOF antibody panel (full panel shown in Online-TableVI). (b) Aortic leukocytes were stained with an anti-CD45-89Y antibody and spiked with anti-CD45.1-145Nd stained splenocytes (1×10⁶) from age-matched CD45.1 Apoe−/− mice. (c) Gating strategy to select viable, aortic CD45.2+ leukocytes. (d) Unsupervised cell cluster detection by a modified tSNE and CyTOF cluster detection algorithm (PhenoGraph) on aortic leukocytes from Apoe−/− mice fed a WD or a CD. All cells in all mice are shown from a total of n=3 (CD) and n=7 (WD) mice. Macrophages are colored in red, myeloid/dendritic cells (CD11blow-high/CD11chigh) in orange, T-cells (TCR-βhigh/-γ/δhigh or CD4low-high/CD8high) in green/purple, B-cells (CD19high) in blue, granulocytes (Ly-6Ghigh/Siglec-Fhigh) in yellow/light purple, Nk-cells (Nk1.1high) in brown. (e) Hierarchical clustered (column and row) heatmap (column min.-max. score) of median marker expression across clusters. (f) Frequency of all 25 clusters in CD- and WD-fed mice above the frequency threshold of 1% (in both diets). Data are presented as mean±SEM. Significance was determined by a two-sided, unpaired Students T-test. *P<0.05, **P<0.01, ***P<0.001, ****P<0.0001. Representative CyTOF plots are shown in (c).
Figure 5
Figure 5. Leukocyte clusters identified in scRNAseq and CyTOF express highly correlated patterns of gene and protein lineage markers and group in hematopoietic lineages
To establish a correlation between cell clusters identified in scRNAseq (11 clusters) and CyTOF (23 clusters), patterns of protein markers and their corresponding coding genes were correlated. Protein/gene combinations were tested on three different marker panels: (a) The B-cell markers Itgam (CD11b), Cd19 (CD19), Spn (CD43), Ptprc (B220), Kit (CD117), H2-Ab1 (MHC-II), (b) the T-cell markers Cd5 (CD5), Cd4 (CD4), Cd8a (CD8a), Cd8b1 (CD8b), Il2ra (CD25), Spn (CD43), Izumo1r (FR4), and (c) the myeloid cell markers Itgam (CD11b), Itgax (CD11c), Ly6c1 (Ly-6C), Ly6g (Ly-6G), Fcer1g (CD64), and Adgre1 (F4/80). Correlations were calculated with a Pearson coefficient (-1 to +1) and displayed in a correlation matrix after hierarchical column and row clustering. Dendrograms shown underneath each correlations matrix correspond to rows and columns.
Figure 6
Figure 6. Transcriptional, phenotypic, and functional profiles identify three principal aortic B-cell sub-populations
(a) Cd19+Adgre1neg single cell transcriptomes from aortic leukocytes from 10-pooled Apoe−/− mice after 12 weeks of WD were filtered in SeqGeq and (b) further analyzed for gene expression coding for lineage-defining leukocyte markers. Expression values were normalized in row scores for leukocyte clusters (T-cells, Nk-cells, macrophages, Adgre1neg myeloid cells) and Cd19+Adgre1neg events. (c) tSNE map and K-means clustering after dimensionality reduction of the top 250 highly variable genes. (d) The three retrieved clusters were analyzed for differentially expressed genes and the significantly (P<0.05, FDR<0.05) upregulated genes served as input for pathway analysis. Pathways were grouped in functional classes and the enrichment score was plotted on the x-axis. (e) Gene and protein expression of the B cell surface markers CD43 (gene Spn) and B220 in the three principal B cell subsets independently identified in CyTOF (upper), scRNAseq (middle), and flow cytometry (FACS, lower heatmap). (f) Gating strategy to separate aortic B-cells (left) from Apoe−/− mice fed a WD for 12 weeks (n=21) based on CD43 and B220 expression. Fluorescence minus one (FMO) control is shown on the right. (g) Fraction of CD43highB220neg, CD43negB220high, and CD43lowB220high B cells among all aortic leukocytes. (h,j) Fraction of cells expressing different combinations of cytokines among the three B-cell sub-sets after stimulation with PMA/ionomycin for 5 hours. (i,k) The cytokine expression profiles of the three aortic B-cell populations was compared by a χ2 test. (g,h,j) Statistical significance was calculated by a one-way ANOVA. Data are presented as mean±SEM. *P<0.05, **P<0.01, ***P<0.001.
Figure 7
Figure 7. The frequency of aortic leukocyte populations predicts clinical events in patients with atherosclerosis
(a) Unsupervised cell cluster detection by a modified tSNE and CyTOF cluster detection algorithm (PhenoGraph) on CD45+, live, DNA+ leukocytes from human carotid plaques after endarterectomy and staining with an anti-human antibody panel and acquisition in CyTOF (full panel in Online-TableVIII). (b) Median expression of surface markers per clusters shown in a hierarchically clustered heatmap (row and column). A cluster frequency of >1% CD45+, live, DNA+ events was applied. The heatmap was normalized across clusters. (c) Genetic deconvolution of leukocyte cluster gene signatures in a set of bulk mRNA expression of 126 human carotid plaques from the BIKE-biobank to enumerate the relative abundance of cell clusters. The relative frequency of the tested clusters is shown. (d) Relative enrichment of leukocyte populations in plaques vs. PBMCs displayed as % of the frequency within PBMCs. (e) Kaplan-Maier survival curve of the ischemic event (IE) free survival after thrombendarterectomy. Myocardial infarction and stroke were classified as cardiovascular events. The frequency of memory T-cells was separated into quartiles and the lowest (1st) and highest (4th) were compared. Data are presented as mean±SEM. Significance was determined by a two-sided, unpaired Students T-test (d) or ANOVA (c). ****P<0.0001 or a Logrank and Gehan-Breslow-Wilcoxon test for survival curves (e). 126 individual human plaques were included in (c), N>97 per group (d). Number of IEs were 9 (1st) and 2 (4th) (e).

Comment in

References

    1. Libby P. Inflammation in atherosclerosis. Nature. 2002;420:868–874. - PubMed
    1. Wolf D, Zirlik A, Ley K. Beyond vascular inflammation–recent advances in understanding atherosclerosis. Cell Mol Life Sci. 2015;72:3853–3869. - PMC - PubMed
    1. Weber C, Zernecke A, Libby P. The multifaceted contributions of leukocyte subsets to atherosclerosis: Lessons from mouse models. Nat Rev Immunol. 2008;8:802–815. - PubMed
    1. Galkina E, Kadl A, Sanders J, Varughese D, Sarembock IJ, Ley K. Lymphocyte recruitment into the aortic wall before and during development of atherosclerosis is partially l-selectin dependent. J Exp Med. 2006;203:1273–1282. - PMC - PubMed
    1. Spitzer MH, Carmi Y, Reticker-Flynn NE, Kwek SS, Madhireddy D, Martins MM, Gherardini PF, Prestwood TR, Chabon J, Bendall SC, Fong L, Nolan GP, Engleman EG. Systemic immunity is required for effective cancer immunotherapy. Cell. 2017;168:487–502 e415. - PMC - PubMed

Publication types

MeSH terms