Prevalence and causes of vision loss in high-income countries and in Eastern and Central Europe in 2015: magnitude, temporal trends and projections
- PMID: 29545417
- PMCID: PMC5909755
- DOI: 10.1136/bjophthalmol-2017-311258
Prevalence and causes of vision loss in high-income countries and in Eastern and Central Europe in 2015: magnitude, temporal trends and projections
Abstract
Background: Within a surveillance of the prevalence and causes of vision impairment in high-income regions and Central/Eastern Europe, we update figures through 2015 and forecast expected values in 2020.
Methods: Based on a systematic review of medical literature, prevalence of blindness, moderate and severe vision impairment (MSVI), mild vision impairment and presbyopia was estimated for 1990, 2010, 2015, and 2020.
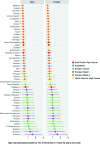
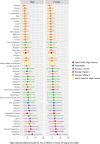
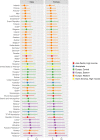
Results: Age-standardised prevalence of blindness and MSVI for all ages decreased from 1990 to 2015 from 0.26% (0.10-0.46) to 0.15% (0.06-0.26) and from 1.74% (0.76-2.94) to 1.27% (0.55-2.17), respectively. In 2015, the number of individuals affected by blindness, MSVI and mild vision impairment ranged from 70 000, 630 000 and 610 000, respectively, in Australasia to 980 000, 7.46 million and 7.25 million, respectively, in North America and 1.16 million, 9.61 million and 9.47 million, respectively, in Western Europe. In 2015, cataract was the most common cause for blindness, followed by age-related macular degeneration (AMD), glaucoma, uncorrected refractive error, diabetic retinopathy and cornea-related disorders, with declining burden from cataract and AMD over time. Uncorrected refractive error was the leading cause of MSVI.
Conclusions: While continuing to advance control of cataract and AMD as the leading causes of blindness remains a high priority, overcoming barriers to uptake of refractive error services would address approximately half of the MSVI burden. New data on burden of presbyopia identify this entity as an important public health problem in this population. Additional research on better treatments, better implementation with existing tools and ongoing surveillance of the problem is needed.
Keywords: epidemiology; glaucoma; public health.
© Article author(s) (or their employer(s) unless otherwise stated in the text of the article) 2018. All rights reserved. No commercial use is permitted unless otherwise expressly granted.
Conflict of interest statement
Competing interests: JBJ: consultant for Mundipharma (Cambridge, UK), patent holder with Biocompatibles UK (Farnham, Surrey, UK) (Title: Treatment of eye diseases using encapsulated cells encoding and secreting neuroprotective factor and/or anti-angiogenic factor; patent no 20120263794) and patent application with University of Heidelberg (Heidelberg, Germany) (Title: Agents for use in the therapeutic or prophylactic treatment of myopia or hyperopia; Europäische Patentanmeldung 15 000 771.4). AMB: consultant for Allergan, Bausch + Lomb, Carl Zeiss Meditec, Théa and VISUfarma. Research grants from Horus. JHK: consultant for Gilead and Santen. SR: consultant for Brien Holden Vision Institute.
Figures


References
-
- GBD 2015 DALYs and HALE Collaborators. Global, regional, and national disability‐adjusted life years (DALYs) for 315 diseases and injuries and healthy life expectancy (HALE) for 195 countries and territories, 1990‐2015: a systematic analysis for the Global Burden of Diseases, Injuries, and Risk Factors (GBD) 2015 Study. Lancet 2016;38:1603–58. - PMC - PubMed
Publication types
MeSH terms
LinkOut - more resources
Full Text Sources
Other Literature Sources
