. 2018 Jun;16(6):961-973.
doi: 10.1158/1541-7786.MCR-17-0607. Epub 2018 Mar 15.

Olaparib-induced Adaptive Response Is Disrupted by FOXM1 Targeting that Enhances Sensitivity to PARP Inhibition

Affiliations

Olaparib-induced Adaptive Response Is Disrupted by FOXM1 Targeting that Enhances Sensitivity to PARP Inhibition

Pingping Fang et al. Mol Cancer Res. 2018 Jun.

Abstract

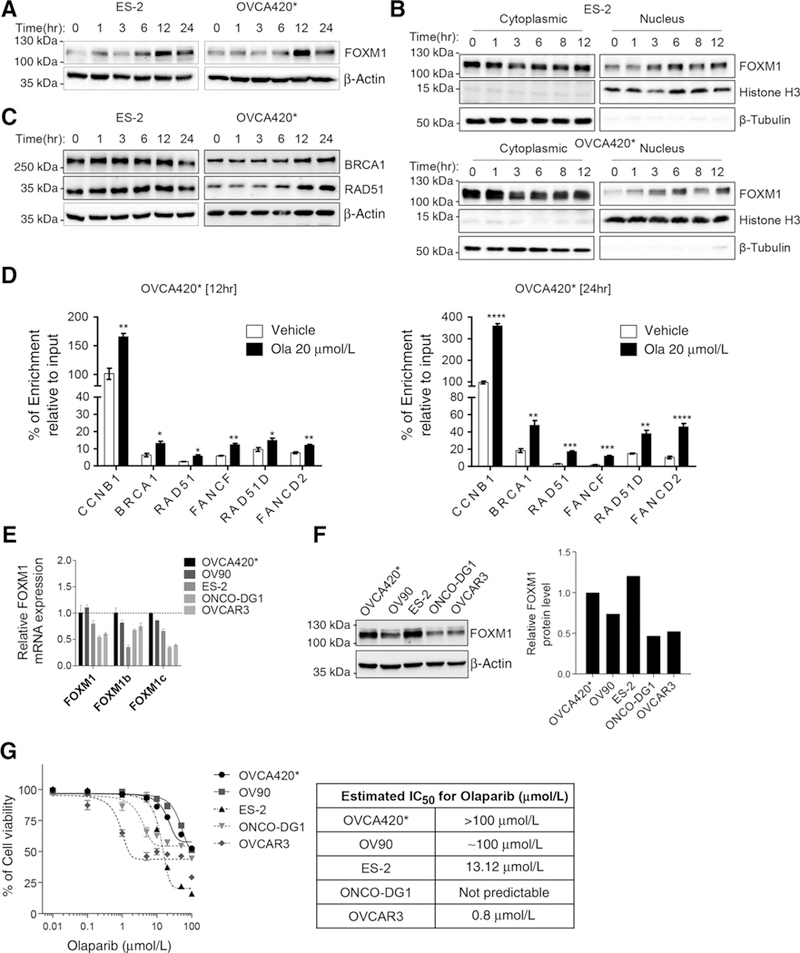
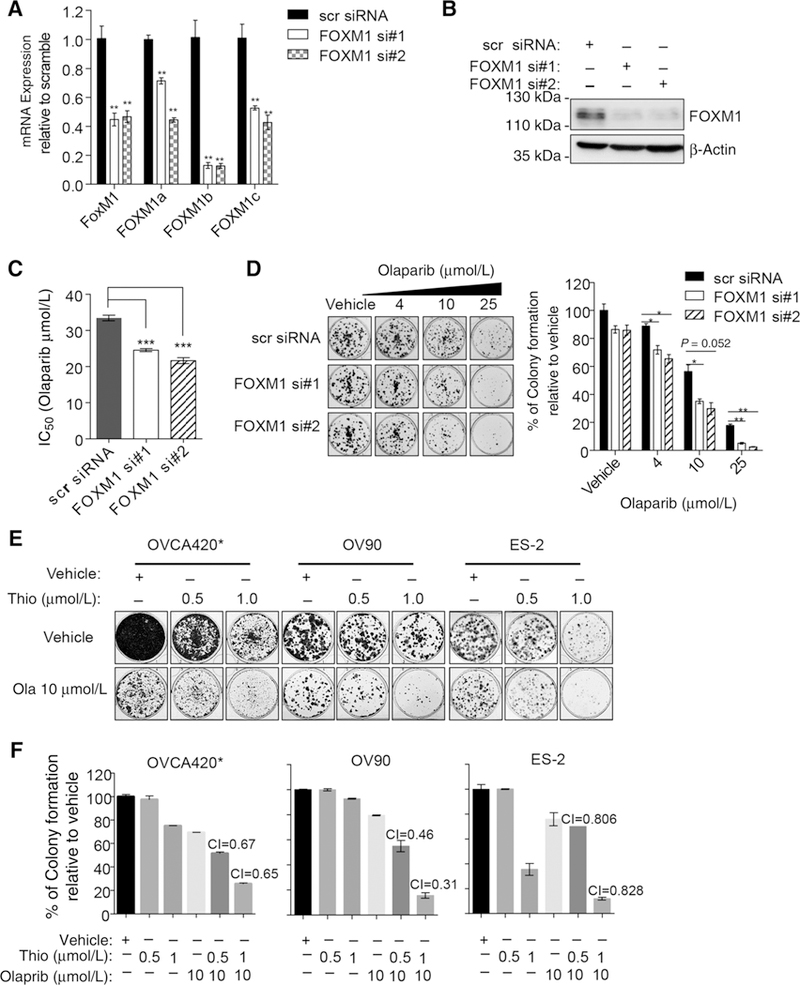
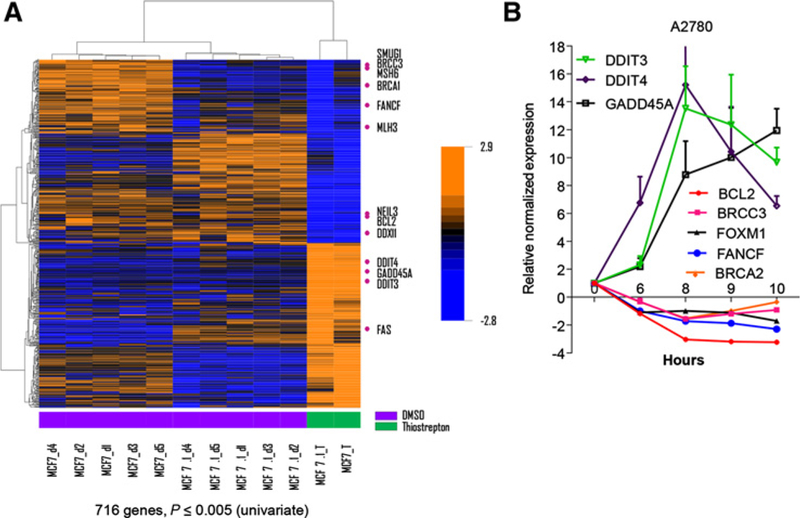
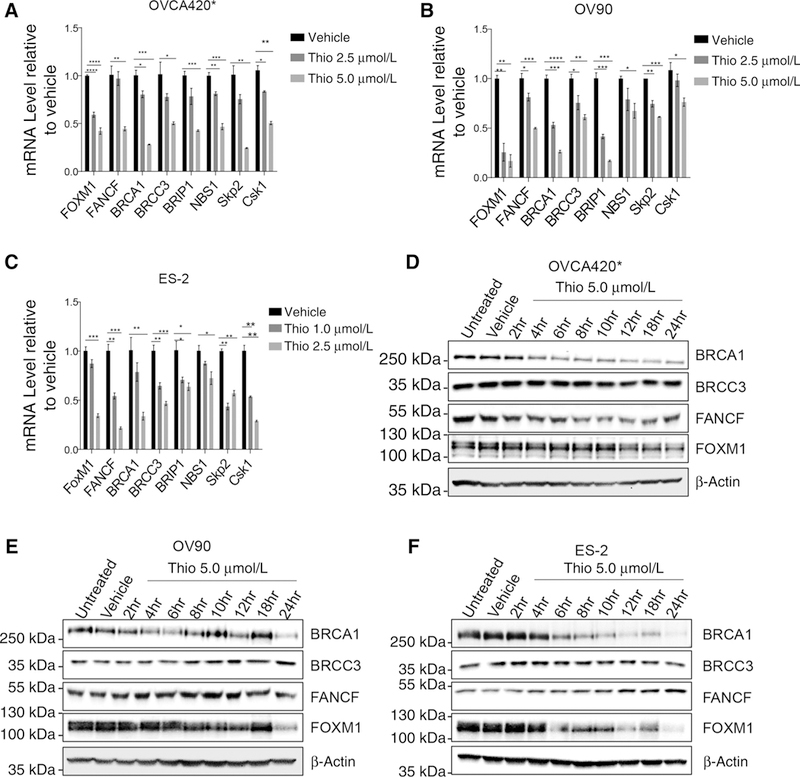
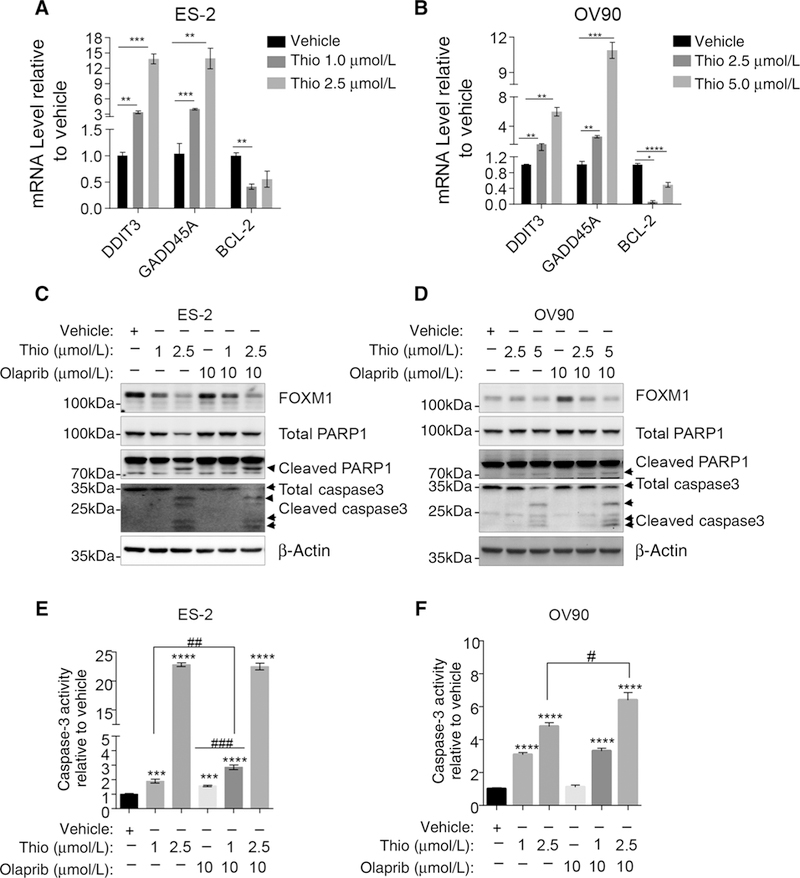
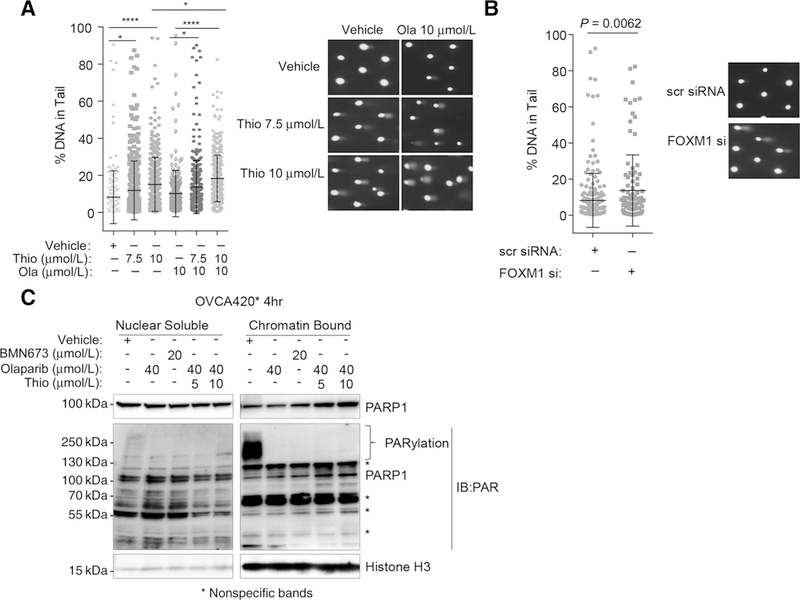
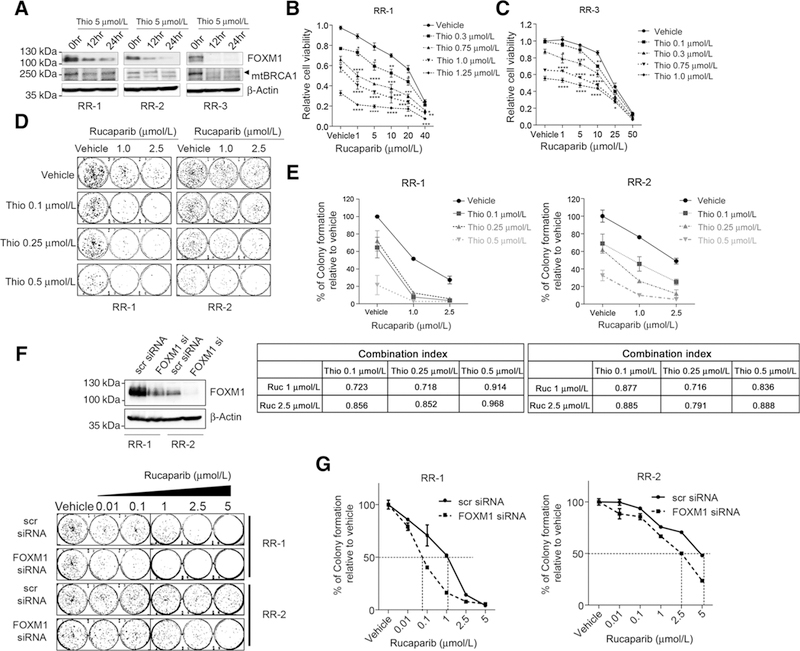
FOXM1 transcription factor network is activated in over 84% of cases in high-grade serous ovarian cancer (HGSOC), and FOXM1 upregulates the expression of genes involved in the homologous recombination (HR) DNA damage and repair (DDR) pathway. However, the role of FOXM1 in PARP inhibitor response has not yet been studied. This study demonstrates that PARP inhibitor (PARPi), olaparib, induces the expression and nuclear localization of FOXM1. On the basis of ChIP-qPCR, olaparib enhances the binding of FOXM1 to genes involved in HR repair. FOXM1 knockdown by RNAi or inhibition by thiostrepton decreases FOXM1 expression, decreases the expression of HR repair genes, such as BRCA1 and RAD51, and enhances sensitivity to olaparib. Comet and PARP trapping assays revealed increases in DNA damage and PARP trapping in FOXM1-inhibited cells treated with olaparib. Finally, thiostrepton decreases the expression of BRCA1 in rucaparib-resistant cells and enhances sensitivity to rucaparib. Collectively, these results identify that FOXM1 plays an important role in the adaptive response induced by olaparib and FOXM1 inhibition by thiostrepton induces "BRCAness" and enhances sensitivity to PARP inhibitors.Implications: FOXM1 inhibition represents an effective strategy to overcome resistance to PARPi, and targeting FOXM1-mediated adaptive pathways may produce better therapeutic effects for PARP inhibitors. Mol Cancer Res; 16(6); 961-73. ©2018 AACR.


Conflict of interest statement

Disclosure of Potential Conflicts of Interest

No potential conflicts of interest were disclosed.

Figures

Figure 1.
Figure 1.
Olaparib increases FOXM1 expression and FOXM1 levels inversely correlate with olaparib sensitivity. A, Olaparib induces FOXM1 expression. The ES-2 and OVCA420* cells were treated with 10 μmol/L olaparib for 0,1,3, 6,12, or 24 hours and subjected to immunoblotting with the FOXM1 antibody. β-Actin immunoblot is used as a loading control. B, Olaparib enhances nuclear localization of FOXM1. Cells were treated with 10 μmol/L olaparib for 0,1, 3, 6, 8, or 12 hours before subcellular fractionation followed by Western blot analysis of FOXM1 in nuclear and cytoplasmic fractions. β-Tubulin and Histone H3 were used as loading controls for cytoplasmic and nuclear protein, respectively. C, Olaparib increases the expression of BRCA1 and RAD51. The whole-cell lysates were prepared from both cell lines after exposure of 10 μmol/L olaparib for 0,1, 3, 6,12, or 24 hours and blotted with BRCA1 or RAD51 antibodies. D, Olaparib increases FOXM1 occupancy at promoter regions of its target genes. OVCA420* cells were treated with 20 μmol/L olaparib for 12 hours or 24 hours before ChIP analysis using FOXM1 antibody. Results are representative of at least three experiments (A–D). E, Quantification of FOXM1 mRNA and its isoforms (isoform b and c) in multiple ovarian cancer cell lines by qRT-PCR. Data were shown as mean ± SEM. F, Measurement of FOXM1 protein levels by immunoblotting in different ovarian cancer cells. The whole-cell lysates were used for immunoblotting with the FOXM1 antibody. The Densitometry analysis was performed to quantify FOXM1 protein levels. Data was shown from a representative experiment. G, Measurement of olaparib sensitivity in ovarian cancer cells by Sulforhodamine B (SRB) cell viability assay. A total of 3,000 cells were seeded in 96-well plates and treated with increasing concentrations of olaparib for 72 hours before SRB assay. Data were shown as mean ± SEM (n = 3–4). Results were average of 3–4 independent experiments with triplicates. The table shows estimated IC50 values for olaparib in ovarian cancer cell lines. IC50 values were extrapolated from the curve using GraphPad Prism 6 software. The cells baring curves that cannot accurately extrapolate IC50 values are shown as “not predictable.” The statistics analysis was performed with two-tail Student t test: *, P ≤ 0.05; **, P ≤ 0.01; ***, P ≤ 0.001; ****, P ≤ 0.0001.
Figure 2.
Figure 2.
FOXM1 inhibition by either siRNA or thiostrepton sensitizes cancer cells to olaparib and decreases the number of persisting clones. A and B, Verification of FOXM1 knockdown by two different siRNAs. ES-2 cells were transfected with scrambled (scr) siRNA, FOXM1 siRNA1 (si#1), or siRNA2 (si#2) and RT-qPCR (A) and immunoblotting (B) were performed after 72 hours. **, P ≤ 0.01. Data were representatives from three independent experiments. C, Estimated IC50 values of olaparib in ES-2 cells after FOXM1 depletion. The IC50 values from SRB cell viability assays were extrapolated using Prism 6 software, and the data were shown as mean ± SEM. ***, P ≤ 0.001. Results were derived from triplicates of representative experiments. D, FOXM1 knockdown decreases persisting clones in ES-2 following olaparib treatment. Forty-eight hours after siRNA transfection, cells were seeded in 6-well plates and treated with different concentrations of olaparib for 3 days. Colonies produced by persisting cells were stained with SRB and solubilized after imaging. Percentage of colony formation relative to the vehicle was shown in a bar graph. *, P ≤0.05; **, P ≤0.01. E and F, Thiostrepton synergizes with olaparib in inhibiting the colony formation of OVCA420*, OV90, and ES-2 cells. Cells were treated with thiostrepton and olaparib alone or in combination for three days followed by colony formation around 2 weeks. Colonies were stained with SRB and imaged before solubilized in Tris buffer to measure fluorescence intensity. Relative colony formation from E was quantified, and the combination indexes (CI) were calculated. Results represent experiments performed in duplicates (D-F).
Figure 3.
Figure 3.
Thiostrepton decreases the expression of antiapoptotic genes and increases the expression of proapoptotic genes. A, Heatmap showing changes in gene expression profile after thiostrepton treatment. B, qRT-PCR analysis of altered genes after thiostrepton treatment in A2780 ovarian cancer cells. A2780 cells were treated with 5 μmol/L of thiostrepton for 0, 6,8, 9, and 10 hours before total RNA extraction for RT-PCR. Data are shown as mean ± SEM in log2. Results represent experiments performed in triplicates.
Figure 4.
Figure 4.
Thiostrepton downregulates FOXM1 and FOXM1 target genes involved in the homologous recombination repair. A-C, qRT-PCR of FOXM1 and its target genes involved in the homologous recombination after thiostrepton treatment. 0VCA420* (A) and OV90 (B) cells were seeded in 6-well plates and treated with vehicle, 2.5 μmol/L, or 5.0 μmol/L of thiostrepton for 24 hours before total RNA extraction. ES-2 cells (C) were treated with vehicle, 1.0 μmol/L or 2.5 μmol/L of thiostrepton for 24 hours. Statistical analysis was performed by two-tailed Student t test. *, P ≤ 0.05; **, P ≤ 0.01; ***, P ≤ 0.001; ****, P ≤ 0.0001. Results represent experiments performed in triplicates. D-F, Immunoblot analysis of FOXM1 and its target genes after thiostrepton treatment. 0VCA420* (D), 0V90 (E), and ES-2 (F) cells were treated with 5.0 μmol/L thiostrepton for 0, 2, 4, 6, 8,10,12,18, or 24 hours before immunoblotting.
Figure 5.
Figure 5.
Thiostrepton induces apoptosis in ovarian cancer cells. A and B, Thiostrepton increases proapoptotic genes DDIT3 and GADD45A and decreases anti apoptotic gene BCL-2. ES-2 cells (A) and OV90 cells (B) were treated with vehicle or thiostrepton at the indicated concentration for 24 hours. C and D, Thiostrepton cooperates with olaparib in increasing PARP1 and caspase-3 cleavage. ES-2 (C) or OV90 (D) cells were treated with vehicle, thiostrepton alone, olaparib alone, or combination of thiostrepton and olaparib for 30 hours before checking for PARP1 and caspase-3 cleavage. E and F, Thiostrepton and olaparib increase caspase-3activities inovarian cancer cells. The significant analysis was performed with two-tail Student t test. *, P≤ 0.05; **, P ≤ 0.01; ***, P≤ 0.001; ****, P≤ 0.0001; #, P ≤ 0.05; ##, P < 0.01. Results represent experiments performed in duplicates.
Figure 6.
Figure 6.
Thiostrepton enhances DNA damage and increases PARP1 trapping onto chromatin after olaparib treatment. A, Thiostrepton and olaparib increase DNA damage in OVCA420* cells. OVCA420* cells were pretreated with vehicle, 7.5 μmol/L, or 10 μmol/L thiostrepton for 4 hours in 6-well plates before trypsinizing and seeding onto CometChip. Then cells were treated with vehicle, 7.5 μmol/L, or 10 μmol/L thiostrepton and olaparib (10 μmol/L) for another 4 hours. Comets were analyzed with Trevigen Comet Analysis Software after imaging under a 4 x fluorescent microscope. Data were shown as percent of DNA in comet tail. Representative comet images were shown on the right. The significance analysis was performed with one-way ANOVA. *, P ≤ 0.05; **, P ≤ 0.01; ***, P ≤ 0.001; ****, P ≤ 0.0001. Results represent experiments performed in triplicates. B, FOXM1 knockdown with siRNA increases DNA damages in Comet assay. Seventy-two hours after the FOXM1 knockdown, OVCA420* cells were trypsinized and seeded for comet assay using Trevigen CometChip Kit. Representative images were shown on the right. C, Thiostrepton increases PARP1 trapping onto chromatin. OVCA420* cells were treated with indicated concentrations of PARP inhibitors, olaparib or BMN673, alone or in combination with thiostrepton for 4 hours and fractionated as nuclear soluble and chromatin-bound fractions. The lysates were blotted first with PARP1 antibody and secondly with PARP antibody. ** shown as nonspecific bands. Results were from a representative of two independent experiments.
Figure 7.
Figure 7.
Thiostrepton sensitizes rucaparib-resistant cells by downregulating FOXM1 and mutant BRCA1. A, FOXM1 and mutant BRCA1 (mtBRCA1) decrease by thiostrepton treatment. Three rucaparib-resistant cells (RR-1, RR-2, and RR-3) were treated with 5 μmol/L thiostrepton for 0,12, or 24 hours and the FOXM1 and mutant BRCA1 protein levels were measured by immunoblotting. B and C, Synergistic effects of thiostrepton and rucaparib in rucaparib-resistant cells RR-1 (A) and RR-3 (B). Rucaparib-resistant cells were derived from MDA-MB-436 cells after long time exposure of rucaparib (9). 5000 cells were seeded in 96-well plates and treated with thiostrepton or olaparib alone or combinations of both drugs for 3 days before SRB assay. Cell survival curves were generated in the presence of vehicle (set as 100% of survival) or thiostrepton following increasing concentrations of rucaparib. Data were shown as mean ± SEM in a line graph. The statistics analysis was fulfilled with two-tailed Student t test. *, P ≤ 0.05; **, P ≤ 0.01; ***, P ≤ 0.001; ****, P ≤ 0.0001. Results represent experiments with four replicates. D and E, Colony formation assay of rucaparib-resistant cells RR-1 and RR-2 with thiostrepton and rucaparib. RR-1 and RR-2 cells were seeded in 6-well plates and treated with vehicle or rucaparib with or without thiostrepton. The colony formation results were shown in (D) and quantified in E, data shown as mean ± SEM. Combination index (CI) for each combination was shown underneath. F and G, Colony formation assay after FOXM1 knockdown with siRNA. F, RR-1 and RR-2 cells were transfected with scr siRNA or FOXM1 siRNA and waited 48 hours before seeding for clonogenic assay. Cells were treated with increasing concentrations of rucaparib for 3 days and allow colonies to form for 18 days. Colonies were stained with SRB and imaged. Cell lysates were collected around 72 hours after siRNA transfection and subjected to Western blot analysis to check FOXM1 knockdown efficiency. G, Quantification of relative colony formation. Stained colonies from F were solubilized in Tris buffer and measured fluorescent intensity. Data are shown as mean ± SEM of the percentage of colony formation relative to the vehicle of scr siRNA or FOXM1 siRNA, respectively. Results represent experiments performed in duplicates (D-G).

Similar articles

Cited by

References

    1. Giaccone G, Pinedo HM. Drug Resistance. Oncologist 1996;1:82–7. - PubMed
    1. Yardley DA. Drug resistance and the role of combination chemotherapy in improving patient outcomes. Int J Breast Cancer 2013;2013:137414. - PMC - PubMed
    1. Hammond WA, Swaika A, Mody K. Pharmacologic resistance in colorectal cancer: a review. Ther Adv Med Oncol 2016;8:57–84. - PMC - PubMed
    1. Pfisterer J, Ledermann JA. Management of platinum-sensitive recurrent ovarian cancer. Semin Oncol 2006;33(2 Suppl 6):S12–S16. - PubMed
    1. Siegel RL, Miller KD, Jemal A. Cancer statistics, 2015. CA Cancer J Clin 2015;65:5–29. - PubMed

Publication types

MeSH terms