. 2018 Apr 13;360(6385):176-182.
doi: 10.1126/science.aam8999. Epub 2018 Mar 15.

Single-cell profiling of the developing mouse brain and spinal cord with split-pool barcoding

Affiliations

Single-cell profiling of the developing mouse brain and spinal cord with split-pool barcoding

Alexander B Rosenberg et al. Science. .

Abstract

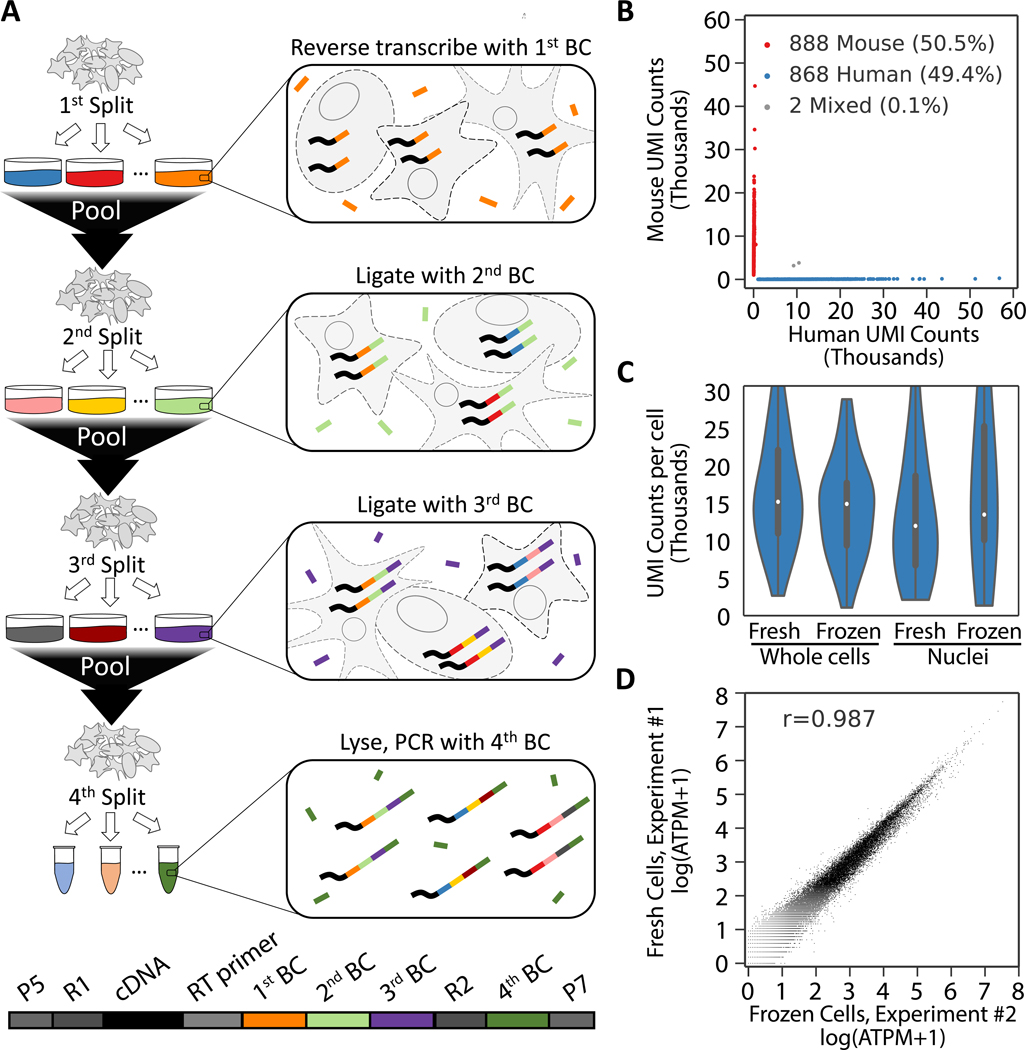
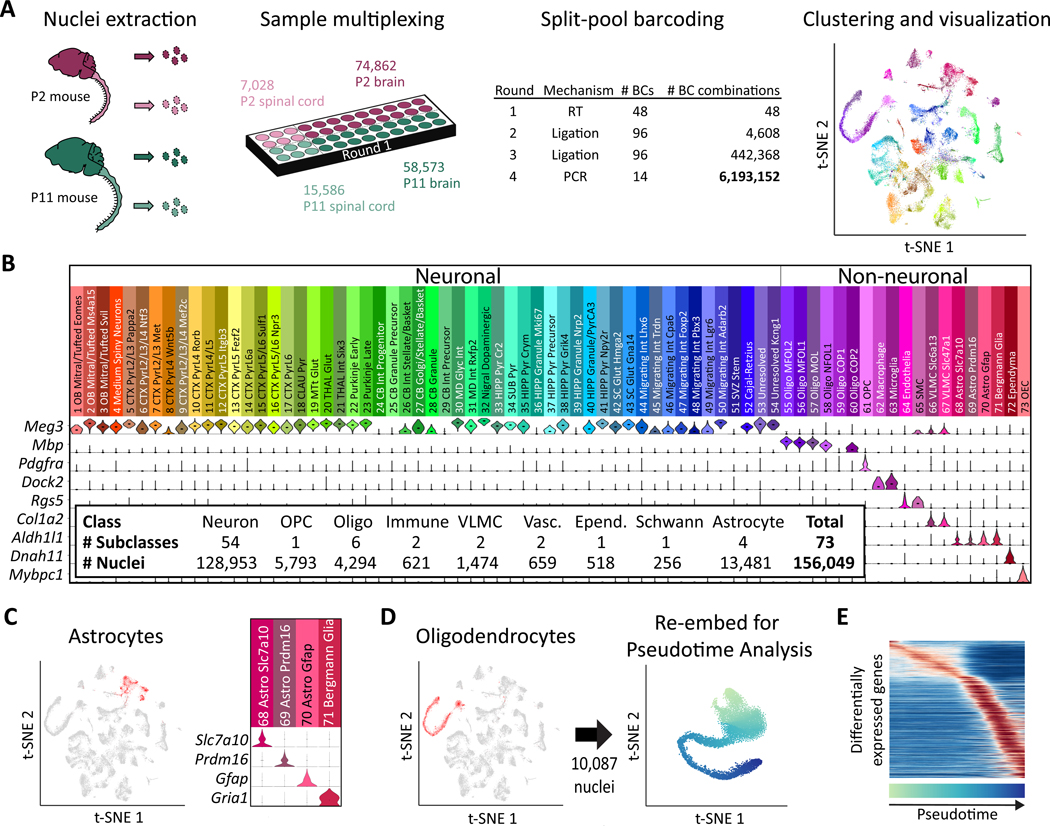
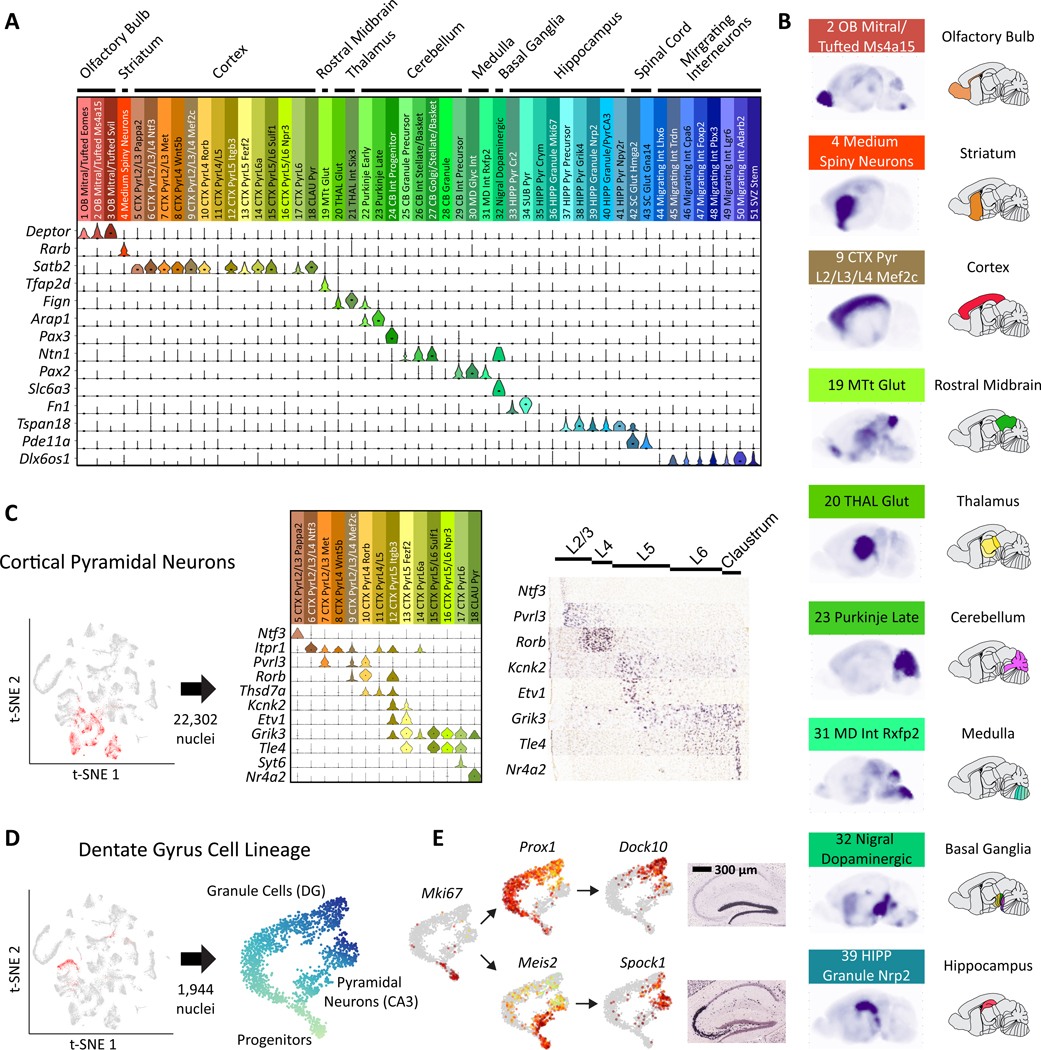
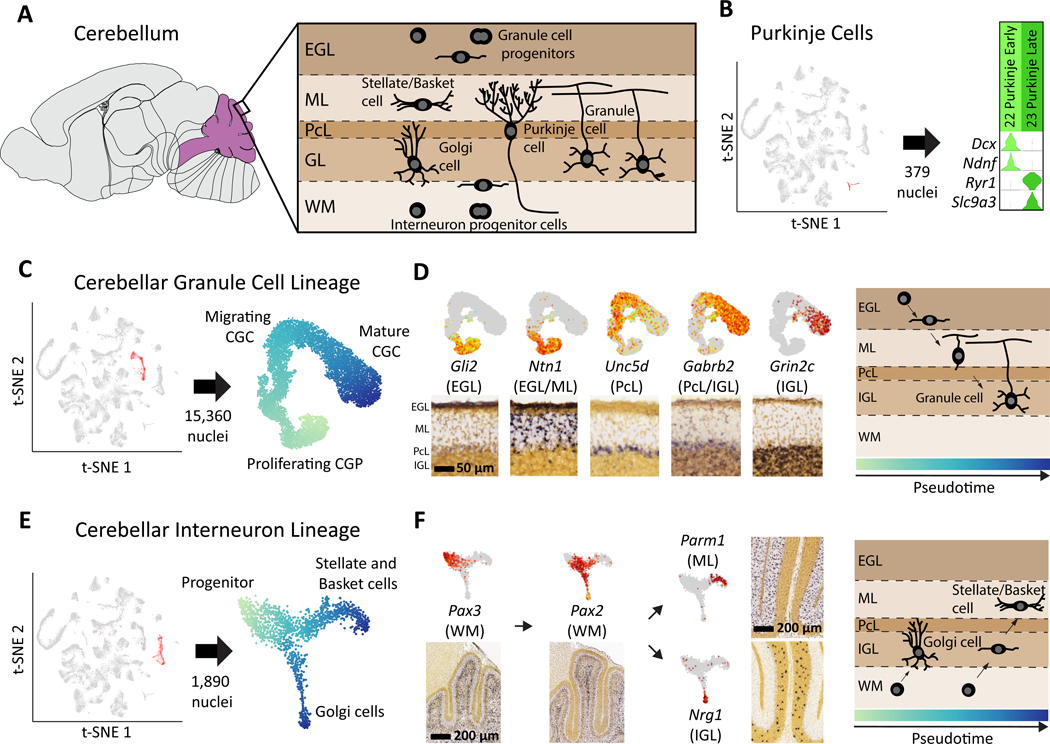
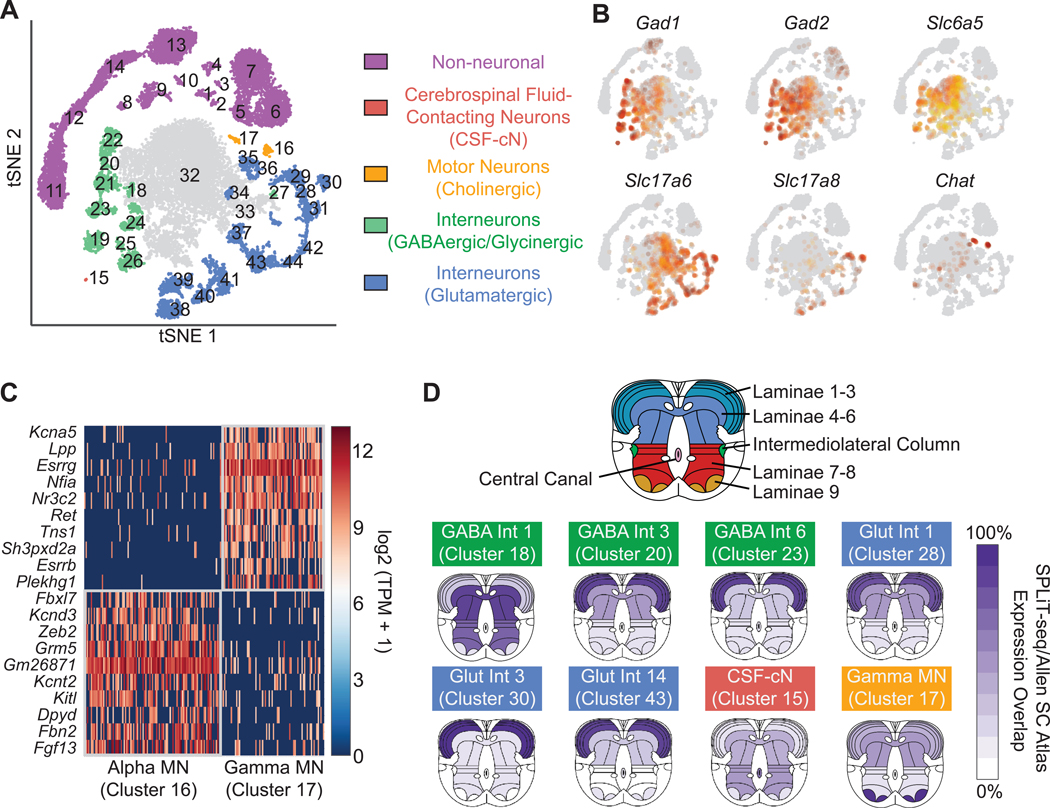
To facilitate scalable profiling of single cells, we developed split-pool ligation-based transcriptome sequencing (SPLiT-seq), a single-cell RNA-seq (scRNA-seq) method that labels the cellular origin of RNA through combinatorial barcoding. SPLiT-seq is compatible with fixed cells or nuclei, allows efficient sample multiplexing, and requires no customized equipment. We used SPLiT-seq to analyze 156,049 single-nucleus transcriptomes from postnatal day 2 and 11 mouse brains and spinal cords. More than 100 cell types were identified, with gene expression patterns corresponding to cellular function, regional specificity, and stage of differentiation. Pseudotime analysis revealed transcriptional programs driving four developmental lineages, providing a snapshot of early postnatal development in the murine central nervous system. SPLiT-seq provides a path toward comprehensive single-cell transcriptomic analysis of other similarly complex multicellular systems.


Figures

Fig. 1
Fig. 1. Overview of SPLiT-seq.
(A) Labeling transcriptomes with split-pool barcoding. In each split-pool round, fixed cells or nuclei are randomly distributed into wells and transcripts are labeled with well-specific barcodes. Barcoded RT primers are used in the first round. Second and third round barcodes are appended to cDNA through ligation. A fourth barcode is added to cDNA molecules by PCR during sequencing library preparation. The bottom scheme shows the final barcoded cDNA molecule. (B) Species mixing experiment with a library prepared from 1,758 whole cells. Human UBCs are blue, mouse UBCs are red, and mixed-species UBCs are gray. The estimated barcode collision rate is 0.2%, whereas species purity is >99%. (C) UMI counts from mixing experiments performed with fresh and frozen (stored at −80°C for 2 weeks) cells and nuclei. Median human UMI counts for fresh cells: 15,365; frozen cells: 15,078; nuclei: 12,113; frozen nuclei: 13,636. (D) Measured gene expression by SPLiT-seq is highly correlated between frozen cells and cells processed immediately (Pearson-r: 0.987). Frozen and fresh cells were processed in two different SPLiT-seq experiments.
Fig. 2.
Fig. 2.. Single-cell transcriptome landscape of postnatal brain and spinal cord development by SPLiT-seq.
(A) Over 150,000 nuclei from P2 and P11 mouse brains and spinal cords were profiled in a single experiment employing over six million barcode combinations. Transcriptomes were clustered and then visualized using t-SNE. Cells are colored according to cell type. Each cluster was downsampled to 1,000 cells for visualization. (B) A total of 73 distinct clusters were assigned to nine cell classes based on expression of established markers. The violin plots show marker gene expression in each cluster. (C) Astrocyte clusters are highlighted in red in the t-SNE. The violin plots show markers that are differentially expressed between astrocyte subtypes. (D) Seven OPC and oligodendrocyte clusters (containing 10,087 nuclei) colocalized in the original t-SNE (highlighted in red), forming a lineage. Cells from these clusters were re-embedded with t-SNE. (E) The heatmap shows genes expressed differentially across pseudotime in the oligodendrocyte lineage.
Fig. 3.
Fig. 3.. Neuronal clusters exhibit regional specificity.
(A) Marker gene expression was used to map neuronal clusters to specific brain regions. (B) Sagittal composite RNA ISH maps for nine representative clusters from distinct areas. For each cell type, we averaged ISH intensities from the Allen DMBA across the top five differentially expressed genes. (C) Types of pyramidal neurons in the cortex display layer-specific enrichments according to marker genes: cortical pyramidal neurons are highlighted in red in the t-SNE. Expression of example marker genes in pyramidal clusters is shown in the middle and corresponding available RNA ISH results on the right. (D) Three clusters constitute a developmental trajectory in the hippocampus. Re-embedding these clusters highlights the branching of the two differentiation trajectories in pseudotime. (E) Expression of differentiation marker genes is overlaid on the t-SNE. RNA ISH maps (Allen DMBA) show the regional specificity of granule cell and pyramidal neuron markers.
Fig. 4.
Fig. 4.. Neuronal differentiation trajectories in the cerebellum revealed by SPLiT-seq.
(A) Major cell types and their locations in the cerebellum. (B) Two types of Purkinje cells with distinct gene expression programs were identified. Early Purkinje cells are primarily found in the P2 brain and late Purkinje cells in the P11 brain. (C) t-SNE re-embedding of 15,360 nuclei suggests a pseudotime ordering from proliferating, to migrating, to mature CGCs. (D) Expression of marker genes is overlaid on the t-SNE, and the corresponding RNA ISH from Allen DMBA is shown below. Marker genes associated with different layers of the cerebellum are expressed at different points in pseudotime. Gene expression order is consistent with ordering of the physical layers. RNA ISH maps confirm regional specificity of marker genes. (E) t-SNE re-embedding of 1,890 nuclei reveals a branching differentiation trajectory. Progenitors can either become Golgi cells or stellate/basket cells. (F) Markers for progenitors and mature cell types are expressed at different points in pseudotime and have layer specificity.
Fig. 5.
Fig. 5.. Gene expression patterns and spatial origin of cell types in the spinal cord.
(A) Re-clustering spinal cord nuclei resulted in 30 neuronal and 14 non-neuronal clusters. (B) GABAergic neurons were defined by expression of Gad1 and Gad2. A subset of GABAergic neurons are also glycinergic, based on expression of Slc6a5. Glutamatergic neurons were defined by expression of VGLUT1 (Slc17a6), whereas cholinergic motor neurons express Chat. (C) Novel gene markers distinguish gamma motor neurons from alpha motor neurons. (D) Inferred spatial origin of neuronal clusters within the spinal cord. We analyzed the Allen Spinal Cord Atlas expression patterns of the top ten enriched genes in each cluster. Dark purple indicates expression of all ten genes in the given region, while white indicates none of the ten genes were expressed in the given region.

Similar articles

Cited by

References

    1. Picelli S et al., Smart-seq2 for sensitive full-length transcriptome profiling in single cells. Nat. Methods 10, 1096–1098 (2013). - PubMed
    1. Hashimshony T, Wagner F, Sher N, Yanai I, CEL-Seq: Single-Cell RNA-Seq by Multiplexed Linear Amplification. Cell Rep. 2, 666–673 (2012). - PubMed
    1. Jaitin DA et al., Massively parallel single-cell RNA-seq for marker-free decomposition of tissues into cell types. Science. 343, 776–9 (2014). - PMC - PubMed
    1. Macosko EZ et al., Highly Parallel Genome-wide Expression Profiling of Individual Cells Using Nanoliter Droplets. Cell. 161, 1202–1214 (2015). - PMC - PubMed
    1. Klein AM et al., Droplet barcoding for single-cell transcriptomics applied to embryonic stem cells. Cell. 161, 1187–201 (2015). - PMC - PubMed

Publication types