. 2018 Mar 15;8(1):4598.
doi: 10.1038/s41598-018-22880-y.

Precise Doppler shift compensation in the hipposiderid bat, Hipposideros armiger

Affiliations

Precise Doppler shift compensation in the hipposiderid bat, Hipposideros armiger

Diana Schoeppler et al. Sci Rep. .

Abstract

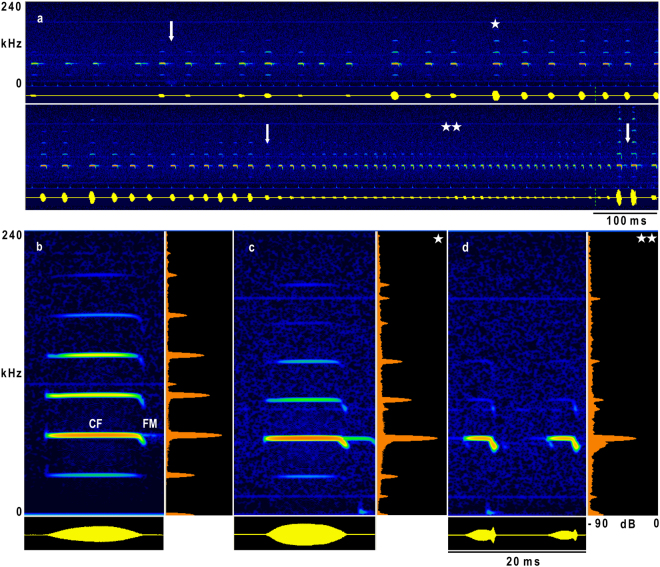
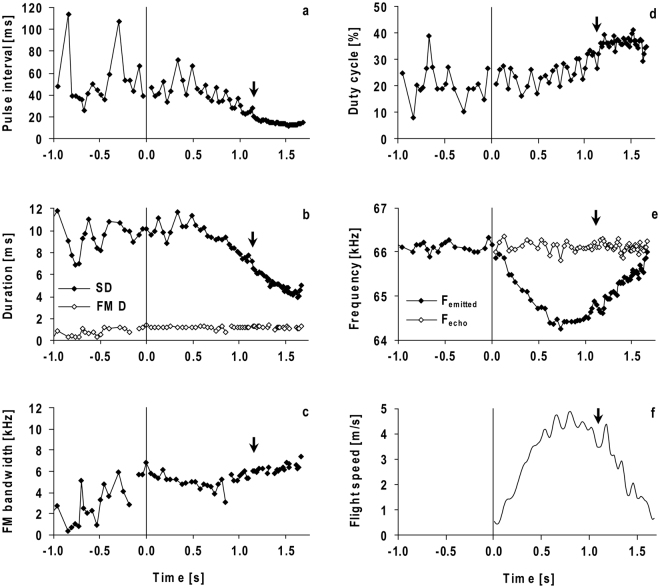
Bats of the Rhinolophidae and Hipposideridae families, and Pteronotus parnellii, compensate for Doppler shifts generated by their own flight movement. They adjust their call frequency such that the frequency of echoes coming from ahead fall in a specialized frequency range of the hearing system, the auditory fovea, to evaluate amplitude and frequency modulations in echoes from fluttering prey. Some studies in hipposiderids have suggested a less sophisticated or incomplete Doppler shift compensation. To investigate the precision of Doppler shift compensation in Hipposideros armiger, we recorded the echolocation and flight behaviour of bats flying to a grid, reconstructed the flight path, measured the flight speed, calculated the echo frequency, and compared it with the resting frequency prior to each flight. Within each flight, the average echo frequency was kept constant with a standard deviation of 110 Hz, independent of the flight speed. The resting and reference frequency were coupled with an offset of 80 Hz; however, they varied slightly from flight to flight. The precision of Doppler shift compensation and the offset were similar to that seen in Rhinolophidae and P. parnellii. The described frequency variations may explain why it has been assumed that Doppler shift compensation in hipposiderids is incomplete.


Conflict of interest statement

The authors declare no competing interests.

Figures

Figure 1
Figure 1
Sonogram and oscillogram (512 FFT, blackman) of an echolocation sequence in flight (a) with representative signals (bd). The bat (HA 2) started to fly at the 1st arrow, the 2nd arrow indicates the beginning of the terminal approach, and the 3rd arrow the time of landing. Sonograms, oscillograms, and averaged power spectra of representative signals of a resting signal (b), an echolocation signal during the orientation flight (c), and the terminal approach (d). The CF and FM component of the signal are marked in (b). (c) and (d) are taken from the echolocation sequence shown in (a) and marked with asterisks. The oscillogram in (d) was amplified by a factor of two.
Figure 2
Figure 2
Signal parameters (ae) and flight speed (f) of a representative flight of HA 2 (same sequence as shown in Fig. 1). Signal parameters (ae) include the last 20 resting signals before take-off. The bat took off at 0 s and landed at 1.67 s. The beginning of the terminal approach is marked with an arrow. The duration of the total signal (SD) and the duration of the FM component (FM D) are shown in (b). Emission frequency (Femitted) and echo frequency (Fecho) during flight are calculated for targets ahead (e) by using the flight speed (f). Before take-off the emission frequency corresponds to the resting frequency (Frest) (e). The averaged Fecho corresponds to the Fref.
Figure 3
Figure 3
Reference frequency (Fref) and corresponding resting frequency (Frest). Mean ± SD of the CF2- or resting frequencies before the bats take-off (black bars) and Fref (white bars) for 20 flights per bat (a). The x-axis shows the number of the flight within one session. The distribution of the offset between Frest and Fref is shown in (b).
Figure 4
Figure 4
Echo frequency plotted against flight speed for HA 1 and HA 2. Means of the echo frequencies (Fecho) calculated for 0.5 m/s classes of ten flights (coloured) (a). Deviation of Fecho from the reference frequency of the corresponding flight calculated for each call of ten flights (grey dots). Black dots indicate means (±SD) calculated for 0.5 m/s classes (b).
Figure 5
Figure 5
Correlation between the means of resting frequency and reference frequency. For each bat, 20 flights with linear regression lines are shown. The grey line indicates the angle bisector.

References

    1. Schnitzler H-U, Kalko EKV. Echolocation by insect-eating bats. BioScience. 2001;51:557–569. doi: 10.1641/0006-3568(2001)051[0557:EBIEB]2.0.CO;2. - DOI
    1. Schnitzler H-U, Moss CF, Denzinger A. From spatial orientation to food acquisition in echolocating bats. Trends Ecol. Evol. 2003;18:386–394. doi: 10.1016/S0169-5347(03)00185-X. - DOI
    1. Denzinger A, Schnitzler H-U. Bat guilds, a concept to classify the highly diverse foraging and echolocation behaviors of microchiropteran bats. Front. Physiol. 2013;4:164. doi: 10.3389/fphys.2013.00164. - DOI - PMC - PubMed
    1. Schnitzler H-U, Denzinger A. Auditory fovea and Doppler shift compensation: adaptations for flutter detection in echolocating bats using CF-FM signals. J. Comp. Physiol. A. 2011;197(5):541–559. doi: 10.1007/s00359-010-0569-6. - DOI - PubMed
    1. Denzinger, A., Tschapka, M. & Schnitzler, H.-U. The role of echolocation strategies for niche differentiation in bats. Can J Zool, doi:10.1139/cjz-2017–0161 (2017).

Publication types

LinkOut - more resources