Comparative Study
. 2018 Mar 15;9(1):1096.
doi: 10.1038/s41467-018-03502-7.

Voltage gating of mechanosensitive PIEZO channels

Affiliations
Comparative Study

Voltage gating of mechanosensitive PIEZO channels

Mirko Moroni et al. Nat Commun. .

Abstract

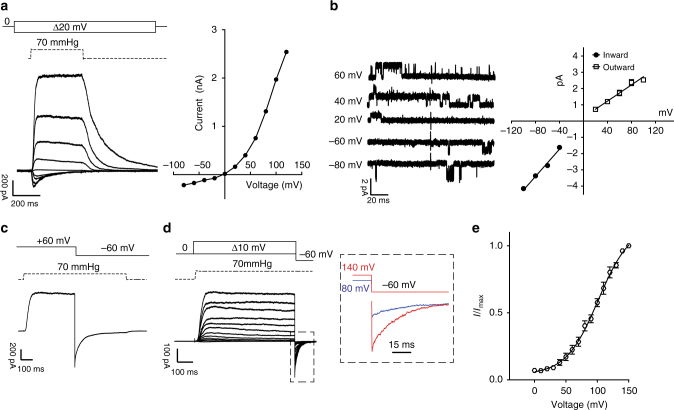
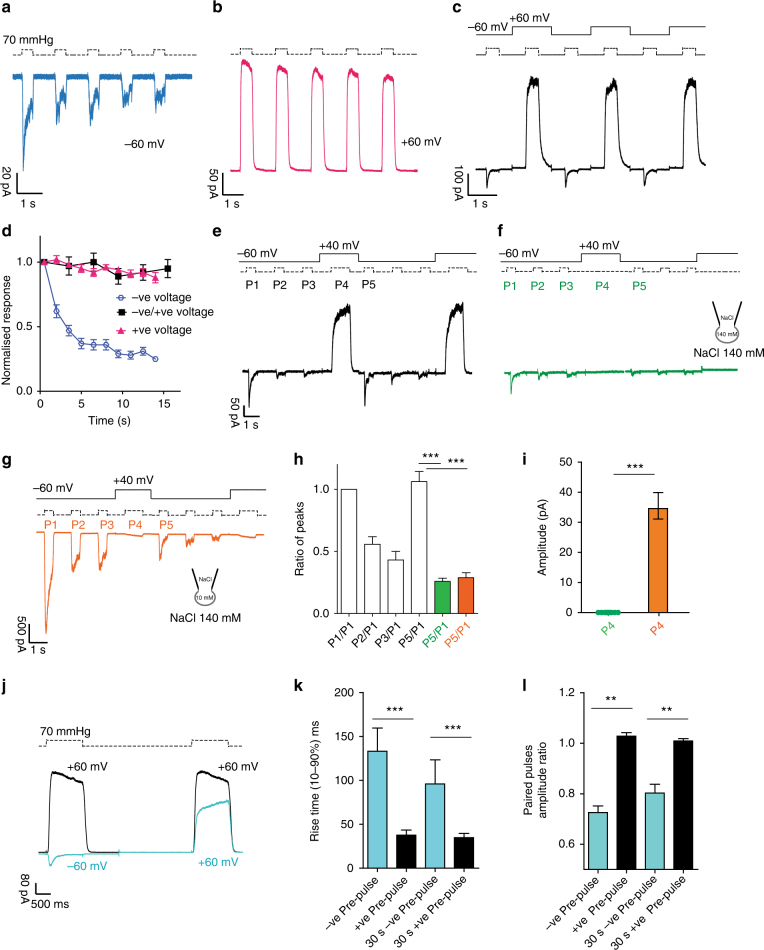
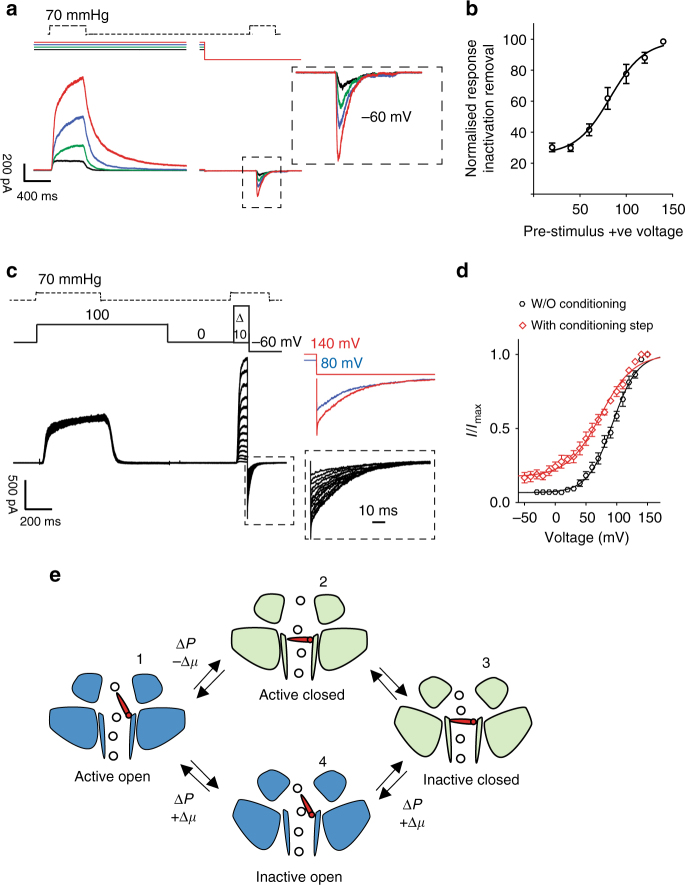
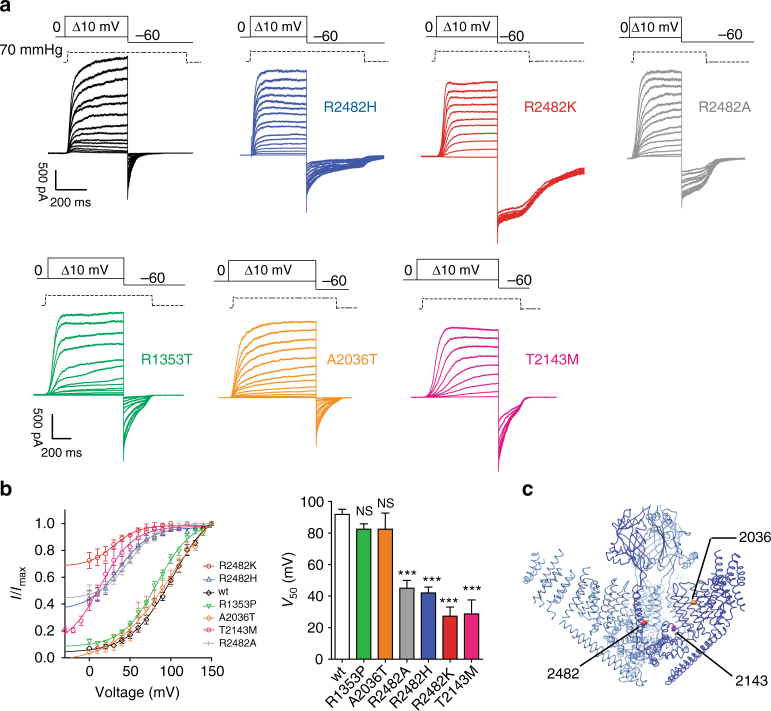
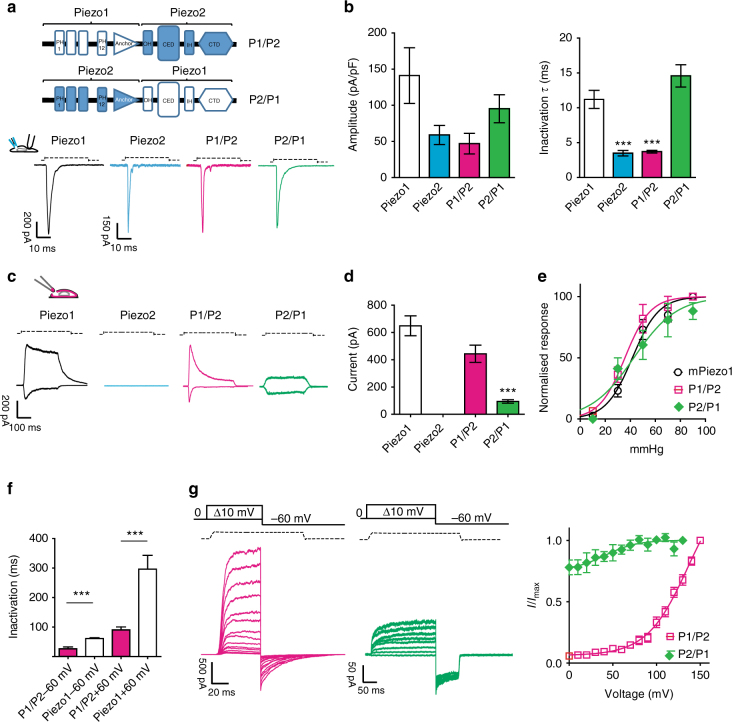
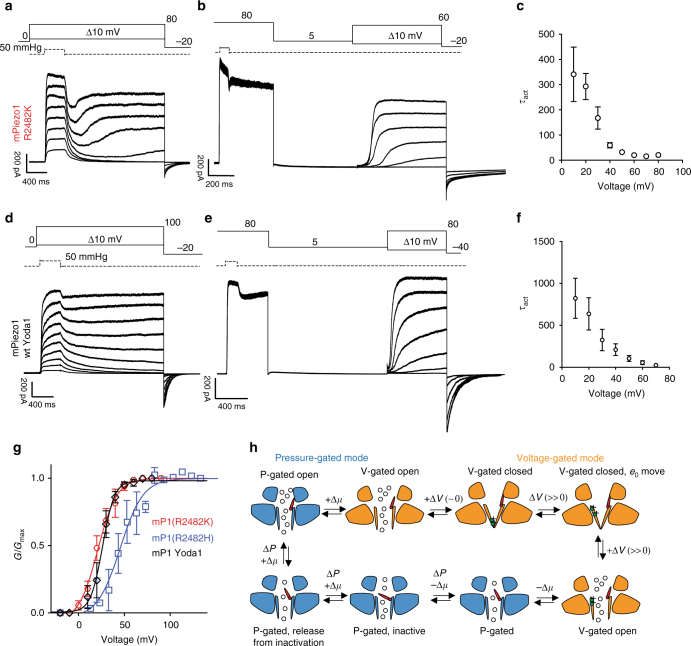
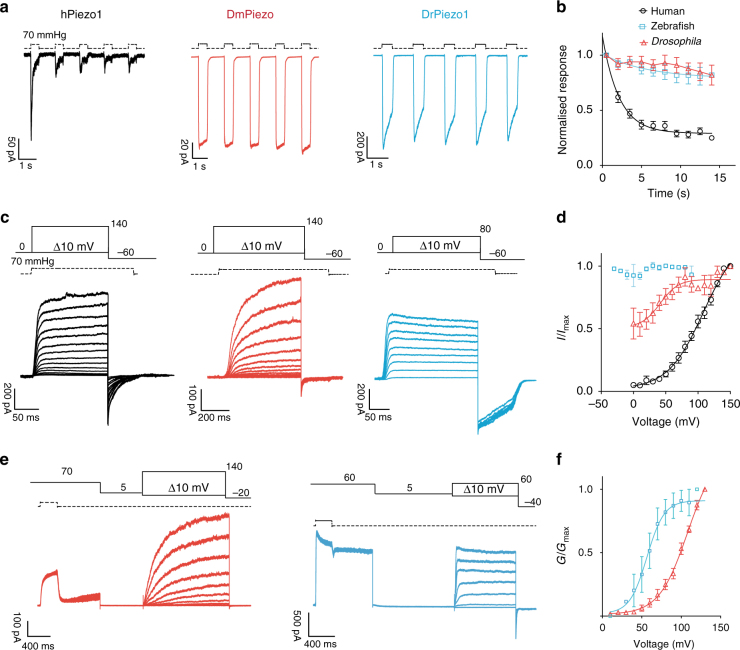
Mechanosensitive PIEZO ion channels are evolutionarily conserved proteins whose presence is critical for normal physiology in multicellular organisms. Here we show that, in addition to mechanical stimuli, PIEZO channels are also powerfully modulated by voltage and can even switch to a purely voltage-gated mode. Mutations that cause human diseases, such as xerocytosis, profoundly shift voltage sensitivity of PIEZO1 channels toward the resting membrane potential and strongly promote voltage gating. Voltage modulation may be explained by the presence of an inactivation gate in the pore, the opening of which is promoted by outward permeation. Older invertebrate (fly) and vertebrate (fish) PIEZO proteins are also voltage sensitive, but voltage gating is a much more prominent feature of these older channels. We propose that the voltage sensitivity of PIEZO channels is a deep property co-opted to add a regulatory mechanism for PIEZO activation in widely different cellular contexts.


Conflict of interest statement

The authors declare no competing interests.

Figures

Fig. 1
Fig. 1
Rectification and voltage modulation of pressure-mediated PIEZO1 currents. a Left: example traces of currents elicited at a constant saturating pressure (70 mmHg) and at increasing voltages (in 20 mV steps from −100 to 100 mV) in symmetrical Na+ from excised outside-out patches overexpressing mPIEZO1 in N2a cells. Right: peak currents are plotted against voltage to show an I/V relationship. Note the outward rectifying behavior. b Left: single channel openings were recorded at negative and positive voltages to obtain the slope-conductance values. Right: linear regressions from individual patches were averaged and pooled. Inward slope conductance was significantly higher than outward slope conductance (41.3 ± 0.9 pS and 27.1 ± 1.2 pS, respectively, three cells. Student’s t-test P = 0.0006, dF = 4). c Example trace of instantaneous currents recorded upon switching voltage from +60 to −60 mV during the application of a 70 mmHg pressure stimulus (rectification index 1.13 ± 0.06 (n = 8)). Capacitance currents were digitally subtracted. d Current responses to a pressure stimulation of 70 mmHg during 300 ms voltage steps ranging from 0 to 150 mV, followed by a repolarization step to −60 mV to obtain tail currents. The inset shows an expanded example of tail currents at −60 mV originated from a pre-stimulation step at 80 (blue) and 140 mV (red) in the presence of 70 mmHg of pressure. e Tail currents from individual cells were normalized to their maximum and fitted to Boltzmann relationship (V50 = 91.9 ± 3.2 mV, slope 22.2 ± 0.9, 12 cells). Pooled data are shown as mean ± SEM
Fig. 2
Fig. 2
Inactivation and desensitization of PIEZO1 can be reset by outward permeation. Repetitive pressure stimulations desensitize PIEZO1 at −60 mV (a) but not at +60 mV (b). Note the decreased peak current and low peak/steady-state current ratio at −60 mV. c Alternating pressure pulses at −60 mV and +60 mV abolishes desensitization and prevents PIEZO1 from entering a non-inactivating state. d Peak currents in a (negative pulses), b (positive pulses) and c (negative pulses) were normalized to the first response and plotted against time. Desensitization is absent at alternating voltages. e Three pressure pulses (P1, P2, P3) at −60 mV were applied to patches expressing PIEZO1 to drive the channel into a desensitized state, followed by one positive pressure pulse (P4) at +40 mV. The sequence was repeated twice. Outward permeation (P4) recovers PIEZO1 initial current (P1), as shown by the ratio of P5/P1, shown in h). f The stimulation sequence in e was repeated in absence of pressure at P4. The recovery from desensitization does not occur at +40 mV in absence of permeation. g The same protocol in Fig. 2e was repeated with the ionic concentrations shown. Inward currents flow at P4 at +40 mV. No recovery from desensitization is observed at P5, underlining the importance of outward permeation for resetting channel kinetics. h The P5/P1 ratio for e (white, n = 10), f (green, n = 13), and g (orange, n = 7) are shown and are statistically different (Anova, Dunnett’s post-hoc test, dF = 18, white vs green P = 0.00004, white vs orange P = 0.001). i Raw amplitude levels for P4 in f (green) or g (orange) are statistically different (Student’s t-test P = 0.00003, dF = 20). j Paired pulses protocol of a pressure stimulus at +60 mV preceded by either a pressure step at −60 mV (light blue) or at +60 mV (black). The direction of the first current stimulus affects the amplitude and the time course of activation of an identical second step at +60 mV. k The rise time and the amplitude ratio of the second stimulus at +60 mV in j are compared. The interval between the two stimuli was either 2 or 30 s. Both parameters are significantly different (Students t-test P < 0.001, n = 28, dF = 26). The data are shown as mean ± SEM
Fig. 3
Fig. 3
Increasing outward permeation determines the number of channels available for activation. a A constant pressure pulse at −60 mV was preceded by a constant pressure stimulation (70 mmHg) at increasing voltages (20 mV black, 40 mV green, 60 mV blue, and 80 mV red). The current amplitude of the second pressure stimulation depends on the driving force applied during the preceding step, showing that the larger the applied driving force the greater the relief from inactivation. b The conditioning stimulus voltage was plotted against the normalized current amplitude of the currents recorded at −60 mV. Single cells were fitted individually to a Boltzmann fit. The data shown represent pooled data from  10 cells (V50 = 85.5 ± 5 mV). c Tail current protocol as in Fig. 1d preceded by a conditioning pressure pulse at +100 mV to remove ~80% of inactivation. d Tail currents from individual cells were normalized to their maximum and fitted to a Boltzmann relationship (V50 = 90.6 ± 2.9 mv, slope 24.6 ± 1.6, n = 12 cells without the conditioning step, black trace, V50 = 68.3 ± 10.2 mV, slope 43.7 ± 2.3, 5 cells, with conditioning step at +100 mV, red trace, unpaired Student’s t-test P = 0.0036, dF = 15). Pooled data are shown as mean ± SEM. e Proposed transition between active and inactive state PIEZO1. Activation by pressure (ΔP) and negative electrochemical gradient (−Δμ) drives the channel into an inactive state (domains tilted upward). Pressure and positive electrochemical gradient (+Δμ) reset the channel to an active state by opening an inactivation gate. The transition 3-4-1 is a slow conformational change as suggested by the rise time and amplitude in Fig. 2j, k, l
Fig. 4
Fig. 4
Mutations causing xerocytosis in humans alter voltage modulation of PIEZO1. a Current responses to a pressure stimulation of 70 mmHg during 300 ms voltage steps ranging from 0 to 150 mV, followed by a repolarization step to −60 mV to obtain tail currents for wild-type PIEZO1 (black), R2482H (blue), R2482K (red), R1353T (green), A2036T (orange), T2143 (magenta), and R2482A (gray) mutants. The R2482K mutant shows decreased voltage modulation. b Tail currents from individual cells were normalized to their maximum and fitted to a Boltzmann relationship (wt: V50 = 91.9 ± 3.2 mV, slope 22.2 ± 0.9, 12 cells; R2482H V50 = 42.0 ± 3.7 mV, slope 14.4 ± 1.5, 19 cells; R2482K V50 27.2 ± 5.9 mV, slope 12.2 ± 1.5, 10 cells, R1353P V50 = 82.4 ± 8.8 mV, slope 20.1 ± 1.3, 8 cells, A2036T V50 = 82.4 ± 10.2 mV, slope 22.4 ± 0.9, 5 cells; T2143M V50 = 28.7 ± 8.8 mV, slope 17.6 ± 2.0, 8 cells; R2482A V50 = 45.5 ± 5.4 mV, slope 15.1 ± 2.1, 10 cells. One-way ANOVA, Dunnett’s post-test, significance P < 0.0001, dF = 72). Pooled data are shown as mean ± SEM. c 3D structure of the trimeric mPIEZO1 showing the position of the mutants involved in xerocytosis. R1353 is located on the beam and is not shown. R2482 is in the bottom of the inner helix, A2036 is located in a peripheral helix, and T2143 is in the anchor domain. Molecular graphic was performed with the UCSF Chimera package
Fig. 5
Fig. 5
PIEZO chimeras respond to membrane stretch. a Chimeric PIEZO channels were constructed by fusing the N-terminal region of one protein to the pore domain of the other protein including the CED region. PIEZO1, PIEZO2, and the chimeric channels were overexpressed in N2a Piezo1−/− cells (Supplementary Fig. 3). Cells were clamped at −60 mV and subjected to soma indentation. b The maximum current amplitude (normalized for the capacitance) is plotted. The time course of inactivation for each construct was fitted to a mono-exponential function. PIEZO1 inactivation was approximately threefold slower than PIEZO2 and the chimeric receptor was P1/P2 (ANOVA, dF = 25, Dunnett’s post-hoc test P < 0.023). The P1/P2 chimera showed a current amplitude and a time course of inactivation similar to PIEZO2. The P2/P1 chimera showed a current amplitude and a time course of inactivation similar to PIEZO1. c Typical response of the chimeric channels and wild-type PIEZO1 to membrane stretch in outside-out patches. Outside-out patches pulled from cells overexpressing PIEZO2 did not respond to stretch stimulation. d Maximal current level recorded in outside-out patches at −60 mV. Current levels for P2/P1 were significantly different from PIEZO1 patches (n = 10, Student’s t-test, P = 0.0003, dF = 25. e Pressure–response relationships of the chimeric channels are not different from PIEZO1 (P1/P2 37.6 ± 4.6 mmHg, 10 cells; PIEZO1 38.9 ± 3.1 mmHg, 21 cells; P2/P1 42.4 ± 4.7 mmHg, 7 cells, Anova Dunnet’s post-test P = 0.78, dF = 32). f The decay of inactivation for pressure-mediated responses at +60 and −60 mV is plotted for the chimeric and PIEZO1 channels. Also for pressure-mediated responses, the kinetic of inactivation of PIEZO1 remained approximately threefold slower than the chimeric channel P1/P2 (P1/P2 26.3 ± 6.2 ms, 10 cells; PIEZO1 60.9 ± 5.1 ms at −60 mV, 9 cells, Student’s t-test, P = 0.0025, dF = 17). The P2/P1 chimera did not show any inactivation properties. g Example traces of tail current protocols (at 70 mmHg) for chimeric channels ranging from 0 to 150 mV, followed by a repolarization step to −60 mV. Tail currents (−60 mV) from individual cells were normalized to their maximum and plotted against voltage (n = 10). Pooled data mean ± SEM are shown
Fig. 6
Fig. 6
PIEZO1 transitions between a pressure-gated and a voltage-gated mode. a PIEZO1 R2482K mutant was subjected to pressure stimulations at increasing voltages (from 10 to 80 mV) with a deactivation of 2 s. After an initial deactivation, PIEZO1 at voltages >40 mV undergoes a reactivation phase. b A saturating pressure pulse at 80 mV was applied to force the channel to reactivate and switch to a voltage-gated mode. Following a 2 s deactivation period at 5 mV (to prevent the inactivation gate from closing), a family of 1 s steps at increasing voltages (in absence of pressure) was applied, showing that PIEZO1 R2482H/K can be activated by voltage. c The mean time, constant of activation (±SEM) for mutant R2482K, is plotted against increasing voltages (n = 10). d wild-type PIEZO1 undergoes reactivation in the presence of the gating modifier Yoda1 (5 μM) in the intracellular solution. The same voltage/pressure protocol was applied as in a. e PIEZO1 can be activated by voltage in presence of Yoda1 (5 μM) intracellularly in absence of externally applied pressure. The same protocol was applied as in b. f The kinetic of activation decreased at more depolarized voltages as it occurs in voltage-gated ion channels (n = 5). g Conductance–voltage relationships for PIEZO1 R2482K (red, n = 10), R2482H (blue, n = 8), wt +Yoda1 5 μM (black, n = 5) in voltage-gated mode were fitted to a Boltzmann equation. The data are displayed as mean ± SEM. h Proposed model for gating transitions of PIEZO1. Bottom left: PIEZO1 inactivation gate opens during outward permeation (+Δμ) and application of pressure (ΔP) (red inactivation gate partially tilted upward). A persistent depolarization can overcome inactivation and induce a reactivation of the channel (inactivation gate completely open) and a switch to a voltage-gated mode (orange). Deactivation of the channel at voltages close to 0 leads to channel closure. Further depolarization causes a movement of gating charges and opening of the channel. Inward permeation (−Δμ) brings the inactivation gate back into the pore and allows the channel to switch back to a pressure-gated mode. Further, pressure-mediated inward permeation leads the channel into an inactive state (inactivation gate tilted toward the center of the pore). Such transition is reversible and mediated further by outward permeation
Fig. 7
Fig. 7
Properties of human, Drosophila and zebrafish PIEZO1. a Five pulses of saturating pressures at −60 mV were applied to patches pulled from N2a Piezo1−/− expressing the human (black, n = 8), Drosophila (red, n = 5), and zebrafish PIEZO1 (blue, n = 9). b Current amplitudes were normalized to the first-pressure pulse and plotted against time. Pooled data are shown as mean ± SEM. c Current responses to a pressure stimulation of 70 mmHg during 300 ms voltage steps ranging from 0 to 140 mV, followed by a repolarization step to −60 mV to obtain tail currents. d Tail currents from individual cells were normalized to their maximum and fitted to the Boltzmann relationship (human V50 = 96.7 ± 4.8 mV, slope 19.9 ± 0.9, 5 cells; Drosophila V50 = 40.0 ± 9.8 mV, slope 12.1 ± 3.9, 7 cells). Note how the pressure-mediated currents of the zebrafish PIEZO1 are insensitive to voltage. Pooled data are shown as mean ± SEM. e Same stimulation protocol as in Fig. 6b for DmPIEZO (red) and DrPIEZO1 (blue). f Macroscopic conductance values were normalized to maximum conductance and plotted against voltage to obtain a G/V curve. DmPIEZO did not reach saturation at voltages as high as 140 mV, while DrPIEZO had V50 of 20.2 ± 6.8 mV and a slope of 7.9 ± 1.3 (n = 7). (See also Supplementary Figs 2, 5 and 6)

Comment in

References

    1. Ranade SS, et al. Piezo1, a mechanically activated ion channel, is required for vascular development in mice. Proc. Natl Acad. Sci. USA. 2014;111:10347–10352. doi: 10.1073/pnas.1409233111. - DOI - PMC - PubMed
    1. Li J, et al. Piezo1 integration of vascular architecture with physiological force. Nature. 2014;515:279–282. doi: 10.1038/nature13701. - DOI - PMC - PubMed
    1. Lukacs V, et al. Impaired PIEZO1 function in patients with a novel autosomal recessive congenital lymphatic dysplasia. Nat. Commun. 2015;6:8329. doi: 10.1038/ncomms9329. - DOI - PMC - PubMed
    1. Ranade SS, et al. Piezo2 is the major transducer of mechanical forces for touch sensation in mice. Nature. 2014;516:121–125. doi: 10.1038/nature13980. - DOI - PMC - PubMed
    1. Coste B, et al. Piezo1 and Piezo2 are essential components of distinct mechanically activated cation channels. Science. 2010;330:55–60. doi: 10.1126/science.1193270. - DOI - PMC - PubMed

Publication types

LinkOut - more resources