

Physiological and biochemical changes during drought and recovery periods at tillering and jointing stages in wheat (Triticum aestivum L.)
- PMID: 29545536
- PMCID: PMC5854670
- DOI: 10.1038/s41598-018-21441-7
Physiological and biochemical changes during drought and recovery periods at tillering and jointing stages in wheat (Triticum aestivum L.)
Abstract
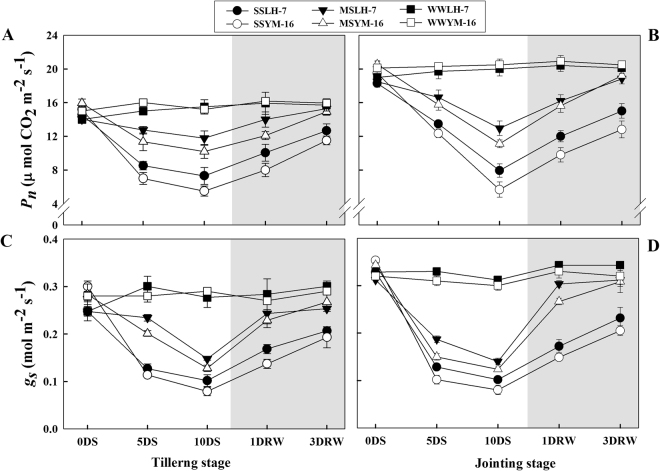
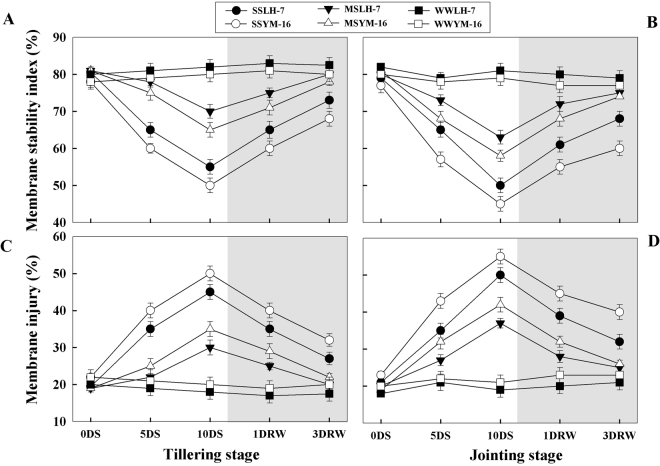
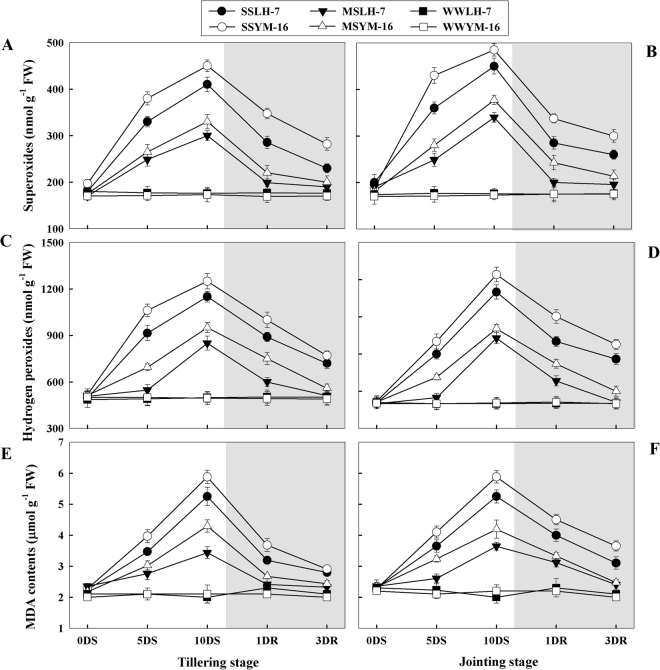
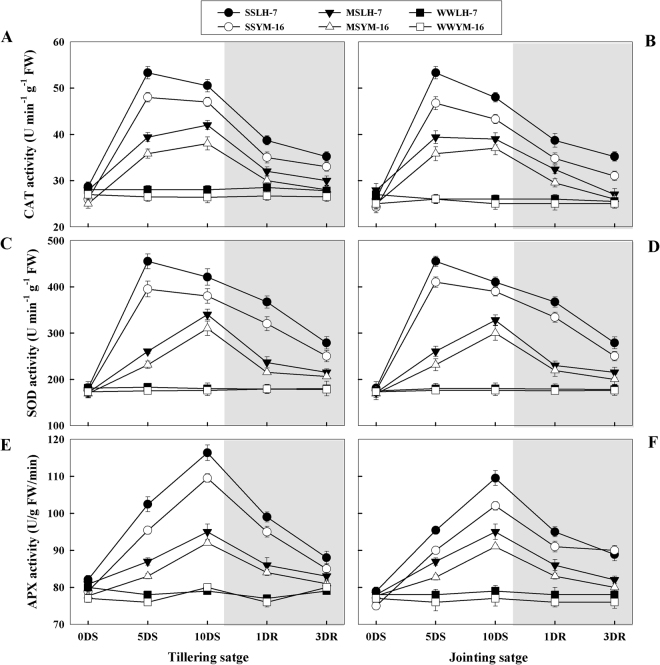
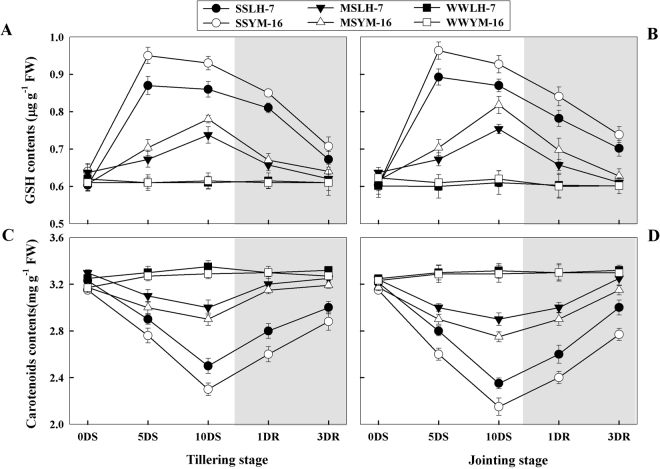
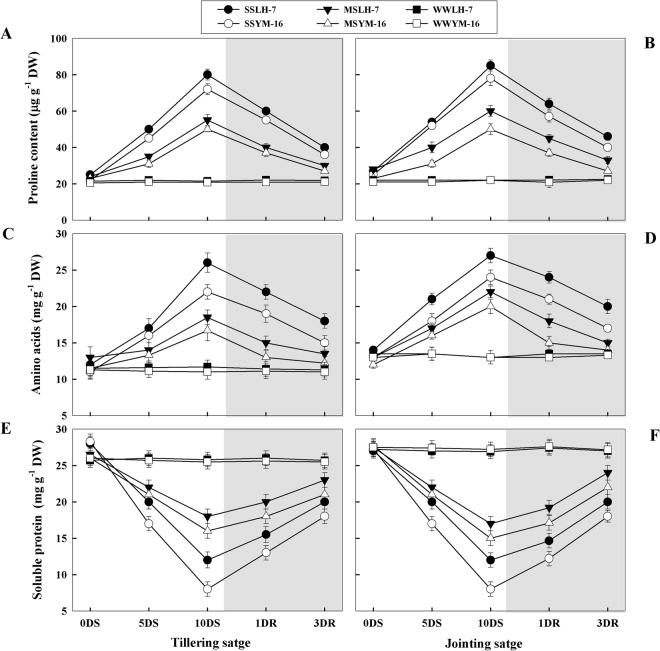
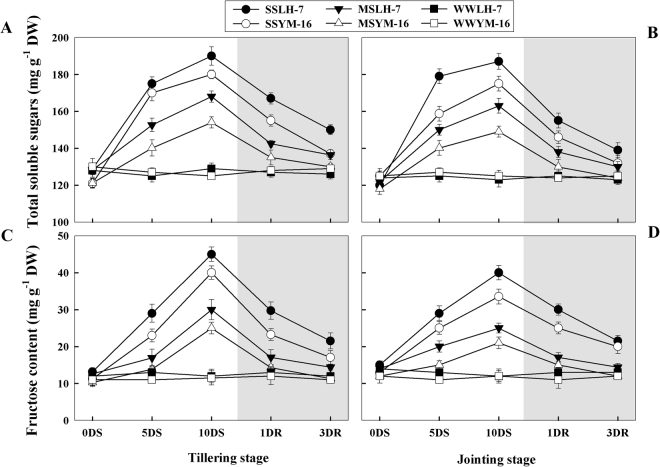
Defining the metabolic strategies used by wheat to tolerate and recover from drought events will be important for ensuring yield stability in the future, but studies addressing this critical research topic are limited. To this end, the current study quantified the physiological, biochemical, and agronomic responses of a drought tolerant and drought sensitive cultivar to periods of water deficit and recovery. Drought stress caused a reversible decline in leaf water relations, membrane stability, and photosynthetic activity, leading to increased reactive oxygen species (ROS) generation, lipid peroxidation and membrane injury. Plants exhibited osmotic adjustment through the accumulation of soluble sugars, proline, and free amino acids and increased enzymatic and non-enzymatic antioxidant activities. After re-watering, leaf water potential, membrane stability, photosynthetic processes, ROS generation, anti-oxidative activities, lipid peroxidation, and osmotic potential completely recovered for moderately stressed plants and did not fully recover in severely stressed plants. Higher photosynthetic rates during drought and rapid recovery after re-watering produced less-pronounced yield declines in the tolerant cultivar than the sensitive cultivar. These results suggested that the plant's ability to maintain functions during drought and to rapidly recover after re-watering during vegetative periods are important for determining final productivity in wheat.
Conflict of interest statement
The authors declare no competing interests.
Figures
Similar articles
-
Improved tolerance to post-anthesis drought stress by pre-drought priming at vegetative stages in drought-tolerant and -sensitive wheat cultivars.Plant Physiol Biochem. 2016 Sep;106:218-27. doi: 10.1016/j.plaphy.2016.05.003. Epub 2016 May 5. Plant Physiol Biochem. 2016. PMID: 27179928
-
Exogenous salicylic acid-induced drought stress tolerance in wheat (Triticum aestivum L.) grown under hydroponic culture.PLoS One. 2021 Dec 20;16(12):e0260556. doi: 10.1371/journal.pone.0260556. eCollection 2021. PLoS One. 2021. Retraction in: PLoS One. 2023 Apr 19;18(4):e0284669. doi: 10.1371/journal.pone.0284669. PMID: 34928959 Free PMC article. Retracted.
-
Rapid recovery of photosynthetic rate following soil water deficit and re-watering in cotton plants (Gossypium herbaceum L.) is related to the stability of the photosystems.J Plant Physiol. 2016 May 1;194:23-34. doi: 10.1016/j.jplph.2016.01.016. Epub 2016 Feb 26. J Plant Physiol. 2016. PMID: 26948982
-
Osmoregulation and its actions during the drought stress in plants.Physiol Plant. 2021 Jun;172(2):1321-1335. doi: 10.1111/ppl.13297. Epub 2020 Dec 18. Physiol Plant. 2021. PMID: 33280137 Review.
-
The roles of reactive oxygen metabolism in drought: not so cut and dried.Plant Physiol. 2014 Apr;164(4):1636-48. doi: 10.1104/pp.113.233478. Epub 2014 Mar 7. Plant Physiol. 2014. PMID: 24715539 Free PMC article. Review.
Cited by
-
Genetic and morpho-physiological analyses of the tolerance and recovery mechanisms in seedling stage spring wheat under drought stress.Front Genet. 2022 Oct 11;13:1010272. doi: 10.3389/fgene.2022.1010272. eCollection 2022. Front Genet. 2022. PMID: 36303538 Free PMC article.
-
Foliar brassinosteroid analogue (DI-31) sprays increase drought tolerance by improving plant growth and photosynthetic efficiency in lulo plants.Heliyon. 2022 Feb 19;8(2):e08977. doi: 10.1016/j.heliyon.2022.e08977. eCollection 2022 Feb. Heliyon. 2022. PMID: 35243095 Free PMC article.
-
The Developmental Delay of Seedlings With Cotyledons Only Confers Stress Tolerance to Suaeda aralocaspica (Chenopodiaceae) by Unique Performance on Morphology, Physiology, and Gene Expression.Front Plant Sci. 2022 Jun 6;13:844430. doi: 10.3389/fpls.2022.844430. eCollection 2022. Front Plant Sci. 2022. PMID: 35734249 Free PMC article.
-
Plant growth promoters mediated quality and yield attributes of milk thistle (Silybum marianum L.) ecotypes under salinity stress.Sci Rep. 2021 Dec 1;11(1):23200. doi: 10.1038/s41598-021-02435-4. Sci Rep. 2021. PMID: 34853350 Free PMC article.
-
Seed Priming: A Feasible Strategy to Enhance Drought Tolerance in Crop Plants.Int J Mol Sci. 2020 Nov 4;21(21):8258. doi: 10.3390/ijms21218258. Int J Mol Sci. 2020. PMID: 33158156 Free PMC article. Review.
References
-
- Han H, Tian Z, Fan Y, Cui Y, Cai J. Water-deficit treatment followed by re-watering stimulates seminal root growth associated with hormone balance and photosynthesis in wheat (Triticum aestivum L.) seedlings. Plant Growth Regul. 2015;77:201–210. doi: 10.1007/s10725-015-0053-y. - DOI
Publication types
MeSH terms
Substances
LinkOut - more resources
Full Text Sources
Other Literature Sources
