. 2018 Mar 15;8(1):4655.
doi: 10.1038/s41598-018-23092-0.

Grass Carp Prolactin Gene: Structural Characterization and Signal Transduction for PACAP-induced Prolactin Promoter Activity

Affiliations

Grass Carp Prolactin Gene: Structural Characterization and Signal Transduction for PACAP-induced Prolactin Promoter Activity

Chengyuan Lin et al. Sci Rep. .

Abstract

In this study, structural analysis of grass carp prolactin (PRL) gene was performed and the signaling mechanisms for pituitary adenylate cyclase-activating peptide (PACAP) regulation of PRL promoter activity were investigated. In αT3-1 cells, PRL promoter activity could be induced by oPACAP38 which was blocked by PACAP antagonist but not the VIP antagonist. The stimulatory effect of oPACAP38 was mimicked by activation of AC/cAMP and voltage-sensitive Ca2+ channel (VSCC) signaling, or induction of Ca2+ entry. In parallel, PACAP-induced PRL promoter activity was negated or inhibited by suppressing cAMP production, inhibiting PKA activity, removal of extracellular Ca2+, VSCC blockade, calmodulin (CaM) antagonism, and inactivation of CaM kinase II. Similar sensitivity to L-type VSCC, CaM and CaM kinase II inhibition were also observed by substituting cAMP analog for oPACAP38 as the stimulant for PRL promoter activity. Moreover, PACAP-induced PRL promoter activity was also blocked by inhibition of PLC signaling, attenuation of [Ca2+]i immobilization via IP3 receptors, and blockade of PI3K/P70S6K pathway. The PACAP-induced PRL promoter activation may involve transactivation of the transcription factor CREB. These results suggest that PACAP can stimulate PRL promoter activation by PAC1 mediated functional coupling of the Ca2+/CaM/CaM kinase II cascades with the AC/cAMP/PKA pathway. Apparently, other signaling pathways, including PLC/IP3 and PI3K/P70S6K cascades, may also be involved in PACAP induction of PRL gene transcription.


Conflict of interest statement

The authors declare no competing interests.

Figures
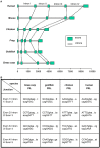
Figure 1
Figure 1
Genomic organization of PRL gene. (A) Comparison of the structures of vertebrate PRL genes. The grass carp PRL gene was aligned with that human, chicken, frog (xenopus) and goldfish homologous with respect to the ATG translation start codon at the 3′-end of exon 1. Boxes and lines represent exons and introns, respectively. The scale bar at the bottom represents the distance in kb with respect to the translation start codon ATG. (B) DNA sequences at the intron/exon junctions in different PRL genes. Exon sequences are shown in capital letters and the intron sequences are shown in lower case. The consensus intron splice donor and acceptor sequences are shown in italics.
Figure 2
Figure 2
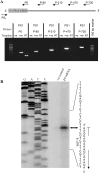
Mapping of the transcription start site (TSS) of PRL gene in grass carp. (A) Primer scanning to determine the region containing TSS. PCR amplification was performed to scan the possible region using downstream primer PS1 as the anchor primer combined with series upstream primers, respectively. In the PCR reactions, reverse transcribed cDNAs from carp pituitary total RNA were used as the template and parallel PCR with genomic DNA was used as the positive control. PCR with DDW as a template was used as the negative control (−ve). (B) Primer extension to identify the position of transcription start site. Total RNA (20 μg, lane 3) were prepared from steady-state incubated grass carp pituitary cells and hybridized with the [γ-32P] – labeled extension primer PE1. DNA sequencing ladder with PRL promoter (left lanes C, T, A, and G) was also performed to determine the position of reverse transcribed cDNAs. The primer extension samples together with sequencing ladders were size-fractionated with in an 8% polyacrylamide gel to identify the TSS.
Figure 3
Figure 3
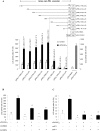
Deletion, mutagenesis and truncation analysis of PRL promoter activity in αT3-1 cells. (A) Deletion analysis of the oPACAP38-induced PRL promoter activity. The upper panel is the schematic diagram for pPRL.Luc deletion constructs with decreasing lengths of PRL promoter from position −1156 bp to −57 bp. The lower panel depicts PACAP effect on the luciferase activity of PRL promoter with serial deletions in the 5′ end. (B) Mutagenesis and truncation analysis on the role of C/EBPalpha (located at −226 to −217 of pPRL(−306)) in oPACAP38-induced PRL promoter activity. (C) Mutagenesis and truncation analysis on the role of AP1 (located at −136 to −130 of pPRL(−166))in oPACAP38-induced PRL promoter activity. (Mutation construct for C/EBPα: mC/EBPα; mutation construct for mAP-1: mAP-1; truncation construct for C/EBPα: ΔC/EBPα; truncation construct for AP-1: ΔAP-1) After transfection with the deletion/mutation/truncation constructs of PRL promoter, αT3-1 cells were challenged with PACAP (10 nM) for 24 hrs. Parallel transfections with the promoterless pGL3.Basic and pGL3.Control carrying a pSV40 promoter were also conducted as the negative and positive control, respectively. Data of relative firefly luciferase expression (mean ± SEM) (n = 4) are presented with percentage of control by conversing the ratio of firefly and renilla luciferase. For deletion analysis, the significant increase in luciferase activity expression with respect to the corresponding control is denoted by an asterisk (P < 0.05, Student’s t Test). Significant difference p < 0.05 (ANOVA followed by Fisher’s LSD Test) between the basal level of each deletion construct is denoted by different letters. For the mutagenesis and truncation analysis, different letters denote a significant difference at p < 0.05 (ANOVA followed by Fisher’s LSD Test).
Figure 4
Figure 4
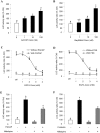
Receptor specificity of PACAP-induced PRL promoter activity in αT3-1 Cells. αT3-1 cells were transiently transfected with pPRL(−1156).LUC for 6 h by using lipofectamine. The cells were then cultured for 18 hr recovery before drug treatment. (A) Time course analysis on the effect of oPACAP38 (6–48 hrs) on grass carp PRL promoter activity in αT3-1 cells. (B) αT3-1 cells over-expressed pPRL(−1156).LUC were treated for 24 hrs with increasing doses of oPACAP38. Effects of PACAP and VIP antagonists on PACAP-induced PRL mRNA expression were also investigated. In these experiments, αT3-1 cells over-expressed pPRL(−1156).LUC were challenged with oPACAP38 (10 nM, 24 hr) in the presence or absence of (C) the PACAP antagonist PACAP6-38 (10 nM) or (D) VIP antagonist (4-Cl-D-Phe6, Leu17)VIP (“VIP-R antagonist”, 100 nM). After drug treatment, cell lysate was prepared for dual-luciferase measurement. Data presented were expressed as percentage of control by conversing the ratio of firefly and renilla luciferase in the same sample. Data presented are expressed as mean ± SEM (n = 4) and different letters denote a significant difference at p < 0.05 (ANOVA followed by Fisher’s LSD Test).
Figure 5
Figure 5
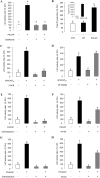
Functional role of cAMP/PKA pathway in PACAP stimulation of PRL promoter activity in αT3-1 Cells. αT3-1 cells were transiently transfected with pPRL(−1156).LUC for 6 h by using lipofectamine. After 18 h recovery, the cells were incubated with respective drugs. (A) αT3-1 cells over-expressed pPRL(−1156).LUC were treated for 24 hrs with increasing doses of cpt-cAMP (1–100 μM). (B) αT3-1 cells over-expressed pPRL(−1156).LUC were treated for 24 hrs with increasing doses of Forskolin (10–1000 nM). Effects of cAMP/PKA inhibitors on PACAP-induced PRL mRNA expression were then investigated. αT3-1 cells over-expressed pPRL(−1156).LUC were challenged with oPACAP38 (10 nM, 24 hr) in the presence or absence of (C) AC inhibitor MDL12330A (10 μM) or (D) PKA blocker H89 (10 μM). After drug treatment, cell lysate was prepared for dual-luciferase measurement. Data presented were expressed as percentage of control by conversing the ratio of firefly and renilla luciferase in the same sample. Data presented are expressed as mean ± SEM (n = 4) and different letters denote a significant difference at p < 0.05 (ANOVA followed by Fisher’s LSD Test).
Figure 6
Figure 6
Ca2+-dependent of PACAP- and Forskolin-induced PRL promoter activity in αT3-1 Cells. αT3-1 cells were transiently transfected with pPRL(−1156).LUC for 6 h by using lipofectamine. After 18 h recovery, the cells were incubated with respective drugs. The cells were treated for 24 hr with increasing doses of (A) Ca2+ ionophore A23187 or (B) L-type VSCC activator Bay K8644. Inhibiting extracellular Ca2+ entry on PRL mRNA expression in carp pituitary cells was examined. In this study, αT3-1 cells over-expressed pPRL(−1156).LUC were treated with (C) oPACAP38 (10 nM, 24 hrs) or (D) Forskolin (100 nM, 24 hrs) in the Ca2+-free medium (with different doses of EGTA). Further, αT3-1 cells over-expressed pPRL(−1156).LUC were treated with (E) oPACAP38 (10 nM, 24 hrs) or (F) Forskolin (100 nM, 24 hrs) in the presence or absence of L-type VSCC blocker nifedipine (10 μM). After drug treatment, cell lysate was prepared for dual-luciferase measurement. Data presented were expressed as percentage of control by conversing the ratio of firefly and renilla luciferase in the same sample. Data presented are expressed as mean ± SEM (n = 4) and different letters denote a significant difference at p < 0.05 (ANOVA followed by Fisher’s LSD Test).
Figure 7
Figure 7
Functional role of the PLC/IP3/PKC and CaM/CaMK-II cascades in PACAP- and Forskolin-induced PRL promoter activity. αT3-1 cells were transiently transfected with pPRL(−1156).LUC for 6 h by using lipofectamine. After 18 h recovery, the cells were incubated with respective drugs. (A) αT3-1 cells over-expressed pPRL(−1156).LUC were treated with oPACAP38 (10 nM, 24 hrs) in the presence or absence of PLC inhibitor Edelfosine (20 μM). (B) Transfected αT3-1 cells were labeled with 2 μCi/well of myo-[3 H] inositol (DuPont/NEN) in myo-inositol free DMEM medium containing 10% fetal bovine serum and then treated with oPACAP38, VIP, and GnRH for 45 mins. The total IP production were analyzed by detecting the radio-labelled inositol incorporation. Then, αT3-1 cells over-expressed pPRL(−1156).LUC were treated with oPACAP38 (10 nM, 24 hrs) in the presence or absence of (C) IP3 receptor inhibitor 2-APB (100 μM), (D) PKC inhibitor GF109203 (1 μM), (E) CaM antagonist calmidazolium (1 μM) and (F) CaM KinaseII inhibitor KN62 (5 μM). In parallel, the transfected cells were challenged with Forskolin (100 nM, 24 hrs) in the presence or absence of CaM antagonist calmidazolium (G, 1 μM) and CaM KinaseII inhibitor KN62 (H, 5 μM). After drug treatment, cell lysate was prepared for dual-luciferase measurement. Data presented were expressed as percentage of control by conversing the ratio of firefly and renilla luciferase in the same sample. Data presented are expressed as mean ± SEM (n = 4) and different letters denote a significant difference at p < 0.05 (ANOVA followed by Fisher’s LSD Test).
Figure 8
Figure 8
Functional role of MAPK cascades and PI3K/Akt/P70S6K pathway in PACAP-induced PRL promoter activity. αT3-1 cells were transiently transfected with pPRL(−1156).LUC for 6 h by using lipofectamine. After 18 h recovery, the cells were incubated with respective drugs. In this study, αT3-1 cells over-expressed pPRL(−1156).LUC were treated with oPACAP38 (10 nM, 24 hrs) in the presence or absence of (A) ERK1/2 inhibitor U0126 (10 μM), (B) p38MAPK inhibitor PD169316 (10 μM), (C) JNK inhibitor SP600125 (10 μM), (D) PI3K inhibitor Wortmannin (10 nM), (E) P70S6K inhibitor rapamycin (20 nM) and (F) Akt inhibitor API-2 (10 uM). After drug treatment, cell lysate was prepared for dual-luciferase measurement. Data presented were expressed as percentage of control by conversing the ratio of firefly and renilla luciferase in the same sample. Data presented are expressed as mean ± SEM (n = 4) and different letters denote a significant difference at p < 0.05 (ANOVA followed by Fisher’s LSD Test).
Figure 9
Figure 9
Functional role of CREB in PACAP-induced PRL promoter activity. (A) Effect of oPACAP38 on CREB phosphorylation and total production in grass carp pituitary cells. Pituitary cells were treated with oPACAP38 with the indicated doses or Forskolin (1 μM) for 24 hrs. After drug treatment, cell lysate was harvested for Western blot analysis on pCREB and tCREB. β-actin was blotted as internal control. (B) Statistical charts of the western blot results quantified by Image J software. (C) αT3-1 cells were co-transfected with pPRL(−1156).LUC and increasing doses of grass carp CREB expression vector CREB-pcDNA3.1 for 24 hrs. (D) αT3-1 cells transfected with pPRL(−1156).LUC were treated by oPACAP38 (10 nM, 24 hrs) in the presence or absence of CREB-pcDNA3.1 over-expression. (E) αT3-1 cells transfected with pPRL(−1156).LUC were treated by oPACAP38 (10 nM, 24 hrs) in the presence or absence of siRNA for CREB or siRNA control. (F) αT3-1 cells transfected with pPRL(−1156).LUC were treated by oPACAP38 (10 nM, 24 hrs) in the presence or absence of dominant negative CREB mutant kCREB overexpression. For transfection experiments, after drug treatment, cell lysate was prepared for dual-luciferase measurement. Data presented were expressed as percentage of control by conversing the ratio of firefly and renilla luciferase in the same sample. Data presented are expressed as mean ± SEM (n = 4) and different letters denote a significant difference at p < 0.05 (ANOVA followed by Fisher’s LSD Test).
Figure 10
Figure 10
Summary of the signaling pathways involved in PACAP stimulation of PRL promoter activity in αT3-1 Cells via PAC1 receptor. In αT3-1 cells, PACAP stimulate PRL promoter activity through PAC1 receptor. PACAP induction of grass carp promoter activity was mediated by AC/cAMP/PKA pathway, with a crosstalk to the CaM/CaM K-II cascade via VSCC activation and [Ca2+]e entry. Intracellular Ca2+ release followed by PLC/IP3 activation also mediates the regulation of CaM/CaM K-II on PRL gene transcription. Moreover, PI3K/Akt and p70S6K signaling was involved in the post-receptor signaling of PACAP induction of PRL gene transcription. These signaling cascades triggered by PACAP stimulation could induce PRL promoter activation via the transcription factor CREB.

Similar articles

Cited by

References

    1. Kawauchi H, Sower SA. The dawn and evolution of hormones in the adenohypophysis. Gen Comp Endocrinol. 2006;148:3–14. doi: 10.1016/j.ygcen.2005.10.011. - DOI - PubMed
    1. Liu, J. C., Baker, R. E., Chow, W., Sun, C. K. & Elsholtz, H. P. Epigenetic mechanisms in the dopamine D2 receptor-dependent inhibition of the prolactin gene. Mol Endocrinol19, 1904–1917, doi:10.1210/me.2004-0111 (2005). - PubMed
    1. Yan GZ, Pan WT, Bancroft C. Thyrotropin-releasing hormone action on the prolactin promoter is mediated by the POU protein pit-1. Mol Endocrinol. 1991;5:535–541. doi: 10.1210/mend-5-4-535. - DOI - PubMed
    1. Adamson AD, et al. Human prolactin gene promoter regulation by estrogen: convergence with tumor necrosis factor-alpha signaling. Endocrinology. 2008;149:687–694. doi: 10.1210/en.2007-1066. - DOI - PMC - PubMed
    1. Duan R, Ginsburg E, Vonderhaar BK. Estrogen stimulates transcription from the human prolactin distal promoter through AP1 and estrogen responsive elements in T47D human breast cancer cells. Mol Cell Endocrinol. 2008;281:9–18. doi: 10.1016/j.mce.2007.10.004. - DOI - PubMed

Publication types

MeSH terms

Substances