. 2018 Mar 15;8(1):4619.
doi: 10.1038/s41598-018-22620-2.

Antiviral Effect of Ribavirin against HCV Associated with Increased Frequency of G-to-A and C-to-U Transitions in Infectious Cell Culture Model

Affiliations

Antiviral Effect of Ribavirin against HCV Associated with Increased Frequency of G-to-A and C-to-U Transitions in Infectious Cell Culture Model

Andrea Galli et al. Sci Rep. .

Abstract

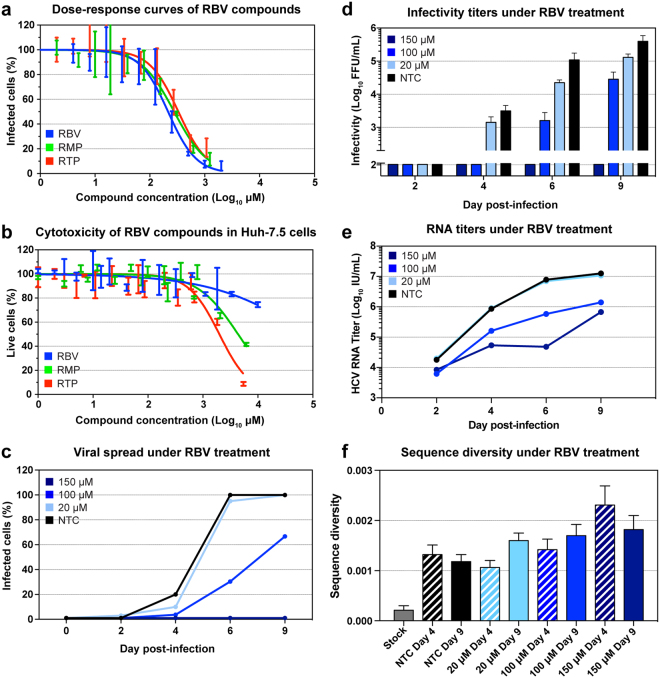
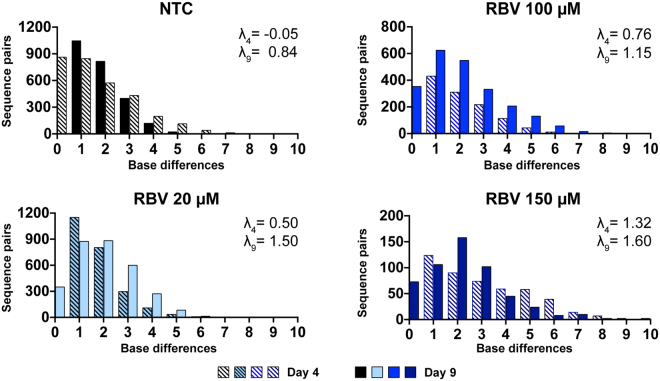
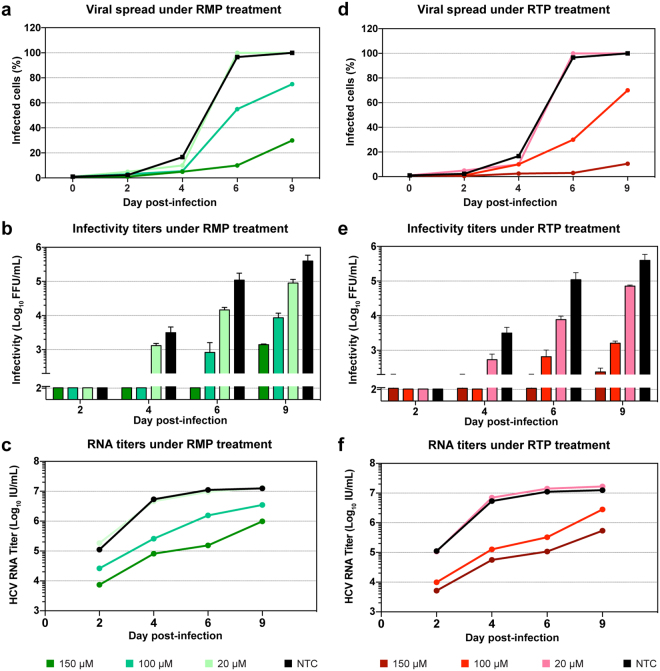
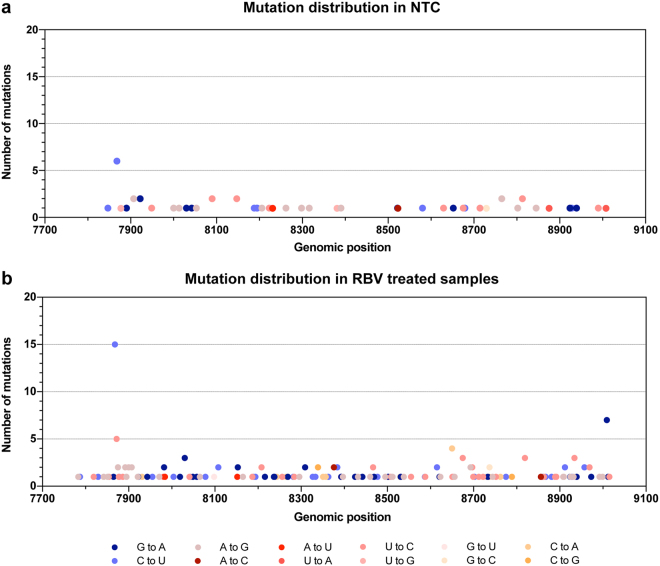
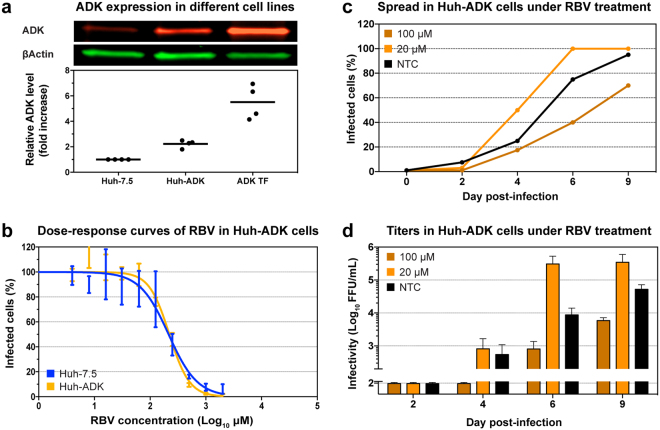
Ribavirin (RBV) is a broad-spectrum antiviral active against a wide range of RNA viruses. Despite having been used for decades in the treatment of chronic hepatitis C virus (HCV) infection, the precise mechanism of action of RBV is unknown. In other viruses, it inhibits propagation by increasing the rate of G-to-A and C-to-U transitions. Here, we utilized the J6/JFH1 HCV cell-culture system to investigate whether RBV inhibits HCV through the same mechanism. Infected Huh7.5 cells were treated with increasing concentrations of RBV or its phosphorylated forms. A fragment of the HCV NS5B-polymerase gene was amplified, cloned, and sequenced to estimate genetic distances. We confirm that the antiviral effect of all three RBV-drug forms on HCV relies on induction of specific transitions (G-to-A and C-to-U). These mutations lead to generation of non-infectious virions, reflected by decreased spread of HCV in cell culture despite relatively limited effect on virus genome titers. Moreover, treatment experiments conducted on a novel Huh7.5 cell line stably overexpressing adenosine kinase, a key enzyme for RBV activation, yielded comparable results. This study indicates that RBV action on HCV in hepatoma cell-culture is exerted through increase in mutagenesis, mediated by RBV triphosphate, and leading to production of non-infectious viruses.


Conflict of interest statement

The authors declare no competing interests.

Figures

Figure 1
Figure 1
Ribavirin treatment of Huh7.5 cells infected with HCV J6/JFH1. (a) Dose-response curves of RBV, RMP and RTP in J6/JFH1 infected cells estimated by immunostaining of NS5A, obtained with triplicate determinations for each drug dilution. Data was normalized to non-treated controls, and curve fitting was thus performed with 0%-100% constraints. Error bars indicate standard deviation (SD). (b) Cell viability assay performed on Huh7.5 cells treated with RBV, RMP, and RTP. All data points were determined in triplicate; error bars indicate SD. (cf) Panels representing data from one of two sets of independent experiments (for the second set of experiments see Supplementary Fig. 1). (c) Infection spread of J6/JFH1 virus estimated by immunostaining of NS5A in treated and non-treated samples. Data points represent the average of 1–3 determinations. (d) Viral infectivity of filtered supernatants obtained from treated and non-treated samples, data points represent the average of at least 3 determinations, error bars represent SD. (e) HCV RNA titers of viruses recovered from supernatants of treated and non-treated samples; data points represent averages of at least 2 measurements. (f) Nucleotide diversity of genomes extracted from stock virus and supernatants from RBV treated and non-treated samples, calculated as average p-distance. This distance is the average proportion of different nucleotides between sequence pairs. Sample sizes for each sample are found in Table 1. Banded bars indicate samples from day 4. Error bars represent standard deviations (SD).
Figure 2
Figure 2
Hamming distances in HCV sequences obtained from supernatants of RBV treated and non-treated J6/JFH1 cell cultures. Graphs show the distribution of number of base differences per sequence pairs, at day 4 (banded bars) and day 9 (solid bars) for each sample. Colors represent different RBV dilutions matched to the values in Fig. 1. The shown lambda values were calculated by fitting the datasets to a Poisson distribution. Sample sizes for each sample are found in Table 1.
Figure 3
Figure 3
Treatment of HCV J6/JFH1 infected Huh-7.5 cells with RMP and RTP. Representative charts depicting one of two sets of independent experiments (for the second set of experiments see Supplementary Fig. 1). (a and d) Infection spread of J6/JFH1 virus estimated by immunostaining of NS5A in samples treated with RMP and RTP, respectively. Data points express average of 1–3 determinations. (b and e) Viral infectivity of filtered supernatants obtained from samples treated with RMP and RTP, respectively. Data points represent average of at least 3 determinations, error bars indicate SD. (c and f) HCV RNA titers of viral supernatants from treated and non-treated samples, data points represent averages of at least 2 measurements. The colors explanation is visible at the bottom of the figure.
Figure 4
Figure 4
Mutations frequencies in unique HCV sequences obtained from supernatants of treated and non-treated J6/JFH1 cell cultures. All nucleotide substitutions identified in unique sequences were scored and normalized to the number of each nucleotide in the baseline reference sequence. (a) Mutation frequencies from day 9 samples treated with RBV. (b) Mutation frequencies from day 9 samples treated with RMP. (c) Mutation frequencies from day 9 samples treated with RTP. Drug concentrations are indicated by color legends in each panel. Bars represent overall frequencies calculated from unique sequences. Sample sizes: n = 37 (NTC); n = 115 (RBV); n = 76 (RMP), n = 61 (RTP).
Figure 5
Figure 5
Location of nucleotide substitutions along the analyzed HCV NS5B region of J6/JFH1 in RBV treated and non-treated samples. The graphs depict the position and frequency of each substitution identified in (a) NTC (n = 78) and (b) RBV-treated samples (n = 177). Colors define the kind of substitution, with blue tones representing RBV-associated mutations and red tones representing other mutations. Positions are relative to H77 reference HCV genome (Accession number: AF009606).
Figure 6
Figure 6
Efficacy of RBV against HCV J6/JFH1 in Huh-ADK cells. (a) Fluorescent western blot analysis of the expression of ADK in different cell lines. The red and green pictures display a representative western blot of ADK and βActin stained simultaneously with different antibodies. The chart depicts normalized quantification of ADK expression, relative to Huh7.5 stock cell line. Lines represent the mean value of 4 independent quantifications. Huh-ADK: stably expressing ADK; ADK-TF: Huh7.5 transiently transfected with ADK expression plasmid. See Supplementary Fig. 3 for the full-length blots. (b) Dose-response curves of RBV performed in Huh7.5 and Huh-ADK cells. Values were obtained from triplicate determinations for each dilution and normalized to non-treated controls. Curve fitting was performed with 0%-100% constraints, error bars represent SD. (c,d) Representative graph from one of two sets of independent experiments on Huh-ADK cells (for the second set of experiments see Supplementary Fig. 1). (c) Infection spread of HCV J6/JFH1 virus under RBV treatment, monitored by immunostaining of NS5A. Data points represent average of 2 determinations. (d) Viral infectivity of filtered supernatants obtained from infected Huh-ADK cells treated with RBV. Data points represent average of 2 determinations, error bars represent SD.

References

    1. Pawlotsky JM, et al. Antiviral action of ribavirin in chronic hepatitis C. Gastroenterology. 2004;126:703–714. doi: 10.1053/j.gastro.2003.12.002. - DOI - PubMed
    1. Hoofnagle JH, Seeff LB. Peginterferon and ribavirin for chronic hepatitis C. N Engl J Med. 2006;355:2444–2451. doi: 10.1056/NEJMct061675. - DOI - PubMed
    1. Pawlotsky JM. New hepatitis C therapies: the toolbox, strategies, and challenges. Gastroenterology. 2014;146:1176–1192. doi: 10.1053/j.gastro.2014.03.003. - DOI - PubMed
    1. AASLD-IDSA. HCV Guidance: Recommendations for Testing, Managing, and Treating Hepatitis C, http://www.hcvguidelines.org (2018). - PubMed
    1. EASL Recommendations on Treatment of Hepatitis C 2016. J Hepatol66, 153–194, 10.1016/j.jhep.2016.09.001 (2016). - PubMed

Publication types

LinkOut - more resources