. 2018 Mar 15;8(1):4649.
doi: 10.1038/s41598-018-22867-9.

Intravenous C16 and angiopoietin-1 improve the efficacy of placenta-derived mesenchymal stem cell therapy for EAE

Affiliations

Intravenous C16 and angiopoietin-1 improve the efficacy of placenta-derived mesenchymal stem cell therapy for EAE

Ke-Wei Tian et al. Sci Rep. .

Erratum in

Abstract

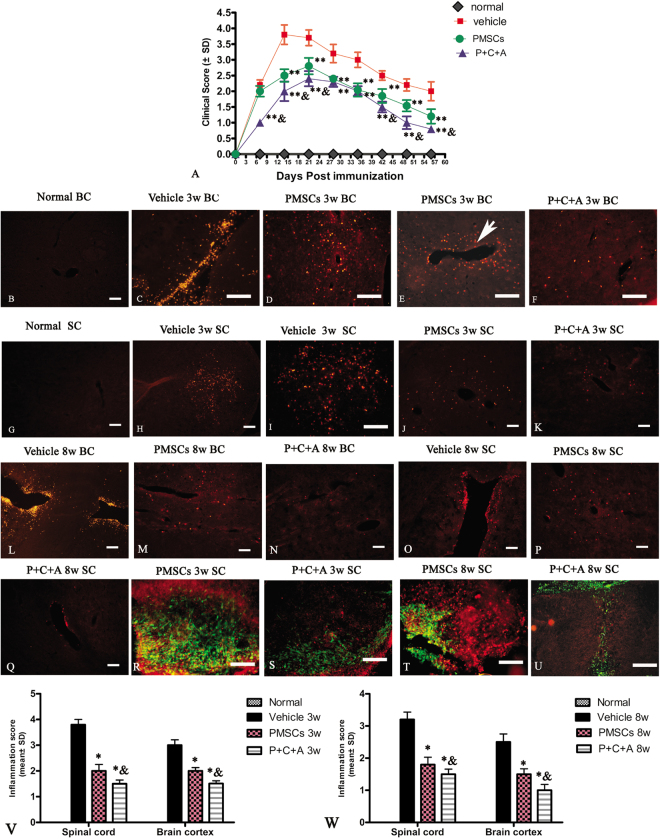
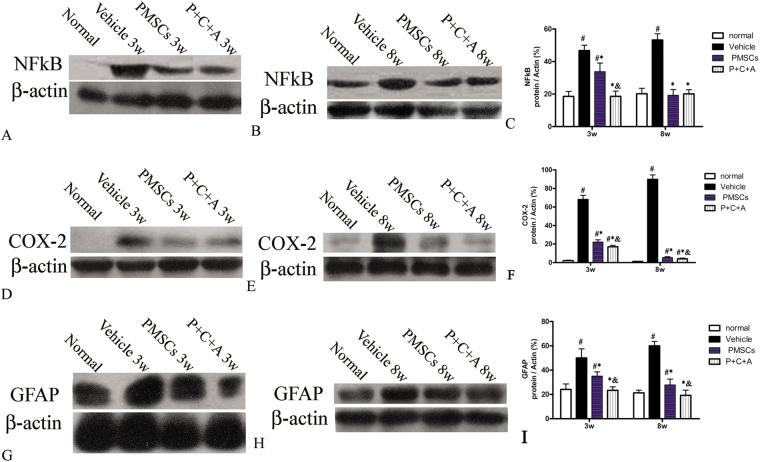
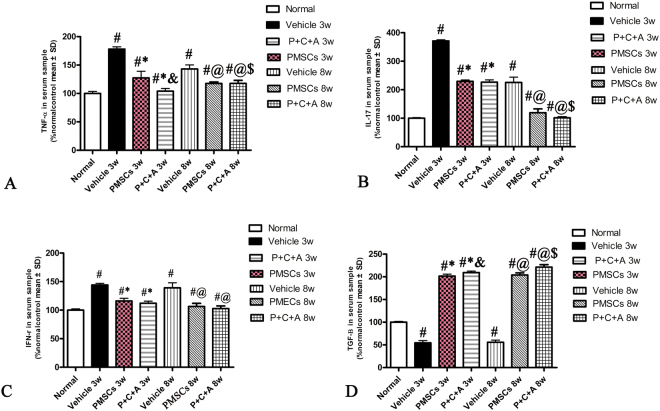
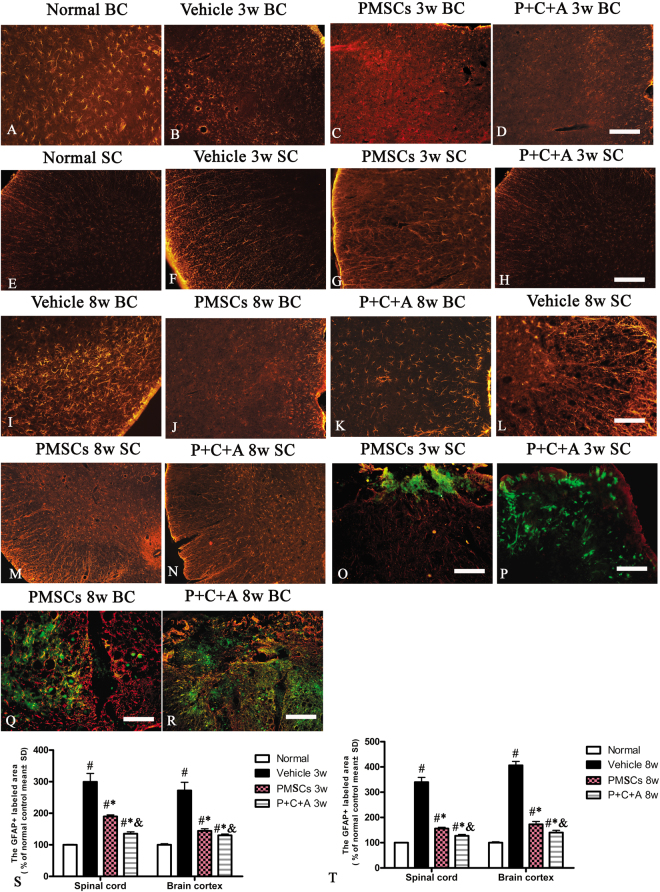
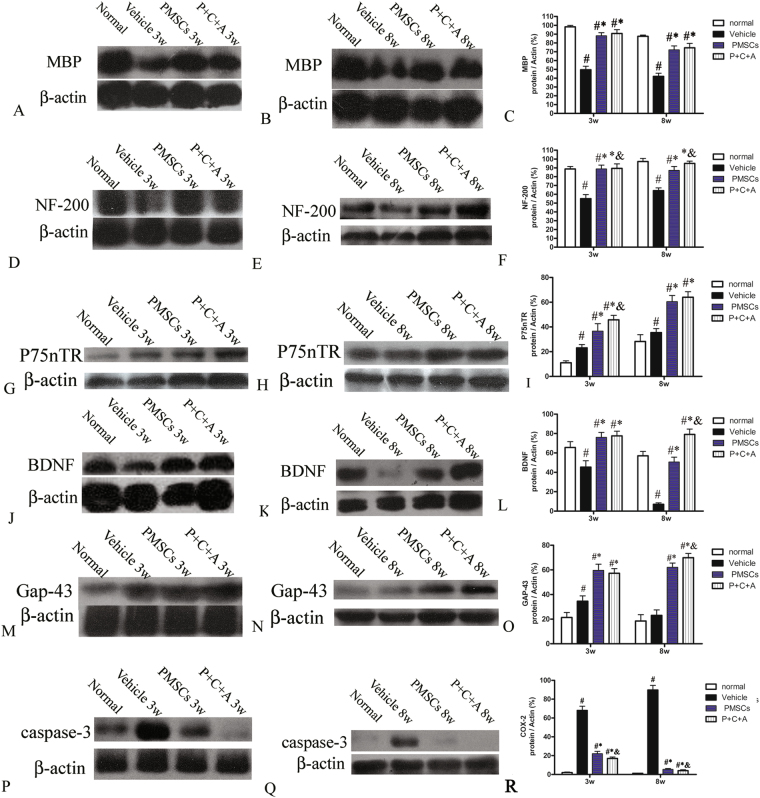
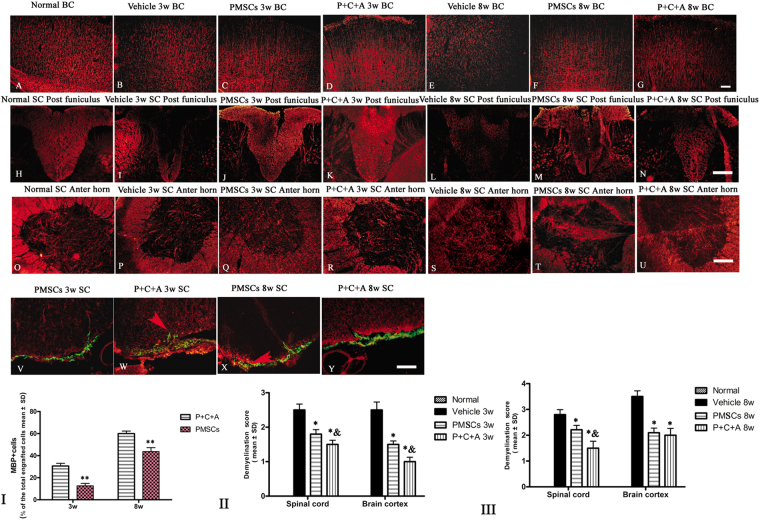
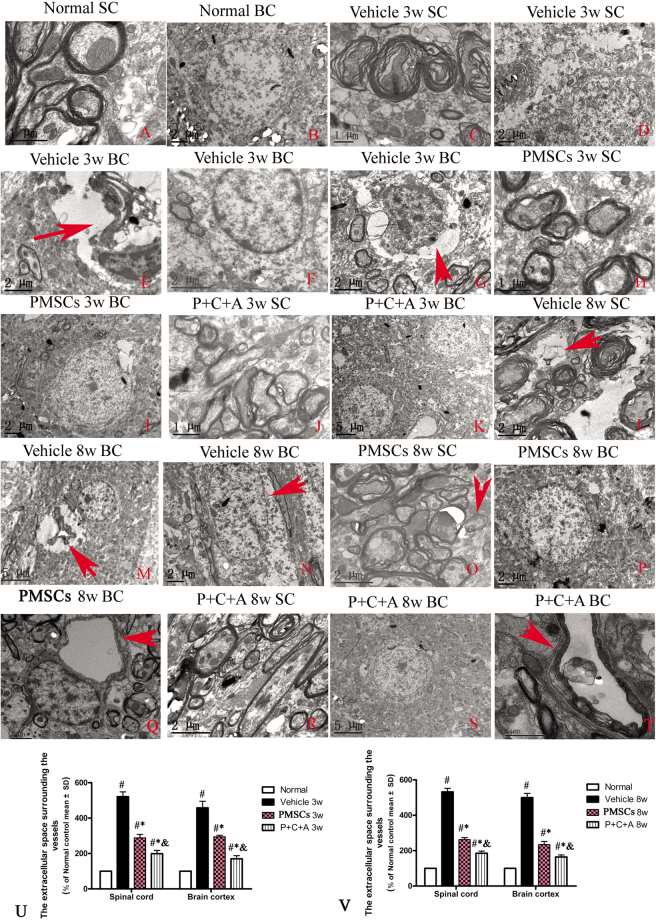
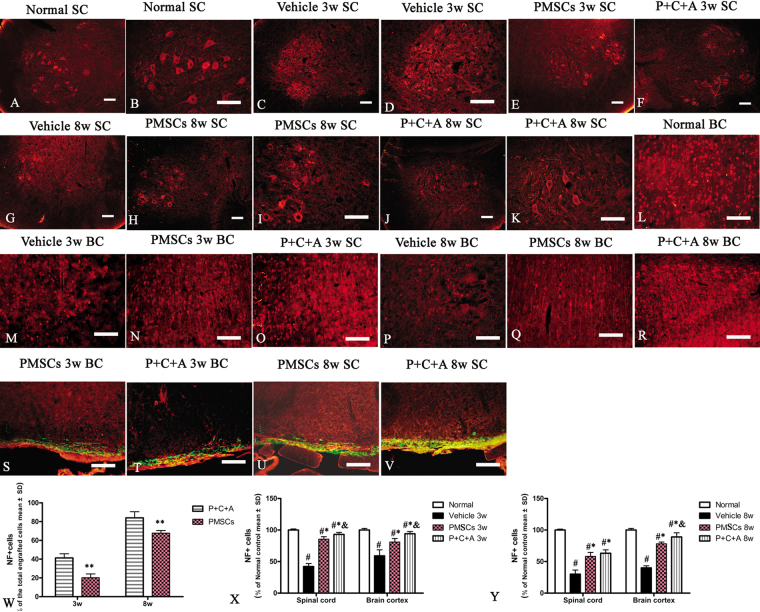
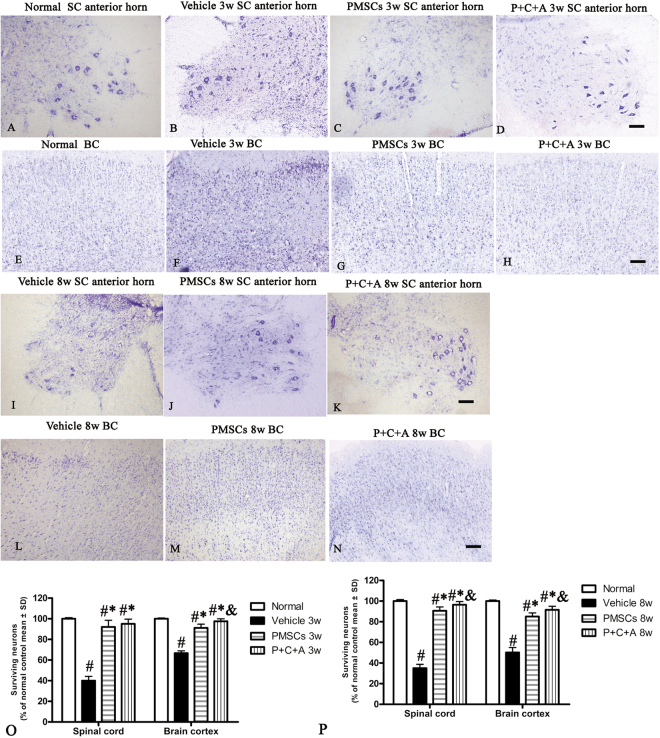
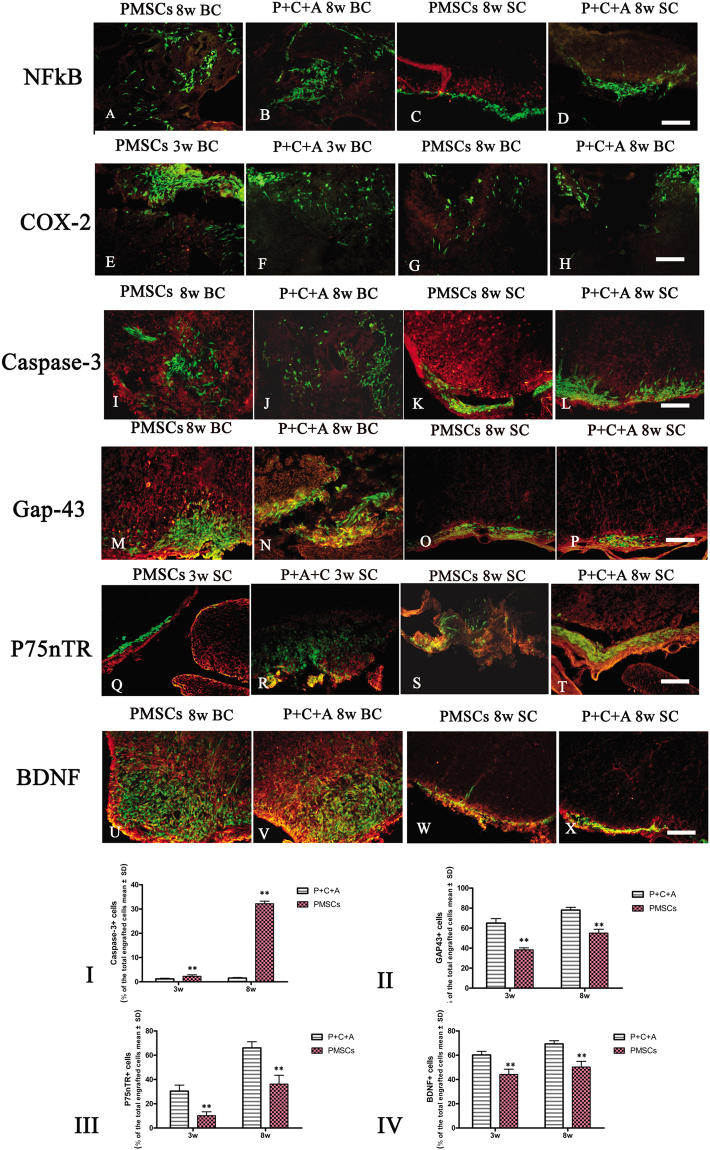
The placenta has emerged as an attractive source of mesenchymal stem cells (MSCs) because of the absence of ethical issues, non-invasive access, and abundant yield. However, inflammatory cell invasion into grafts negatively impacts the survival and efficacy of transplanted cells. Previous studies have shown that synthetic C16 peptide can competitively block the transmigration of leukocytes into the central nerve system, while angiopoietin-1 (Ang-1) can inhibit inflammation-induced blood vessel leakage and inflammatory cell infiltration in rats with experimental allergic encephalomyelitis (EAE). In this study, we investigated the effects of intravenous administration of C16 and Ang-1 on the efficacy of placenta-derived MSC (PMSC) transplantation in a rat model of EAE. We found that, compared with PMSCs alone, treatment with PMSCs along with intravenously administered C16 and Ang-1 was more effective at ameliorating demyelination/neuronal loss and neurological dysfunction, reducing inflammatory cell infiltration, perivascular edema, and reactive astrogliosis (p < 0.05). Mechanistic studies revealed that intravenous C16 and Ang-1 increased PMSC engraftment in the central nervous system and promoted expression of the neurotropic proteins brain-derived neurotrophic factor, growth-associated protein 43, and p75 neurotrophin receptor as well as the neuronal-glial lineage markers neurofilament protein 200 and myelin basic protein in the engrafted PMSCs.


Conflict of interest statement

The authors declare no competing interests.

Figures

Figure 1
Figure 1
Intravenous C16 and Ang-1 enhanced the efficacy of PMSC therapy for reducing inflammatory cell infiltration and disease progression in the rat EAE model. (A) Clinical scoring of the severity of EAE symptoms post-injection (pi). n = 10, **P < 0.01 vs. vehicle (PMSCs vs. vehicle: 1 week pi, ES = 1.18, P = 0.28; 2 weeks pi, ES = 8.98, P < 0.0001; 3 weeks pi, ES = 6.72, P = 0.0003; 4 weeks pi, ES = 8.03, P = 0.00023; 5 weeks pi, ES = 9.27, P < 0.0001; 6 weeks pi, ES = 8.87, P = 0.000332; 7 weeks pi, ES = 9.9, P = 0.0002; 8 weeks pi, ES = 5.12, P = 0.00097. P + C + A vs. vehicle: 1 week pi, ES = 24.75, P < 0.0001; 2 weeks pi, ES = 9.067, P < 0.0001; 3 weeks pi, ES = 10.84, P < 0.0001; 4 weeks pi, ES = 18.11, P = 0.00015; 5 weeks pi, ES = 11.93, P < 0.0001; 6 weeks pi, ES = 18.7, P < 0.0001; 7 weeks pi, ES = 15.61, P < 0.0001; 8 weeks pi, ES = 10.66, P = 0.000262), &P < 0.05 vs. PMSCs (1 week pi, ES = 24.75, P < 0.0001; 2 weeks pi, ES = 3.2, P = 0.013; 3 weeks pi, ES = 3.36, P = 0.014; 4 weeks pi, ES = 2.45, P = 0.15; 5 weeks pi, ES = 0.39, P = 0.42; 6 weeks pi, ES = 4.65, P = 0.0099; 7 weeks pi, ES = 7.39, P = 0.0001; 8 weeks pi, ES = 5.61, P = 0.0061). (BQ) Representative immunofluorescence staining images showing infiltration of macrophages (CD68+) into the brain cortex and spinal cord of rats at 3 and 8 weeks pi. SC denotes transverse sections through the anterior horn of the lumbar spine, and BC denotes coronal sections of the motor cortex. Scale bar = 100 μm. (V,W) Scoring of the severity of inflammatory cell infiltration at 3 (V) and 8 weeks (W) pi. n = 5, *P < 0.05 vs. vehicle (PMSCs vs. vehicle at 3 weeks pi: ES = 17.87, P < 0.0001 in SC; ES = 17.15, P < 0.0001 in BC. P + C + A vs. vehicle at 3 weeks pi: E = 36.46, P < 0.0001 in SC; ES = 28.15, P < 0.0001 in BC. PMSCs vs. vehicle at 8 weeks pi: ES = 14.31, P < 0.0001 in SC; ES = 10.72, P < 0.0001 in BC. P + C + A vs. vehicle at 8 weeks pi: ES = 21.84, P < 0.0001 in SC; ES = 15.88, P < 0.0001 in BC), &P < 0.05 vs. PMSCs (3 weeks pi in SC, ES = 5.82, P = 0.0028; 3 weeks pi in BC, ES = 17.98, P < 0.0001; 8 weeks pi in SC, ES = 4.34, P = 0.017; 8 weeks pi in BC, ES = 8.87, P = 0.00058).
Figure 2
Figure 2
Intravenous C16 and Ang-1 enhanced the anti-inflammatory and anti-astrogliosis effects of PMSCs in the brain cortex of rats with EAE. Levels of NF-κB (AC), COX-2 (DF) and GFAP (GI) in the brain cortex at 3 and 8 weeks pi were determined by western blotting. n = 5, #P < 0.05 vs. normal, *P < 0.05 vs. vehicle, &P < 0.05 vs. PMSCs. (C) At 3 weeks pi, PMSCs vs. vehicle: ES = 0.33, P = 0.0008; P + C + A vs. vehicle: ES = 1.34, P = 0.0003; P + C + A vs. PMSCs: ES = 0.4, P = 0.0003. At 8 weeks pi, PMSCs vs. vehicle: ES = 1.24, P < 0.0001; P + C + A vs. vehicle: ES = 1.53, P < 0.0001; P + C + A vs. PMSCs: ES = 0.05, P = 0.33. (F) At 3 weeks pi, PMSCs vs. vehicle: ES = 1.7, P < 0.0001; P + C + A vs. vehicle: ES = 2.22, P < 0.0001; P + C + A vs. PMSCs: ES = 0.56, P = 0.003. At 8 weeks pi, PMSCs vs. vehicle: ES = 3.53, P < 0.0001; P + C + A vs. vehicle: ES = 3.61, P < 0.0001; P + C + A vs. PMSCs: ES = 1.04, P = 0.02. (I) At 3 weeks pi, PMSCs vs. vehicle: ES = 0.22, P = 0.002; P + C + A vs. vehicle: ES = 0.41, P < 0.0001; P + C + A vs. PMSCs: ES = 0.55, P = 0.0002. At 8 weeks pi, PMSCs vs. vehicle: ES = 0.9, P < 0.0001; P + C + A vs. vehicle: ES = 1.31, P < 0.0001; P + C + A vs. PMSCs: ES = 0.21, P = 0.009.
Figure 3
Figure 3
Intravenous C16 and Ang-1 enhanced the anti-inflammatory effects of PMSCs in rats with EAE as indicated in serum levels of TNF-α (A), IL-17 (B), IFN-γ (C) and TGF-β (D) at 3 and 8 weeks pi by ELISA. n = 5, #P < 0.05 vs. normal, *P < 0.05 vs. vehicle at 3 weeks pi, &P < 0.05 vs. PMSCs at 3 weeks pi, @P < 0.05 vs. vehicle at 8 weeks pi, $P < 0.05 vs. PMSCs at 8 weeks pi. (A) At 3 weeks pi, PMSCs vs. vehicle: ES = 0.33, P = 0.0001; P + C + A vs. vehicle: ES = 1.98, P < 0.0001; P + C + A vs. PMSCs: ES = 0.15, P = 0.004. AT 8 weeks pi, PMSCs vs. vehicle: ES = 0.45, P = 0.0003; P + C + A vs. vehicle: ES = 0.45, P < 0.0001; P + C + A vs. PMSCs: ES = 0.28, P = 0.003. (B) At 3 weeks pi, PMSCs vs. vehicle: ES = 3.895, P < 0.0001; P + C + A vs. vehicle: ES = 1.86, P < 0.0001; P + C + A vs. PMSCs: ES = 0.04, p = 0.22. AT 8 weeks pi, PMSCs vs. vehicle: ES = 0.2, P < 0.0001; P + C + A vs. vehicle: ES = 0.34, P < 0.0001; P + C + A vs. PMSCs: ES = 0.09, P = 0.03. (C) At 3 weeks pi, PMSCs vs. vehicle: ES = 0.9, P < 0.0001; P + C + A vs. vehicle: ES = 1.51, P < 0.0001); P + C + A vs. PMSCs: ES = 0.1, P = 0.09; At 8 weeks pi, PMSCs vs. vehicle: ES = 0.3, P = 0.028; P + C + A vs. vehicle: ES = 0.36, P < 0.0001; P + C + A vs. PMSCs: ES = 0.07, P = 0.15. (D) At 3 weeks pi, PMSCs vs. vehicle: ES = 3.22, P < 0.0001; P + C + A vs. vehicle: ES = 4, P < 0.0001; P + C + A vs. PMSCs: ES = 0.24, P = 0.008. At 8 weeks pi, PMSCs vs. vehicle: ES = 3.47, P < 0.0001; P + C + A vs. vehicle: ES = 3.31, P < 0.0001; P + C + A vs. PMSCs: ES = 0.36, P = 0.0003.
Figure 4
Figure 4
Intravenous C16 and Ang-1 enhanced the efficacy of PMSC therapy for inhibiting reactive astrogliosis in the EAE rat model. (AN) Immunofluorescence staining of brain cortex and spinal cord specimens for the astrocyte marker GFAP (red) at 3 and 8 weeks pi. SC denotes transverse sections through the anterior horn of the lumbar spine, and BC denotes coronal sections of the motor cortex. (OR) Immunofluorescence staining of the PMSC grafts (green) for GFAP (red). Scale bar = 100 μm. (S,T) Relative areas of GFAP staining at 3 (S) and 8 (T) weeks pi. n = 5, #P < 0.05 vs. normal, *P < 0.05 vs. vehicle, &P < 0.05 vs. PMSCs. (S) In SC, PMSCs vs. vehicle: ES = 0.15, P = 0.0003; P + C + A vs. vehicle: ES = 0.22, P < 0.0001; P + C + A vs. PMSCs: ES = 0.9, P < 0.0001. In BC, PMSCs vs. vehicle: ES = 0.18, P = 0.0002; P + C + A vs. vehicle: ES = 0.21, P = 0.0001; P + C + A vs. PMSCs: ES = 0.25, P = 0.0016. (T) In SC, PMSCs vs. vehicle: ES = 0.49, P < 0.0001; P + C + A vs. vehicle: ES = 0.56, P < 0.0001; P + C + A vs. PMSCs: ES = 0.52, P < 0.0001. In BC, PMSCs vs. vehicle: ES = 0.64, P < 0.0001; P + C + A vs. vehicle: ES = 0.85, P < 0.0001; P + C + A vs. PMSCs: ES = 0.16, P = 0.0005.
Figure 5
Figure 5
Protein expression of MBP (AC), NF-200 (DF), p75NTR (GI), BDNF (JL), GAP-43 (MO) and caspase-3 (PR) in the brain cortex at 3 and 8 weeks pi by western blotting. n = 5. #P < 0.05 vs. normal, *P < 0.05 vs. vehicle, &P < 0.05 vs. PMSCs. (C) At 3 weeks pi, PMSCs vs. vehicle: ES = 1.34, P < 0.0001; P + C + A vs. vehicle: ES = 1.17, P < 0.0001; P + C + A vs. PMSCs ES = 0.08, P = 0.17. At 8 weeks pi, PMSCs vs. vehicle: ES = 0.9, P < 0.0001; P + C + A vs. vehicle: ES = 0.85, P < 0.0001; P + C + A vs. PMSCs: ES = 0.05, P = 0.22. (F) At 3 weeks pi, PMSCs vs. vehicle: ES = 0.72, P < 0.0001; P + C + A vs. vehicle: ES = 0.75, P < 0.0001; P + C + A vs. PMSCs: ES = 0.13, P = 0.047. At 8 weeks pi, PMSCs vs. vehicle: ES = 0.75, P < 0.0001; P + C + A vs. vehicle: ES = 1.87, P < 0.0001; P + C + A vs. PMSCs: ES = 0.3, P = 0.004. (I) At 3 weeks pi, PMSCs vs. vehicle: ES = 0.31, P = 0.0009; P + C + A vs. vehicle: ES = 1.54, P < 0.0001; P + C + A vs. PMSCs: ES = 0.19, P = 0.009. At 8 weeks pi, PMSCs vs. vehicle: ES = 0.69, P < 0.0001; P + C + A vs. vehicle: ES = 0.85, P < 0.0001; P + C + A vs. PMSCs: ES = 0.03, P = 0.3. (L) At 3 weeks pi, PMSCs vs. vehicle: ES = 0.42, P < 0.0001; P + C + A vs. vehicle: ES = 0.49, P < 0.0001; P + C + A vs. PMSCs: ES = 0.03, P = 0.31. At 8 weeks pi, PMSCs vs. vehicle: ES = 1.57, P < 0.0001; P + C + A vs. vehicle: ES = 2.18, P < 0.0001; P + C + A vs. PMSCs: ES = 0.51, P < 0.0001. (O) At 3 weeks pi, PMSCs vs. vehicle: ES = 0.57, P < 0.0001; P + C + A vs. vehicle: ES = 0.68, P < 0.0001; P + C + A vs. PMSCs: ES = 0.06, P = 0.21. At 8 weeks pi, PMSCs vs. vehicle: ES = 1.18, P < 0.0001; P + C + A vs. vehicle: ES = 1.46, P < 0.0001; P + C + A vs. PMSCs: ES = 0.32, P = 0.004. (R) At 3 weeks pi, PMSCs vs. vehicle: ES = 1.34, P < 0.0001; P + C + A vs. vehicle: ES = 2.42, P < 0.0001; P + C + A vs. PMSCs: ES = 1.73, P < 0.0001. At 8 weeks pi, PMSCs vs. vehicle: ES = 3.56, P < 0.0001; P + C + A vs. vehicle: ES = 5.19, P < 0.0001; P + C + A vs. PMSCs: ES = 0.37, P = 0.04.
Figure 6
Figure 6
Intravenous C16 and Ang-1 enhanced the efficacy of PMSC therapy for inhibiting demyelination in the EAE rat model. (AU) Immunofluorescence staining of brain cortex and spinal cord specimens for MBP (red) at 3 and 8 weeks pi. SC denotes transverse sections through the anterior horn of the lumbar spine, and BC denotes coronal sections of the motor cortex. (VY) Immunofluorescence staining of PMSC grafts (green) for MBP (red) at 3 and 8 weeks pi. Arrows indicate PMSC homing to the parenchyma. Scale bar = 100 μm. (I) Percentage of MBP+ cells in all engrafted PMSCs at 3 and 8 weeks pi. n = 5, **P < 0.01 vs. P + C + A (at 3 weeks pi, ES = 1.69, P < 0.0001; at 8 weeks pi, ES = 0.92, P < 0.0001). (II,III) Demyelination scores in BC and SC at 3 (II) and 8 (III) weeks pi. n = 5, *P < 0.01 vs. vehicle, &P < 0.05 vs. PMSCs. (II) In SC, PMSCs vs. vehicle: ES = 15.41, P < 0.0001; P + C + A vs. vehicle: E = 22.93, P < 0.0001; P + C + A vs. PMSCs: ES = 9.86, P = 0.0025. In BC, PMSCs vs. vehicle: ES = 15.96, P < 0.0001; P + C + A vs. vehicle: ES = 21.51, P < 0.0001; P + C + A vs. PMSCs: ES = 17.23, P = 0.0001. (III) In SC, PMSCs vs. vehicle: ES = 9.28, P = 0.0004; P + C + A vs. vehicle: ES = 11.99, P < 0.0001; P + C + A vs. PMSCs: ES = 7.05, P = 0.005. In BC, PMSCs vs. vehicle: ES = 17.39, P < 0.0001; P + C + A vs. vehicle: ES = 12.48, P < 0.0001; P + C + A vs. PMSCs: ES = 0.95, P = 0.26.
Figure 7
Figure 7
Electron micrographs demonstrating the prevention of perivascular edema, demyelination/axon loss, and neuronal apoptosis/necrosis in the rat EAE model by PMSC and P + C + A treatment. (A,B) Normal control rats. (A) normal myelinated axons exhibiting dark, ring-shaped myelin sheaths surrounding axons, (B) normal neuronal nuclei with uncondensed chromatin. (CG) Vehicle-treated EAE rats at 3 weeks pi. (C) myelin sheath displaying splitting, vacuoles, loose and fused changes, and shrunken, atrophied axons, (D,E) tissue edema (D) and severe blood vessel leakage (E, arrow) detected in the extracellular space surrounding the vessels, (F) a neuron showing signs of apoptosis with a shrunken nucleus and condensed, fragmented, and marginated nuclear chromatin, (G) an extravasated inflammatory cell in tissue edema. (HK) PMSC- (H,I) and P + C + A- (J,K) treated EAE rats at 3 weeks pi. Myelin sheath splitting, axonal loss, and perivascular edema were reduced, and neuron nuclei displayed relatively normal morphology. (LN) Vehicle-treated EAE rats at 8 weeks pi. Many myelin lamellae were still undergoing vesicular disintegration and demyelination (L), with some fibers being completely lost or only showing an empty circle of remaining myelin (arrow in L). Perivascular edema and leakage as well as extravasated inflammatory cells were still present (M). Some neurons exhibited signs of necrosis such as large vacuoles and degenerated organelles in the perikaryon, ruptured cytoplasmic membranes, and oncolytic chromatins (arrow in N). (OT) PMSC- (O–Q) and P + C + A- (RT) treated EAE rats at 8 weeks pi. Newly formed myelin sheaths were detected surrounding intact axons (arrow in O). The morphology of neuron nuclei became relatively normal, especially in the P + C + A-treated group. Perivascular edema and leakage were evidently alleviated. K, M, S, scale bar = 5 µm; B,D,E,F,G,I,L,N,O–R, scale bar = 2 µm; A,C,H,J,T, scale bar = 1 µm. (SC) Transverse sections through the anterior horn of the lumbar spinal. (BC) Coronal sections of the motor cortex. (U,V) The calculations of extracellular space surrounding the vessels at 3 (U) and 8 (V) weeks pi. n = 5, #P < 0.05 vs. normal, *P < 0.05 vs. vehicle, &P < 0.05 vs. PMSCs. (U) In SC, PMSCs vs. vehicle: ES = 0.2, P < 0.0001; P + C + A vs. vehicle: ES = 0.3, P < 0.0001; P + C + A vs. PMSCs: ES = 0.12, P < 0.0001. In BC, PMSCs vs. vehicle: ES = 0.11, P = 0.0003; P + C + A vs. vehicle: ES = 0.17, P < 0.0001; P + C + A vs. PMSCs: ES = 0.32, P < 0.0001. (V) In SC, PMSCs vs. vehicle: ES = 0.51, P < 0.0001; P + C + A vs. vehicle: ES = 0.63, P < 0.0001; P + C + A vs. PMSCs: ES = 0.27, P < 0.0001. In BC, PMSCs vs. vehicle: ES = 0.31, P < 0.0001; P + C + A vs. vehicle: ES = 0.49, P < 0.0001; P + C + A vs. PMSCs: ES = 0.17, P < 0.0001.
Figure 8
Figure 8
Intravenous C16 and Ang-1 enhanced the efficacy of PMSC therapy for preventing axonal loss in the EAE rat model. (AR) Immunofluorescence staining of brain cortex and spinal cord specimens for NF-200 (red) at 3 and 8 weeks pi. SC denotes transverse sections through the anterior horn of the lumbar spine, and BC denotes coronal sections of the motor cortex. (SV) Immunofluorescence staining of PMSC grafts (green) for NF-200 (red) at 3 and 8 weeks pi. Scale bars, 100 μm. (W) Percentage of NF-200+ cells in all engrafted PMSCs at 3 and 8 weeks pi. n = 6, **P < 0.01 vs. PMSCs (at 3 weeks pi: ES = 0.59, P < 0.0001; at 8 weeks pi: ES = 0.32, P = 0.000443). (X,Y) Relative NF-200+ cell counts in BC and SC at 3 (X) and 8 (Y) weeks pi. n = 6, #P < 0.05 vs. normal, *P < 0.05 vs. vehicle, &P < 0.05 vs. PMSCs. (X) In SC, PMSCs vs. vehicle: ES = 1.15, P < 0.0001; P + C + A vs. vehicle: ES = 1.64, P < 0.0001; P + C + A vs. PMSCs: ES = 0.3, P = 0.005. In BC, PMSCs vs. vehicle: ES = 0.18, P = 0.001; P + C + A vs. vehicle: ES = 0.34, P = 0.0003; P + C + A vs. PMSCs: ES = 0.18, P = 0.001. (Y) In SC, PMSCs vs. vehicle: ES = 0.34, P < 0.0001; P + C + A vs. vehicle: ES = 0.47, P < 0.0001; P + C + A vs. PMSCs: ES = 0.07, P = 0.11. In BC, PMSCs vs. vehicle: ES = 2.14, P < 0.0001; P + C + A vs. vehicle: ES = 0.93, P < 0.0001; P + C + A vs. PMSCs: ES = 0.22, P = 0.005.
Figure 9
Figure 9
Intravenous C16 and Ang-1 enhanced the efficacy of PMSC therapy for preventing neuronal loss in the EAE rat model. (AN) Nissl staining of brain cortex and spinal cord specimens at 3 and 8 weeks pi. SC denotes transverse sections through the anterior horn of the lumbar spine, and BC denotes coronal sections of the motor cortex. Scale bars, 100 µm. (O,P) Relative numbers of surviving neurons at 3 (O) and 8 (P) weeks pi. n = 5, #P < 0.05 vs. normal, *P < 0.05 vs. vehicle, &P < 0.05 vs. PMSCs. (O) In SC, PMSCs vs. vehicle: ES = 0.87, P < 0.0001; P + C + A vs. vehicle: ES = 1.42, P < 0.0001; P + C + A vs. PMSCs: ES = 0.05, P = 0.21. In BC, PMSCs vs. vehicle: ES = 1.37, P < 0.0001; P + C + A vs. vehicle: ES = 2.94, P < 0.0001; P + C + A vs. PMSCs: ES = 0.36, P = 0.004. (P) In SC, PMSCs vs. vehicle: ES = 2.08, P < 0.0001; P + C + A vs. vehicle: ES = 2.72, P < 0.0001, P + C + A vs. PMSCs: ES = 0.28, P = 0.009. In BC, PMSCs vs. vehicle: ES = 0.97, P < 0.0001; P + C + A vs. vehicle: ES = 1.2, P < 0.0001; P + C + A vs. PMSCs: ES = 0.28, P = 0.01.
Figure 10
Figure 10
Immunofluorescence staining of PMSC grafts (green) in brain cortex and spinal cord specimens for NF-κB (red, AD), COX-2 (red, EH), caspase-3 (red, IL), GAP-43 (red, MP), p75NTR (red, QT), and BDNF (red, UX) at 3 and 8 weeks pi. SC denotes transverse sections through the anterior horn of the lumbar spine, and BC denotes coronal sections of the motor cortex. Scale bars, 100 μm. (IIV) Percentages of cells stained positively for caspase-3 (I), GAP-43 (II), p75NTR (III), and BDNF (IV) among all engrafted PMSCs. n = 5, **P < 0.01 vs. P + C + A. (I) ES = 2.63, P = 0.0003 at 3 weeks pi; ES = 24.77, P < 0.0001 at 8 weeks pi. (II) ES = 1.09, P < 0.0001 at 3 weeks pi; ES = 1.05, P < 0.0001 at 8 weeks pi. (III) ES = 0.6, P < 0.0001 at 3 weeks pi; ES = 0.37, P < 0.0001 at 8 weeks pi. (IV) ES = 0.57, P < 0.0001 at 3 weeks pi; ES = 0.67, P < 0.0001 at 8 weeks pi.

Similar articles

Cited by

References

    1. Conlon P, Oksenberg JR, Zhang J, Steinman L. The immunobiology of multiple sclerosis: an autoimmune disease of the central nervous system. Neurobiol Dis. 1999;6:149–166. doi: 10.1006/nbdi.1999.0239. - DOI - PubMed
    1. Compston A, Coles A. Multiple sclerosis. Lancet. 2002;359:1221–1231. doi: 10.1016/S0140-6736(02)08220-X. - DOI - PubMed
    1. Payne NL, et al. Distinct immunomodulatory and migratory mechanisms underpin the therapeutic potential of human mesenchymal stem cells in autoimmune demyelination. Cell Transplant. 2013;22:1409–1425. doi: 10.3727/096368912X657620. - DOI - PubMed
    1. Cobo M, et al. Mesenchymal stem cells expressing vasoactive intestinal peptide ameliorate symptoms in a model of chronic multiple sclerosis. Cell Transplant. 2013;22:839–854. doi: 10.3727/096368912X657404. - DOI - PubMed
    1. Payne NL, et al. Early intervention with gene-modified mesenchymal stem cells overexpressing interleukin-4 enhances anti-inflammatory responses and functional recovery in experimental autoimmune demyelination. Cell Adhesion & Migration. 2012;6:179–189. doi: 10.4161/cam.20341. - DOI - PMC - PubMed

Publication types

MeSH terms