

doi: 10.1214/17-STS624.
Epub 2017 Nov 28.
The coordinate-based meta-analysis of neuroimaging data
Affiliations
- PMID: 29545671
- PMCID: PMC5849270
- DOI: 10.1214/17-STS624
Item in Clipboard
The coordinate-based meta-analysis of neuroimaging data
Stat Sci.
2017.
Abstract
Neuroimaging meta-analysis is an area of growing interest in statistics. The special characteristics of neuroimaging data render classical meta-analysis methods inapplicable and therefore new methods have been developed. We review existing methodologies, explaining the benefits and drawbacks of each. A demonstration on a real dataset of emotion studies is included. We discuss some still-open problems in the field to highlight the need for future research.
Keywords: functional magnetic resonance imaging; meta-analysis; neuroimaging.
Figures

An average brain in MNI space. Note the directional labels at the edge of each panel: P for Posterior, A for Anterior, S for Superior, I for Inferior, L for Left and R for Right. The origin approximately corresponds to an anatomical structure known as the anterior commissure.

Realisation of the BHICP model for 3 studies. At level 3 (top) latent population centres (grey, z) lie. At level 2 (middle) we have centres of multiple foci (black). These come either directly from population centres (squares, yi) or from background noise (triangles, yi∅). Level 1 (bottom) contains the data (xi). These are multiple (red,
) or singleton (green,
) foci. Singletons come either directly from population centres (dots,
) or from a background Poisson process (asterisks,
).
Results of the simulation study. Power properties of the ALE algorithm are plotted against the proportion of valid studies p. Top left: probability that at least one center is detected. Top right: probability that all 8 centers are detected. Bottom left: mean number of centers detected. Bottom right: mean voxel-wise true positive rate.

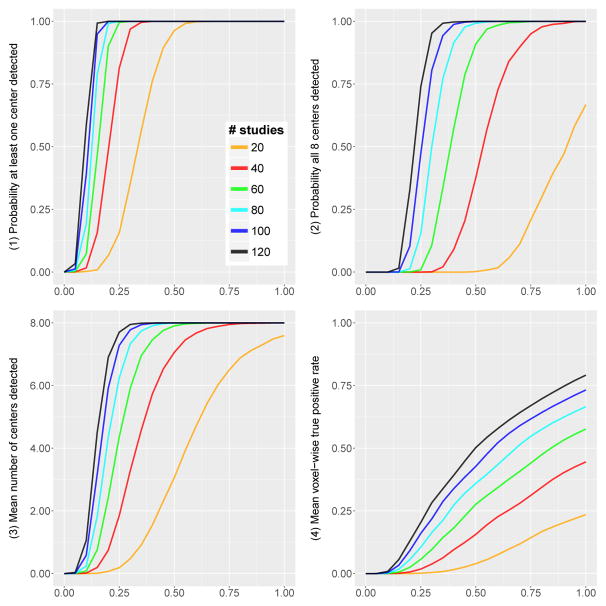
Results of the simulation study. Power properties of the ALE algorithm are plotted against the total number of valid studies Ip. Top left: probability that at least one center is detected. Top right: probability that all 8 centers are detected. Bottom left: mean number of centers detected. Bottom right: mean voxel-wise true positive rate.
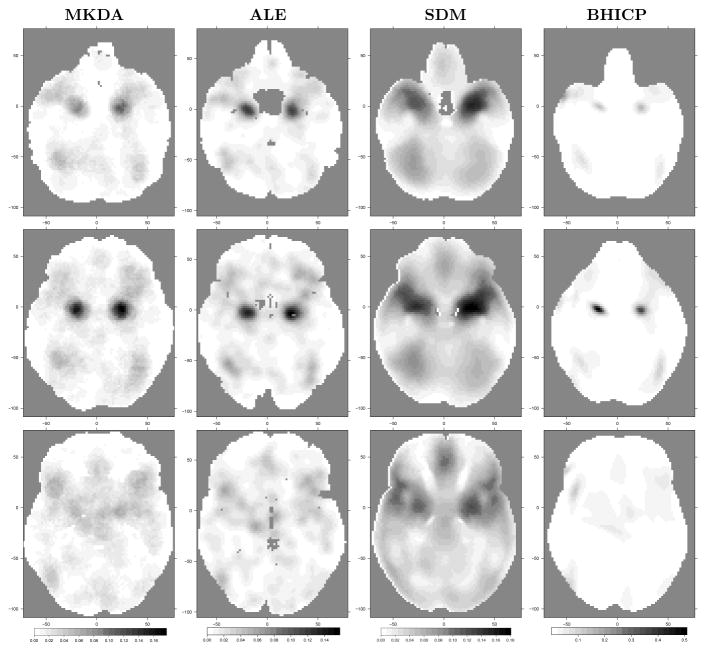
Qualitative comparison of the CBMA methods in regions of high clustering of foci. Column 1 is the MKDA statistic m(v), column 2 is the ALE statistic ℓ(v), column 3 is the SDM statistic s(v), and column 4 is the study activation center intensity
for the BHICP. Rows 1–3 correspond to axial slices z = −22, z = −16 and z = −2, respectively. Note that differences in brain shapes across methods are simply due to different masks used by the various algorithms.

Power properties against the proportion of valid studies p, using the MKDA (left panel) and SDM (right panel) kernels. Top left (both panels): probability that at least one center is detected. Top right (both panels): probability that all 8 centers are detected. Bottom left (both panels): mean number of centers detected. Bottom right (both panels): mean voxel-wise true positive rate.

Power properties against the total number of valid studies Ip, using the MKDA (left panel) and SDM (right panel) kernels. Top left (both panels): probability that at least one center is detected. Top right (both panels): probability that all 8 centers are detected. Bottom left (both panels): mean number of centers detected. Bottom right (both panels): mean voxel-wise true positive rate.

Convergence diagnostics for the BHICP analysis of the emotions dataset. Top panel: traceplots for the total number of population centers (left), integrated intensity in the left amygdala (middle), and integrated intensity in the right amygdala (right) obtained with two different chains initialised at overdispersed starting values. Bottom panel: mean voxel-wise posterior activation center intensity
at axial slices z = −22 (left), z = −16 (middle) and z = −2 (right), as obtained from the second run of the model.
References
-
- Arminger G, Muthén BO. A Bayesian approach to nonlinear latent variable models using the Gibbs sampler and the Metropolis-Hastings algorithm. Psychometrika. 1998;63:271–300.
-
- Bailey DL, Townsend DW, Valk PE, Maisey MN, editors. Positron Emission Tomography: Basic Sciences. Springer-Verlag; 2006.
-
- Bartels A, Zeki S. The neural correlates of maternal and romantic love. Neuroimage. 2004;21:1155–1166. - PubMed
-
- Benjamini Y, Hochberg Y. Controlling the False Discovery Rate: A Practical and Powerful Approach to Multiple Testing. Journal of the Royal Statistical Society. Series B (Methodological) 1995;57:289–300.
-
- Button KS, Ioannidis JPa, Mokrysz C, Nosek Ba, Flint J, Robinson ESJ, Munafò MR. Power failure: why small sample size undermines the reliability of neuroscience. Nature reviews. Neuroscience. 2013;14:365–76. - PubMed
Grants and funding
LinkOut - more resources
Full Text Sources
Other Literature Sources