

The Energy Coding of a Structural Neural Network Based on the Hodgkin-Huxley Model
- PMID: 29545741
- PMCID: PMC5838014
- DOI: 10.3389/fnins.2018.00122
The Energy Coding of a Structural Neural Network Based on the Hodgkin-Huxley Model
Abstract
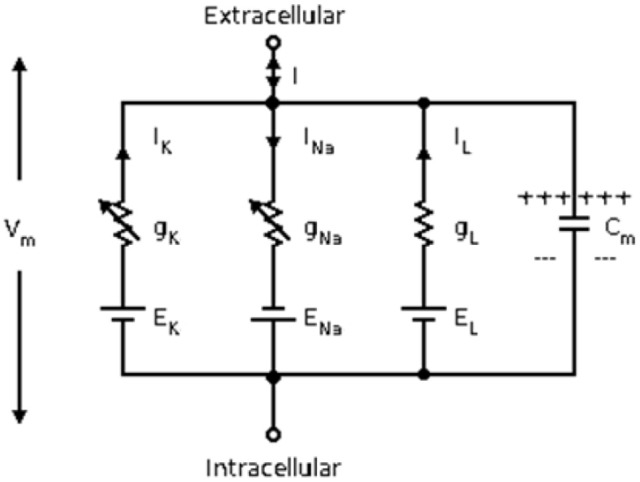
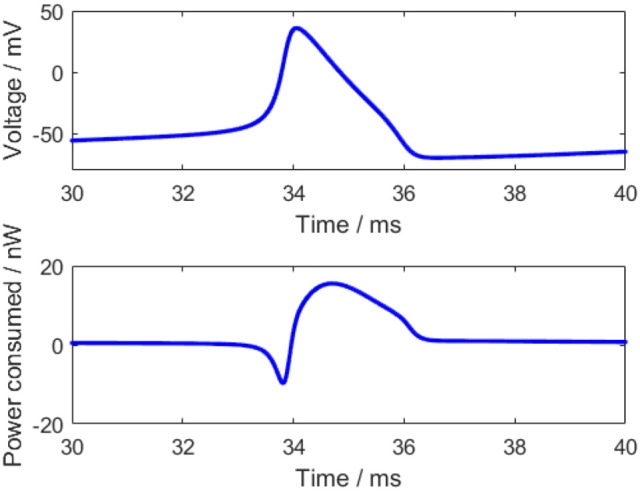
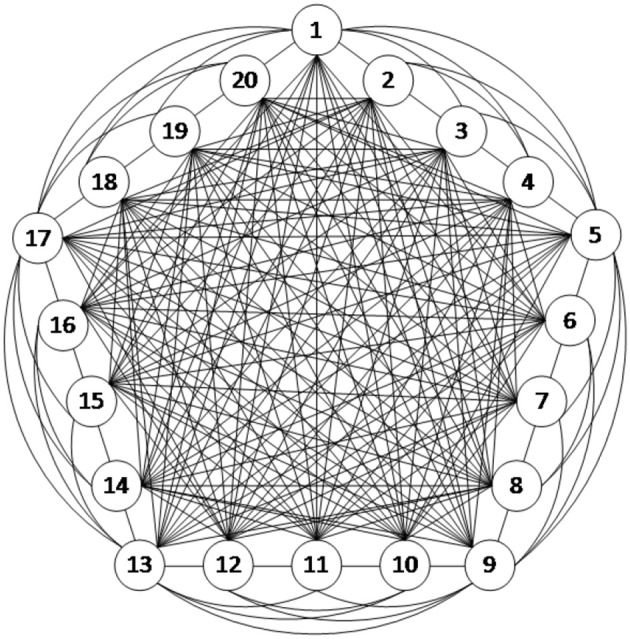
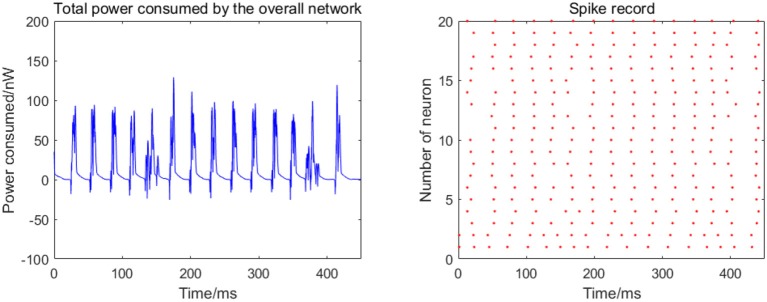
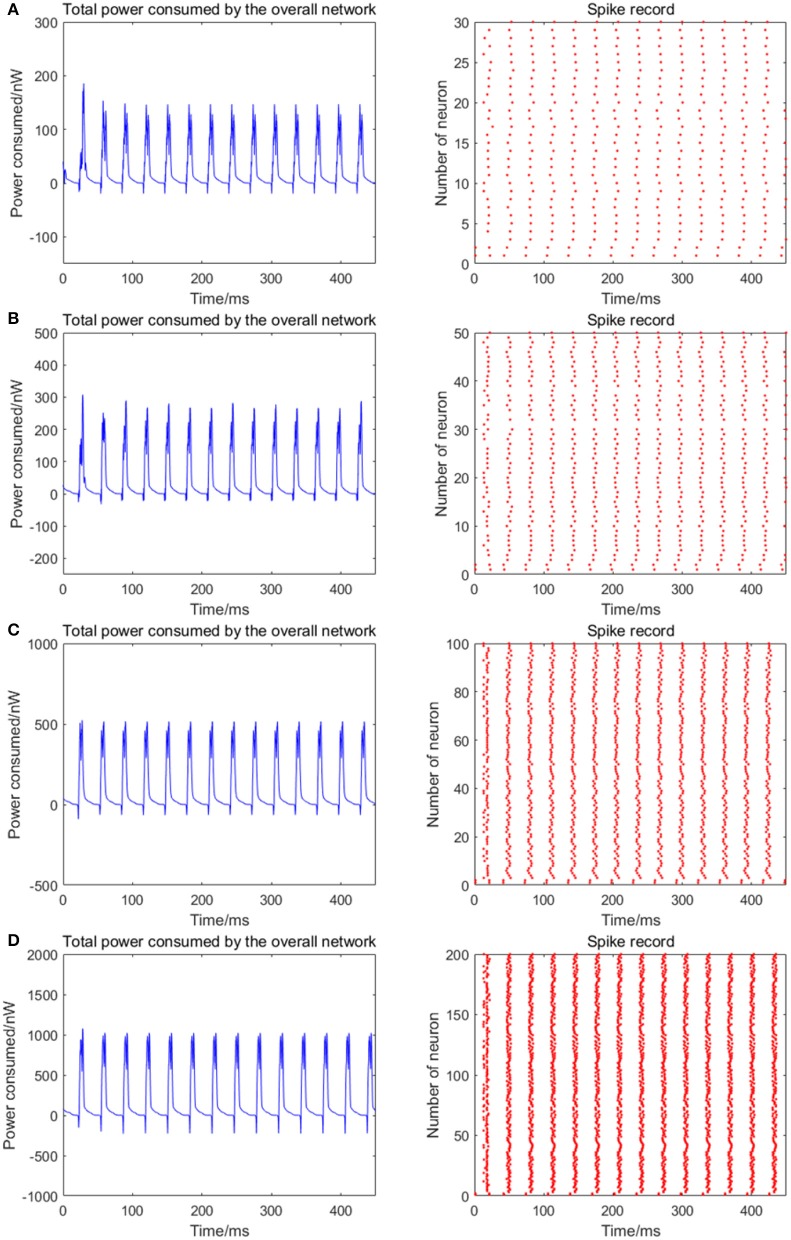
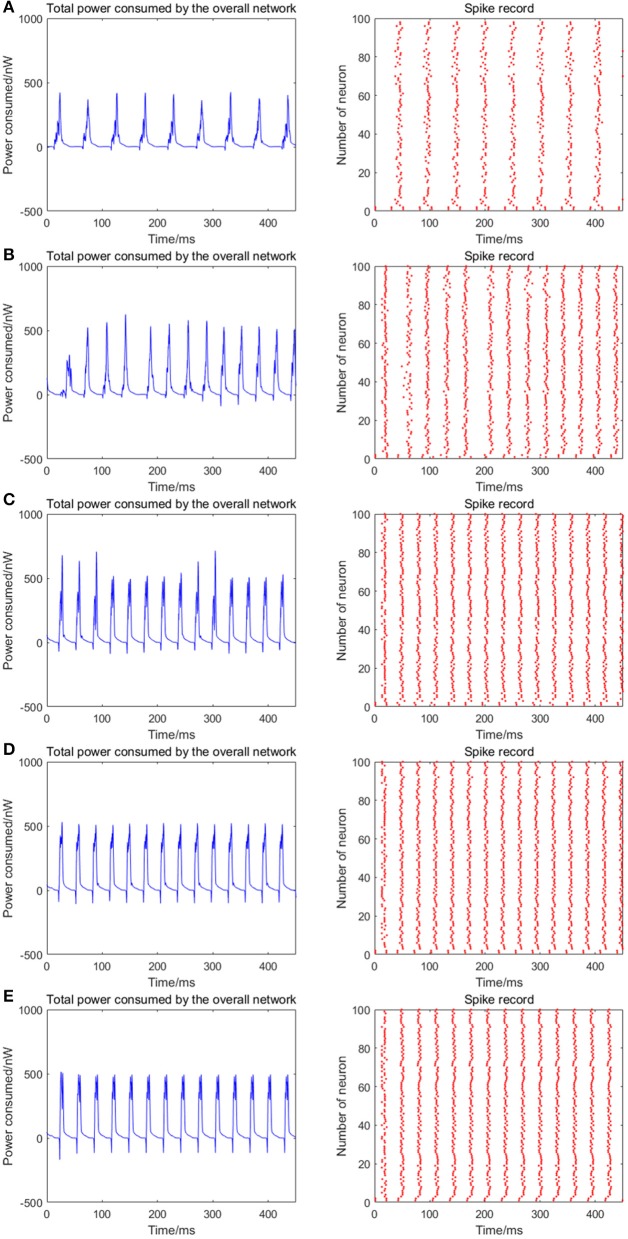
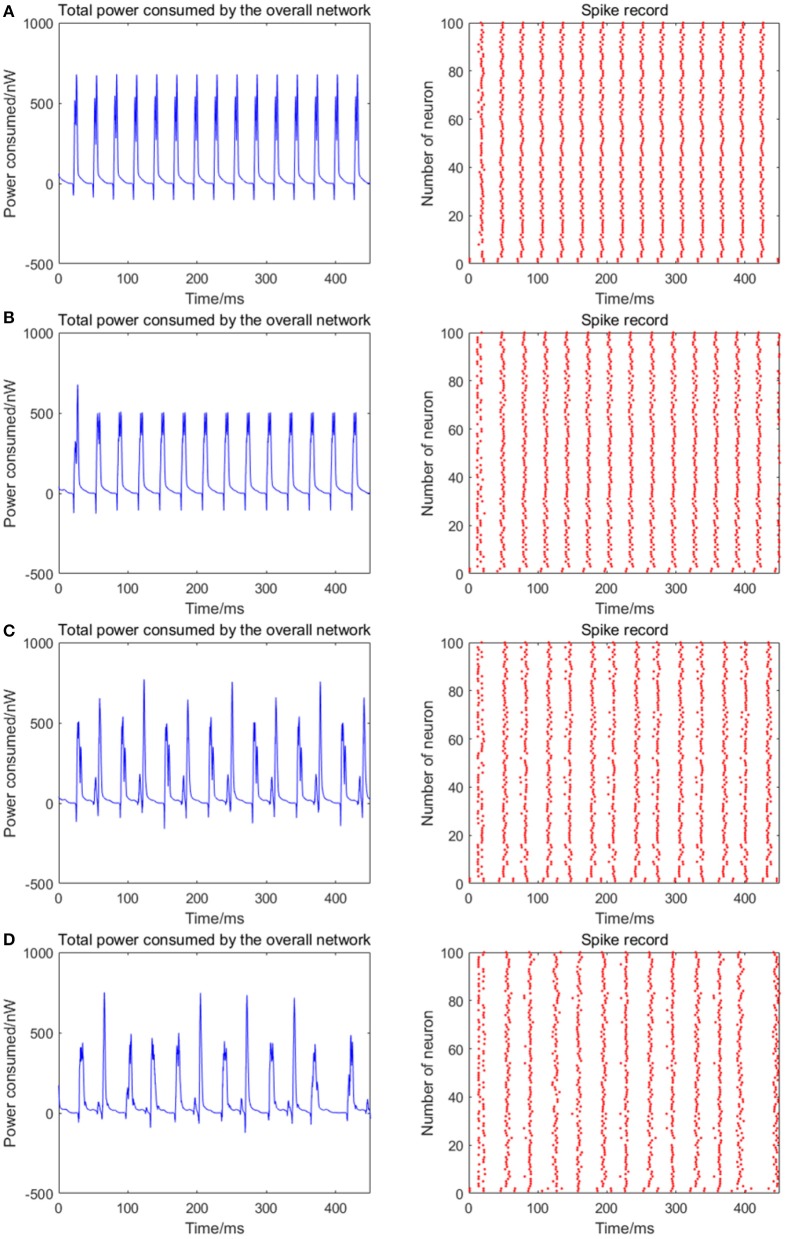
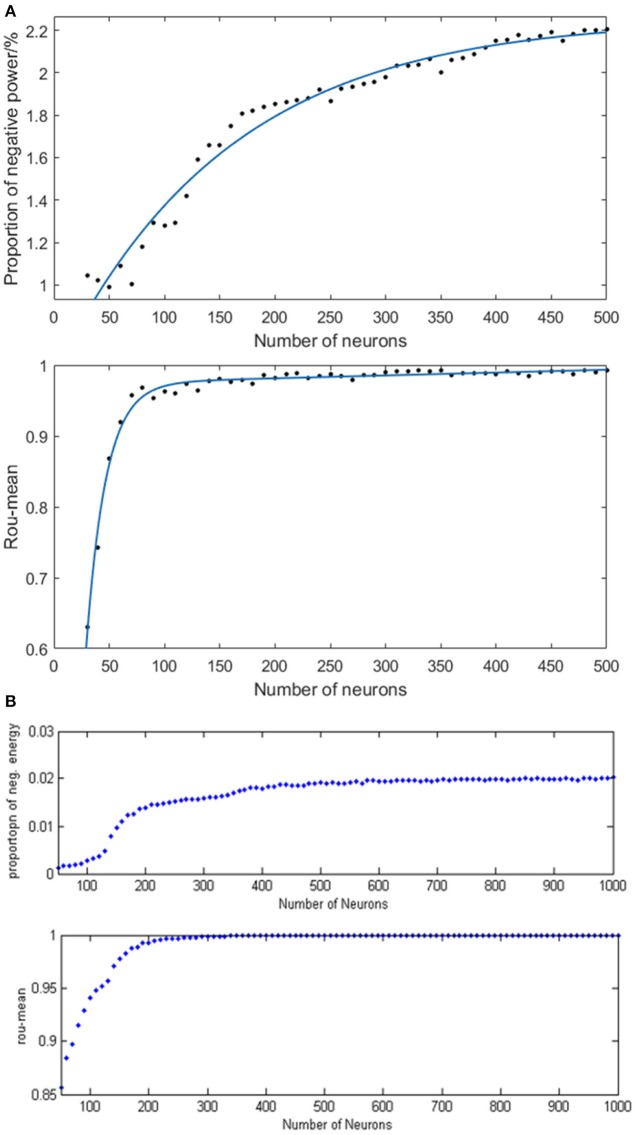
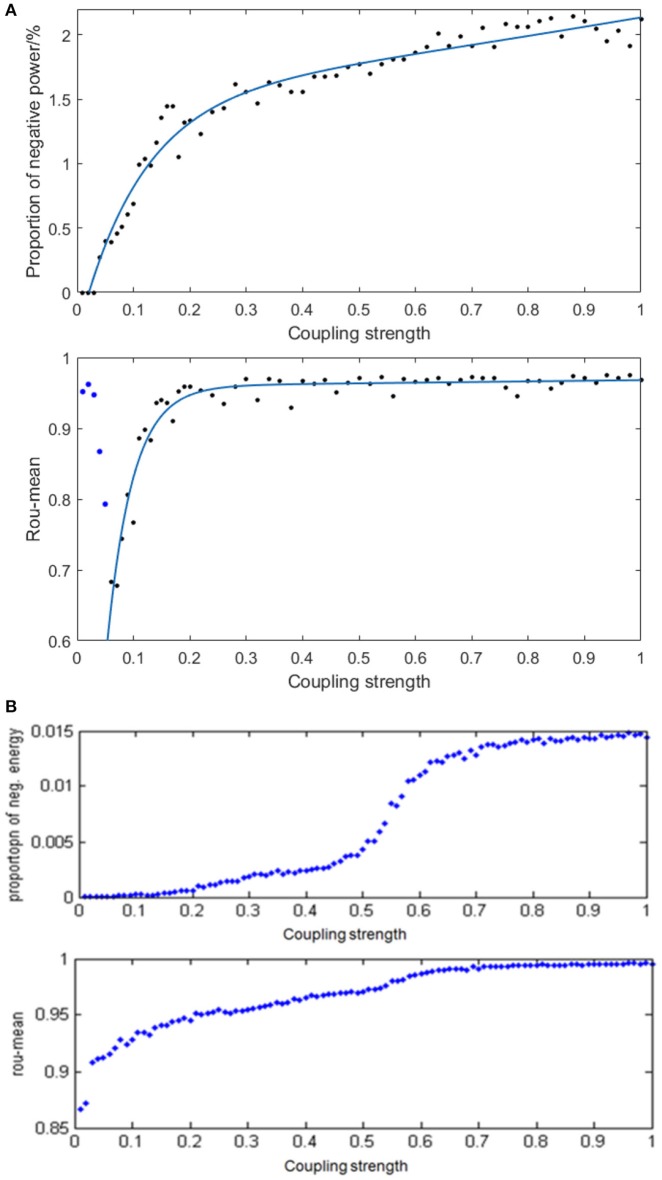
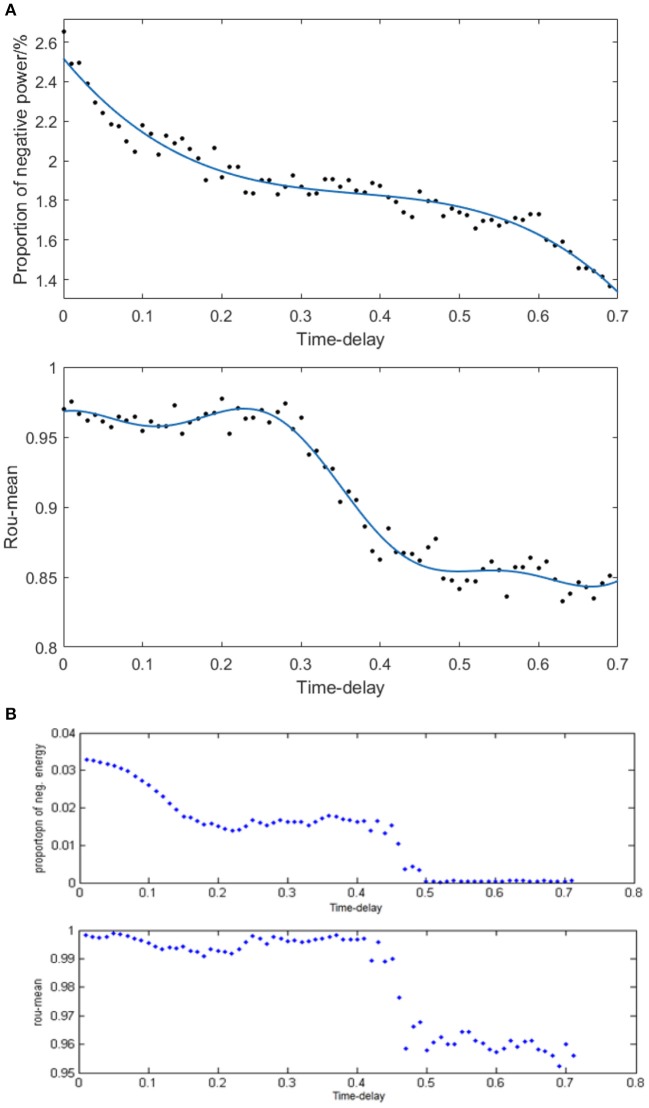
Based on the Hodgkin-Huxley model, the present study established a fully connected structural neural network to simulate the neural activity and energy consumption of the network by neural energy coding theory. The numerical simulation result showed that the periodicity of the network energy distribution was positively correlated to the number of neurons and coupling strength, but negatively correlated to signal transmitting delay. Moreover, a relationship was established between the energy distribution feature and the synchronous oscillation of the neural network, which showed that when the proportion of negative energy in power consumption curve was high, the synchronous oscillation of the neural network was apparent. In addition, comparison with the simulation result of structural neural network based on the Wang-Zhang biophysical model of neurons showed that both models were essentially consistent.
Keywords: energy distribution; negative energy; neural energy coding; power consumption curve; synchronous oscillation.
Figures
Similar articles
-
Energy distribution property and energy coding of a structural neural network.Front Comput Neurosci. 2014 Feb 21;8:14. doi: 10.3389/fncom.2014.00014. eCollection 2014. Front Comput Neurosci. 2014. PMID: 24600382 Free PMC article.
-
Energy efficiency and coding of neural network.Front Neurosci. 2023 Jan 11;16:1089373. doi: 10.3389/fnins.2022.1089373. eCollection 2022. Front Neurosci. 2023. PMID: 36711142 Free PMC article.
-
Neural Energy Supply-Consumption Properties Based on Hodgkin-Huxley Model.Neural Plast. 2017;2017:6207141. doi: 10.1155/2017/6207141. Epub 2017 Feb 16. Neural Plast. 2017. PMID: 28316842 Free PMC article.
-
Energy coding in neural network with inhibitory neurons.Cogn Neurodyn. 2015 Apr;9(2):129-44. doi: 10.1007/s11571-014-9311-3. Epub 2014 Oct 1. Cogn Neurodyn. 2015. PMID: 25806094 Free PMC article.
-
Can the activities of the large scale cortical network be expressed by neural energy? A brief review.Cogn Neurodyn. 2016 Feb;10(1):1-5. doi: 10.1007/s11571-015-9354-0. Epub 2015 Sep 3. Cogn Neurodyn. 2016. PMID: 26834857 Free PMC article. Review.
Cited by
-
Reproducibility of biophysical in silico neuron states and spikes from event-based partial histories.PLoS Comput Biol. 2023 Oct 12;19(10):e1011548. doi: 10.1371/journal.pcbi.1011548. eCollection 2023 Oct. PLoS Comput Biol. 2023. PMID: 37824576 Free PMC article.
-
Dopamine-Mediated Major Depressive Disorder in the Neural Circuit of Ventral Tegmental Area-Nucleus Accumbens-Medial Prefrontal Cortex: From Biological Evidence to Computational Models.Front Cell Neurosci. 2022 Jul 22;16:923039. doi: 10.3389/fncel.2022.923039. eCollection 2022. Front Cell Neurosci. 2022. PMID: 35966208 Free PMC article.
-
The Relationship between Sparseness and Energy Consumption of Neural Networks.Neural Plast. 2020 Nov 25;2020:8848901. doi: 10.1155/2020/8848901. eCollection 2020. Neural Plast. 2020. PMID: 33299397 Free PMC article.
-
Specific Neural Coding of Complex Neural Network Based on Time Coding Under Various Exterior Stimuli.Biomimetics (Basel). 2025 Mar 6;10(3):162. doi: 10.3390/biomimetics10030162. Biomimetics (Basel). 2025. PMID: 40136816 Free PMC article.
-
Memory retention in pyramidal neurons: a unified model of energy-based homo and heterosynaptic plasticity with homeostasis.Cogn Neurodyn. 2021 Aug;15(4):675-692. doi: 10.1007/s11571-020-09652-z. Epub 2020 Nov 17. Cogn Neurodyn. 2021. PMID: 34367368 Free PMC article.
References
LinkOut - more resources
Full Text Sources
Other Literature Sources