. 2018 Mar 2:9:413.
doi: 10.3389/fimmu.2018.00413. eCollection 2018.

Repertoire Analysis of Antibody CDR-H3 Loops Suggests Affinity Maturation Does Not Typically Result in Rigidification

Affiliations

Repertoire Analysis of Antibody CDR-H3 Loops Suggests Affinity Maturation Does Not Typically Result in Rigidification

Jeliazko R Jeliazkov et al. Front Immunol. .

Abstract

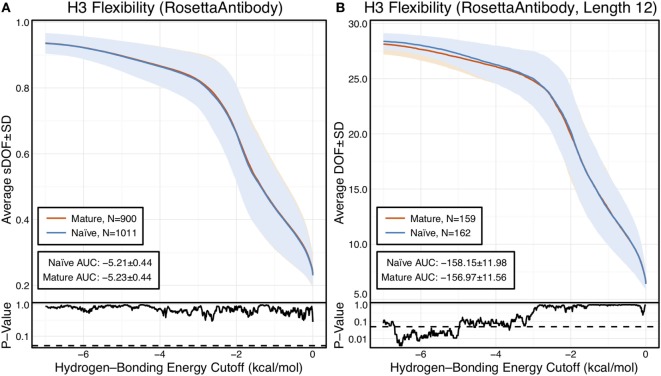
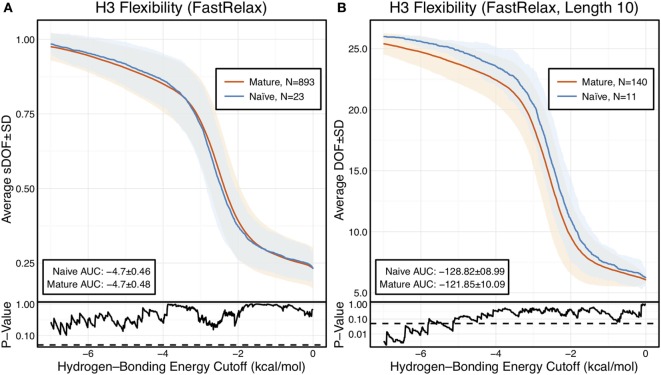
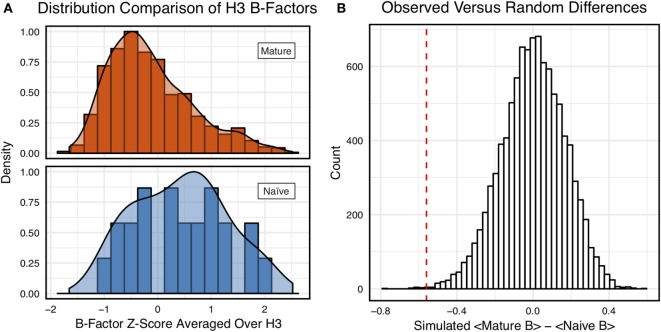
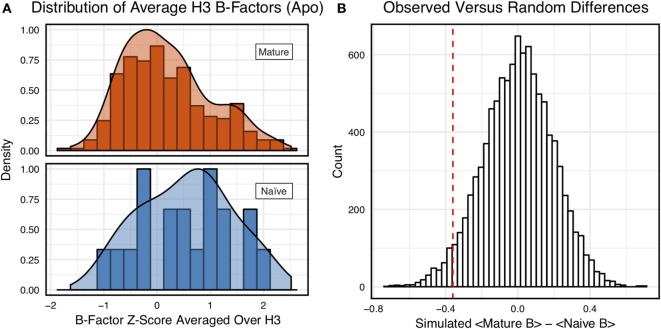
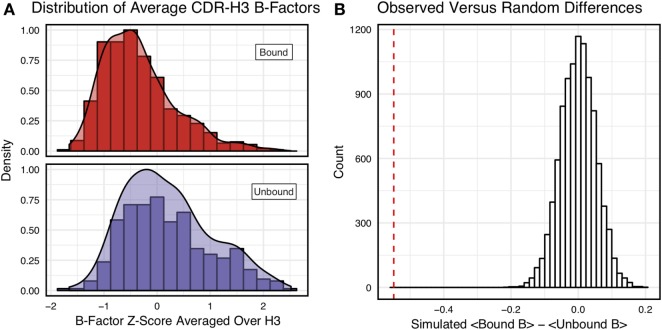
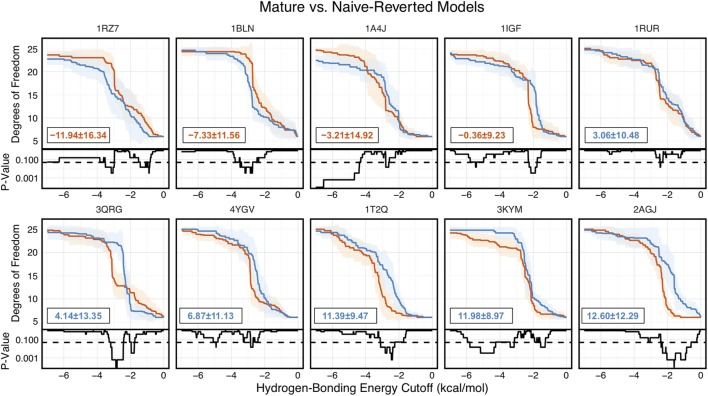
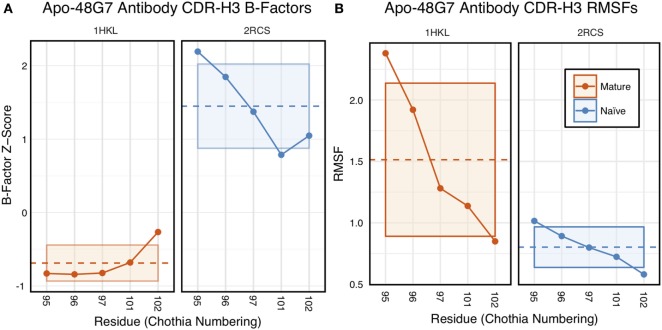
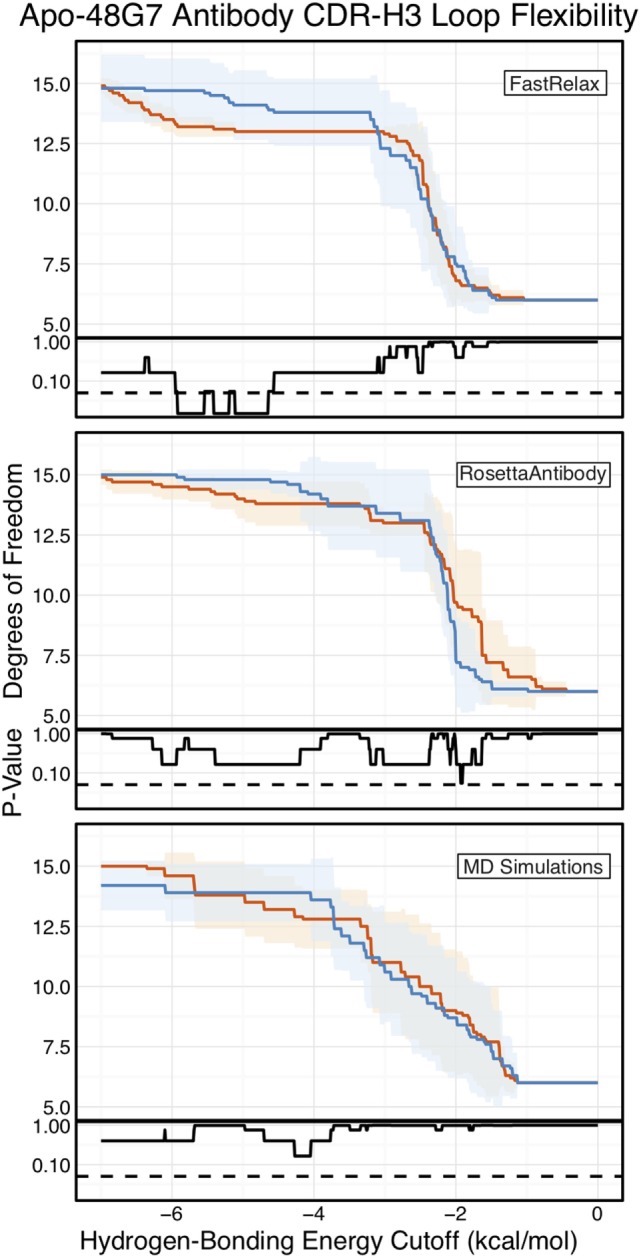
Antibodies can rapidly evolve in specific response to antigens. Affinity maturation drives this evolution through cycles of mutation and selection leading to enhanced antibody specificity and affinity. Elucidating the biophysical mechanisms that underlie affinity maturation is fundamental to understanding B-cell immunity. An emergent hypothesis is that affinity maturation reduces the conformational flexibility of the antibody's antigen-binding paratope to minimize entropic losses incurred upon binding. In recent years, computational and experimental approaches have tested this hypothesis on a small number of antibodies, often observing a decrease in the flexibility of the complementarity determining region (CDR) loops that typically comprise the paratope and in particular the CDR-H3 loop, which contributes a plurality of antigen contacts. However, there were a few exceptions and previous studies were limited to a small handful of cases. Here, we determined the structural flexibility of the CDR-H3 loop for thousands of recent homology models of the human peripheral blood cell antibody repertoire using rigidity theory. We found no clear delineation in the flexibility of naïve and antigen-experienced antibodies. To account for possible sources of error, we additionally analyzed hundreds of human and mouse antibodies in the Protein Data Bank through both rigidity theory and B-factor analysis. By both metrics, we observed only a slight decrease in the CDR-H3 loop flexibility when comparing affinity matured antibodies to naïve antibodies, and the decrease was not as drastic as previously reported. Further analysis, incorporating molecular dynamics simulations, revealed a spectrum of changes in flexibility. Our results suggest that rigidification may be just one of many biophysical mechanisms for increasing affinity.

Keywords: RosettaAntibody; affinity maturation; antibody repertoires; complementarity determining regions; conformational flexibility; molecular dynamics simulations; pebble game algorithm; rigidity theory.


Figures

Figure 1
Figure 1
CDR-H3 loop flexibility analysis of the immunomic antibody set reveals that no difference in naïve (blue) and mature (red) antibodies. Floppy inclusions and rigid substructure topography-Pebble Game was used to determine the degrees of freedoms (DOFs) as a function of hydrogen-bonding energy cutoff in RosettaAntibody models of the 1,911 most frequent public antibodies. Results were split, depending on whether the antibody was naïve or mature, as determined by B-cell surface receptors, and the mean DOFs were calculated along with the SD, shown in a lighter shade of the respective color. Subplots, below each main plot, show the p-value computed by a two-sample Kolmogorov–Smirnov (KS) test comparison of the naïve and mature DOFs distributions for each hydrogen-bonding energy cutoff, with null hypothesis being that the distributions are the same. A dashed line indicates a p-value of 0.05. (A) To permit comparison across loops of multiple lengths, the DOFs were scaled to a theoretical maximum for each length (a value of 1 indicates all DOFs are available, whereas a value of 0 indicates no DOFs are available). We found the scaled DOFs to be similar for both naïve and mature antibodies, quantified by the KS test p-values and area under the curve (AUC) ± SD: −5.21 ± 0.44 and −5.23 ± 0.44, respectively. (B) To exclude length effects on flexibility calculations, we compared DOFs for the most popular length (12 residues). We found the naïve AUC ± SD at −158.15 ± 11.98 and mature AUC ± SD at −156.97 ± 11.56 to be similar. The distributions appear similar at cutoffs between 0 and −5.0 kcal/mol, according to the KS test p-values.
Figure 2
Figure 2
When accounting for length, CDR-H3 loop flexibility analysis of the crystallographic antibody set reveals naïve (blue) antibodies to be slightly more flexible than mature (red). Floppy Inclusions and Rigid Substructure Topography-Pebble Game was used to determine the degrees of freedoms (DOFs) as a function of hydrogen-bonding energy cutoffs in crystal structure ensembles created by Rosetta FastRelax. Results were split, depending on whether the antibody was naïve or mature, as determined by BLAST alignment to its germline V-genes, and the mean DOFs were calculated along with the SD, shown in a lighter shade of the respective color. Subplots, below each main plot, show the p-value computed by a Kolmogorov–Smirnov (KS) test comparison of the naïve and mature DOF distributions for each hydrogen-bonding energy cutoff, with null hypothesis being that the distributions are the same. A dashed line indicates a p-value of 0.05. (A) To permit comparison across loops of multiple lengths, the DOFs were scaled to a theoretical maximum for each length (a value of 1 indicates all DOFs are available whereas a value of 0 indicates not DOFs are available). We found the scaled DOFs to be similar for both naïve and mature antibodies, quantified by KS test p-values and the areas under the curve (AUCs) ± SD: −4.70 ± 0.46 and −4.70 ± 0.48, respectively. (B) To exclude length effects on flexibility calculations, we compared DOFs for the most popular length (10 residues). We found the naïve AUC ± SD at −128.82 ± 8.99 was greater than the mature AUC ± SD at −121.85 ± 10.09, but still within a SD. The distributions appear similar at cutoffs between 0 and −6.0 kcal/mol, according to the KS test p-values.
Figure 3
Figure 3
Comparison of the distribution of average CDR-H3 loop B-factor z-scores in antibody crystal structures suggests that naïve are more flexible than mature. (A) Distributions of average CDR-H3 loop B-factors for the crystallographic set of antibodies are distinct for the mature (orange) and naïve (blue) sets. The mature antibody CDR-H3 loops have lower B-factors than the naïve, corresponding to more rigidity. Bars show binned counts in intervals of 0.25. Both the bars and smoothed densities are normalized so the maximum value is 1. A two-sample Kolmogorov–Smirnov test confirms different underlying distributions with a p-value of 0.006 and maximum vertical deviation, D, of 0.36. (B) The observed difference in distribution means is difficult to replicate by random chance, occurring only 6.6 ± 2.6 times out of 10,000 simulations. Comparing the observed difference in means (red line, dashed) to simulated differences (white bars) acquired by randomly assigning B-factor values from the original distributions to either a naïve or mature set, in the observed numbers (Nmature = 897 and Nnaive = 23), before computing the difference in means.
Figure 4
Figure 4
When considering only antigen-free crystal structures (to control for rigidification upon antigen biding), the difference between naïve and mature average CDR-H3 loop B-factor z-score distributions is small. (A) The distributions of CDR-H3 loop average B-factors are less distinct between the mature (orange) and naïve (blue) sets. Bars show binned counts in intervals of 0.25. Both the bars and smoothed densities are normalized so the maximum value is 1. A two-sample Kolmogorov–Smirnov test results in a p-value of 0.15 and D of 0.27, indicating that the null hypothesis of indistinguishable underlying distributions cannot be discarded. (B) The observed difference in distribution means (red line, dashed) is occasionally replicated in random resampling (white bars). When average CDR-H3 loop B-factor z-scores are pooled and randomly assigned to either a naïve or mature set, in the observed numbers (Nmature = 355 and Nnaive = 18), the observed difference in means is matched or surpassed in 340 ± 20 out of 10,000 simulated differences.
Figure 5
Figure 5
Antigen-bound and antigen-free distributions of B-factor z-scores are distinct. (A) Distributions of CDR-H3 loop average B-factors for the crystallographic set of antibodies are distinct for the antigen-bound (red) and antigen-free (purple) sets. Bound antibody CDR-H3 loops have lower B-factors than unbound, corresponding to more rigidity. Bars show binned counts in intervals of 0.25. Both the bars and smoothed densities are normalized so the maximum value is 1. Distributions appear distinct according to a two-sample Kolmogorov–Smirnov test with a p-value of 2.2E-16 and D of 0.31. (B) The observed difference in distribution means (red line, dashed) is never replicated in 10,000 attempts at random resampling (white bars). Simulated differences were acquired by randomly assigning values from both sets to either a naïve or mature set, in the observed numbers (Nbound = 546 and Nnaive = 374), before computing the difference means.
Figure 6
Figure 6
Floppy Inclusions and Rigid Substructure Topography-Pebble Game analysis of 10 RosettaAntibody-modeled mature/naïve-reverted antibody pairs (CDR-H3 loop length of 10 residues) shows that affinity maturation does not always result in CDR-H3 loop rigidification. Naïve values are colored blue, while mature values are color red. The difference between mature and naïve area under the curves (AUCs) is reported in the bottom left of each sub-figure, with a positive value indicate a more flexible naïve antibody. 4 out of the 10 cases have mature antibodies with AUC greater than their naïve counterparts. Subplots, below each main plot, show the p-value computed by a Kolmogorov–Smirnov test comparison of the naïve and mature degrees of freedom distributions for each hydrogen-bonding energy cutoff, with null hypothesis being that the distributions are the same and a dashed line indicating a p-value of 0.05.
Figure 7
Figure 7
Analysis of catalytic antibody 48G7 by CDR-H3 loop B-factors and root-mean-square fluctuations (RMSFs) shows conflicting results. (A) Comparison of normalized B-factor values for the CDR-H3 loop of the 48G7 antibody in crystal structures of the unbound naïve (dark blue) and mature (dark orange) antibodies reveals a more rigidity in the mature antibody. The dashed line indicates the average value and is outlined by a box defined by the average plus-or-minus the SD. (B) Comparison of CDR-H3 loop RMSFs for the molecular dynamics simulations of the naïve and mature 48G7 antibodies shows the opposite.
Figure 8
Figure 8
Floppy inclusions and rigid substructure topography-Pebble Game (FIRST-PG) analysis of naïve (dark blue) and mature (dark orange) 48G7 antibodies using either Rosetta FastRelax-, RosettaAntibody-, or molecular dynamics (MD)-generated 10-member ensembles does not show a difference between the naïve and mature antibodies. FIRST-PG analysis calculates the degrees of freedom (DOFs) of CDR-H3 loop as a function of hydrogen-bonding energy cutoff. Subplots, below each main plot, show the p-value computed by a Kolmogorov–Smirnov test comparison of the naïve and mature DOF distributions for each hydrogen-bonding energy cutoff, with null hypothesis being that the distributions are the same and a dashed line indicating a p-value of 0.05. While the FastRelax ensembles appear distinct in the range of −6 to −3 kcal/mol, the naïve and mature are indistinguishable for both the RosettaAntibody and MD ensembles.

Similar articles

Cited by

References

    1. Tonegawa S. Somatic generation of antibody diversity. Nature (1983) 302(5909):575–81.10.1038/302575a0 - DOI - PubMed
    1. Di Noia JM, Neuberger MS. Molecular mechanisms of antibody somatic hypermutation. Annu Rev Biochem (2007) 76:1–22.10.1146/annurev.biochem.76.061705.090740 - DOI - PubMed
    1. de los Rios M, Criscitiello MF, Smider VV. Structural and genetic diversity in antibody repertoires from diverse species. Curr Opin Struct Biol (2015) 33:27–41.10.1016/j.sbi.2015.06.002 - DOI - PMC - PubMed
    1. Clark LA, Ganesan S, Papp S, van Vlijmen HW. Trends in antibody sequence changes during the somatic hypermutation process. J Immunol (2006) 177(1):333–40.10.4049/jimmunol.177.1.333 - DOI - PubMed
    1. Burkovitz A, Sela-Culang I, Ofran Y. Large-scale analysis of somatic hypermutations in antibodies reveals which structural regions, positions and amino acids are modified to improve affinity. FEBS J (2014) 281(1):306–19.10.1111/febs.12597 - DOI - PubMed

Publication types

MeSH terms

Substances

LinkOut - more resources