. 2018 Apr;15(4):3151-3160.
doi: 10.3892/etm.2018.5871. Epub 2018 Feb 14.

Current diagnostic imaging of pheochromocytomas and implications for therapeutic strategy

Affiliations

Current diagnostic imaging of pheochromocytomas and implications for therapeutic strategy

Filip Čtvrtlík et al. Exp Ther Med. 2018 Apr.

Abstract

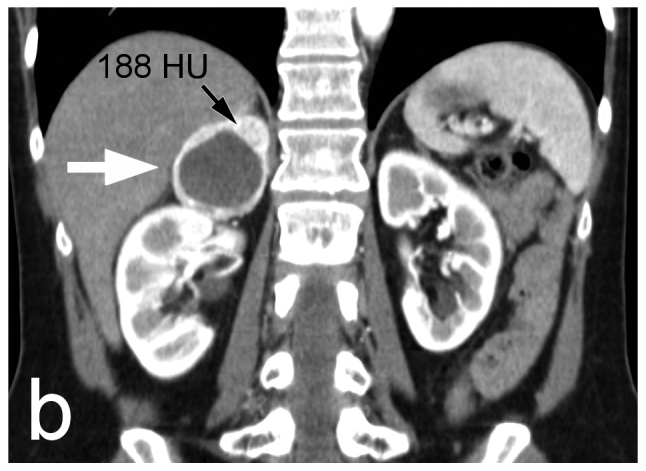
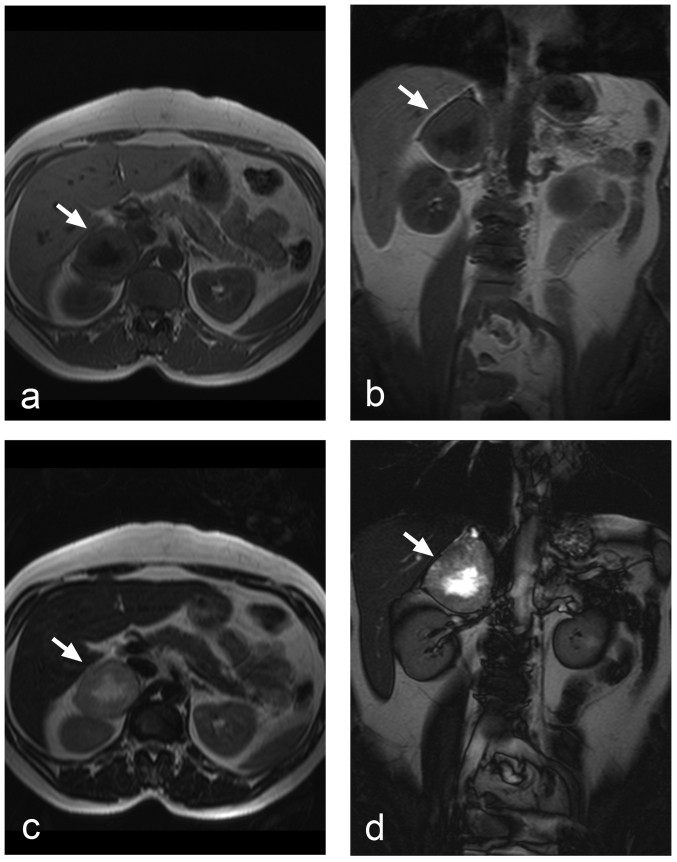
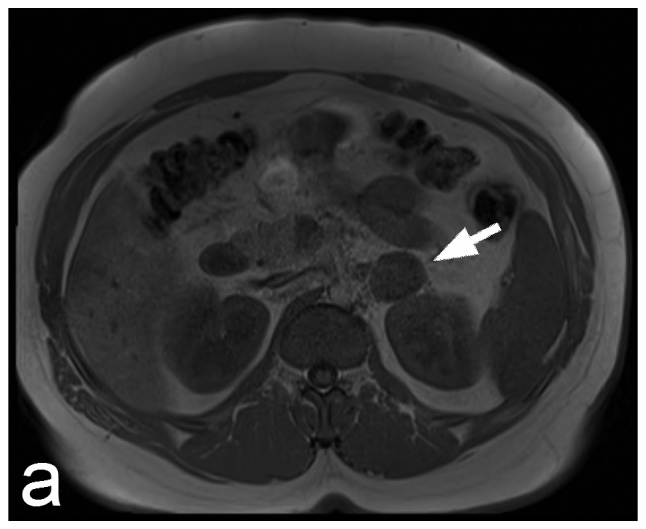
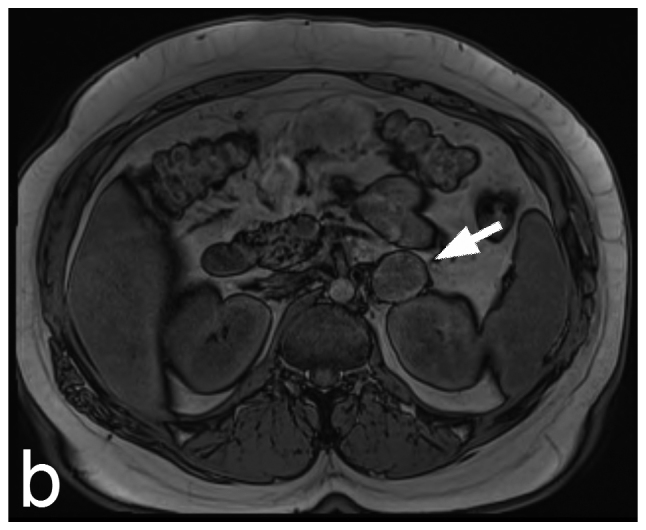
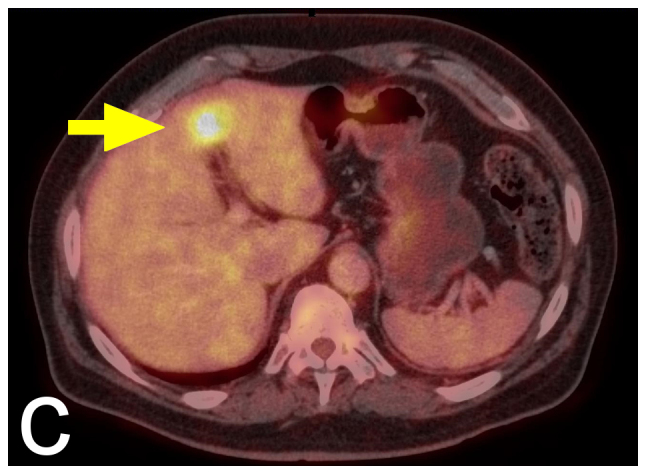
The topic of pheochromocytomas is becoming increasingly popular as a result of major advances in different medical fields, including laboratory diagnosis, genetics, therapy, and particularly in novel advances in imaging techniques. The present review article discusses current clinical, biochemical, genetic and histopathological aspects of the diagnosis of pheochromocytomas and planning of pre-surgical preparation and subsequent surgical treatment options. The main part of the paper is focused on the role of morphological imaging methods (primarily computed tomography and magnetic resonance imaging) and functional imaging (scintigraphy and positron emission tomography) in the diagnosis and staging of pheochromocytomas.

Keywords: adrenal masses; adrenalectomy; imaging; incidentalomas; pheochromocytoma.


Figures

Figure 1.
Figure 1.
Small adrenal pheochromocytoma on the right side (arrows): (a) non-enhanced CT scan in the axial plane, (b) contrast-enhanced CT scans (venous phase) in the axial plane, (c) contrast-enhanced CT scan (delayed phase 10 min after) in the axial plane. The wash-out rate calculation is 61%, which fulfils the threshold for an adenoma. CT, computed tomography; HU, Hounsfield units.
Figure 1.
Figure 1.
Small adrenal pheochromocytoma on the right side (arrows): (a) non-enhanced CT scan in the axial plane, (b) contrast-enhanced CT scans (venous phase) in the axial plane, (c) contrast-enhanced CT scan (delayed phase 10 min after) in the axial plane. The wash-out rate calculation is 61%, which fulfils the threshold for an adenoma. CT, computed tomography; HU, Hounsfield units.
Figure 2.
Figure 2.
Adrenal pheochromocytoma on the right side (white arrows): (a) contrast-enhanced CT scans (arterial phase) in the axial plane, (b) contrast-enhanced CT scan in the coronal plane. The tumour has a regular spherical shape, smooth margin, and central necrosis. Contrast-enhanced attenuation of the peripheral rim in arterial phase reached more than 180 HU (black arrow). CT, computed tomography; HU, Hounsfield units.
Figure 2.
Figure 2.
Adrenal pheochromocytoma on the right side (white arrows): (a) contrast-enhanced CT scans (arterial phase) in the axial plane, (b) contrast-enhanced CT scan in the coronal plane. The tumour has a regular spherical shape, smooth margin, and central necrosis. Contrast-enhanced attenuation of the peripheral rim in arterial phase reached more than 180 HU (black arrow). CT, computed tomography; HU, Hounsfield units.
Figure 3.
Figure 3.
Adrenal pheochromocytoma on the right side (arrows): (a) T1-weighted spoiled gradient echo in the axial plane, (b) T1-weighted spoiled gradient echo in the coronal plane, (c) T2-weighted turbo spin echo in the axial plane, (d) True FISP in the coronal plane. T2-weighted image showing typical high signal intensity in the central necrotic part, which appears hypointense in T1-weighted images.
Figure 4.
Figure 4.
MRI of adrenal pheochromocytoma on the right side (arrows): (a) axial T1-weighted ‘in-phase’ image, (b) axial T1-weighted ‘out-of-phase’ image, (c) axial diffusion-weighted image (b=800), (d) axial ADC map. The lesion shows no decrease in the signal in the ‘out-of-phase’ image. Restricted diffusion is present on the ADC map. ADC, apparent diffusion coefficient.
Figure 4.
Figure 4.
MRI of adrenal pheochromocytoma on the right side (arrows): (a) axial T1-weighted ‘in-phase’ image, (b) axial T1-weighted ‘out-of-phase’ image, (c) axial diffusion-weighted image (b=800), (d) axial ADC map. The lesion shows no decrease in the signal in the ‘out-of-phase’ image. Restricted diffusion is present on the ADC map. ADC, apparent diffusion coefficient.
Figure 5.
Figure 5.
123I-MIBG SPECT/CT study: (a) maximum-intensity projection, (b) coronal slice. Re-staging examination reveals the metastatic spread of malignant pheochromocytoma into the lungs (white arrows), liver (black arrows), and vertebra L3 (yellow arrow). The patient subsequently underwent 131I-MIBG therapy. I-MIBG, I-metaiodobenzylguanidine.
Figure 6.
Figure 6.
99mTc-HYNIC-TOC scintigraphy in a patient with atypical giant paraganglioma in: (a) Anterior and (b) posterior whole-body scintigrams, (c) axial CT scan, (d) axial SPECT/CT fusion. The examination confirmed the expression of somatostatin receptors in peripheral solid areas of the large tumour (arrows). CT, computed tomography.
Figure 6.
Figure 6.
99mTc-HYNIC-TOC scintigraphy in a patient with atypical giant paraganglioma in: (a) Anterior and (b) posterior whole-body scintigrams, (c) axial CT scan, (d) axial SPECT/CT fusion. The examination confirmed the expression of somatostatin receptors in peripheral solid areas of the large tumour (arrows). CT, computed tomography.
Figure 7.
Figure 7.
18F-FDG PET/CT in SDHB-positive patient; (a) maximum-intensity projection, (b) axial CT slice, (c) fused axial 18F-FDG PET/CT image. The finding reveals the metastatic spread of malignant pheochromocytoma into the liver (yellow arrows) and the left lung (black arrow). 18F-FDG, 18F-fluorodeoxyglucose.
Figure 7.
Figure 7.
18F-FDG PET/CT in SDHB-positive patient; (a) maximum-intensity projection, (b) axial CT slice, (c) fused axial 18F-FDG PET/CT image. The finding reveals the metastatic spread of malignant pheochromocytoma into the liver (yellow arrows) and the left lung (black arrow). 18F-FDG, 18F-fluorodeoxyglucose.
Figure 8.
Figure 8.
Photograph of a laparoscopic adrenalectomy: exposed left RV and SV, clips placed on the suprarenal vein before attempting further manipulation of the pheochromocytoma. Incidental finding of an anomalous left GV draining into the left suprarenal vein. RV, renal vein; SV, suprarenal vein, GV, gonadal vein.

Similar articles

Cited by

References

    1. Dahia PL. Pheochromocytoma and paraganglioma pathogenesis: Learning from genetic heterogeneity. Nat Rev Cancer. 2014;14:108–119. doi: 10.1038/nrc3648. - DOI - PubMed
    1. Lenders JW, Eisenhofer G, Mannelli M, Pacak K. Phaeochromocytoma. Lancet. 2005;366:665–675. doi: 10.1016/S0140-6736(05)67139-5. - DOI - PubMed
    1. Lam AK. Update on adrenal tumours in 2017 world health organization (WHO) of endocrine tumours. Endocr Pathol. 2017;28:213–227. doi: 10.1007/s12022-017-9484-5. - DOI - PubMed
    1. Lloyd RV, Osamura RY, Klöppel G, Rosai J. WHO Classification of Tumours of Endocrine Organs. 4th. IACR; Lyon: 2017.
    1. Roman-Gonzalez A, Jimenez C. Malignant pheochromocytoma-paraganglioma: Pathogenesis, TNM staging and current clinical trials. Curr Opin Endocrinol Diabetes Obes. 2017;24:174–183. doi: 10.1097/MED.0000000000000330. - DOI - PubMed