

Metabolic profiles of triple-negative and luminal A breast cancer subtypes in African-American identify key metabolic differences
- PMID: 29545929
- PMCID: PMC5837744
- DOI: 10.18632/oncotarget.24433
Metabolic profiles of triple-negative and luminal A breast cancer subtypes in African-American identify key metabolic differences
Abstract
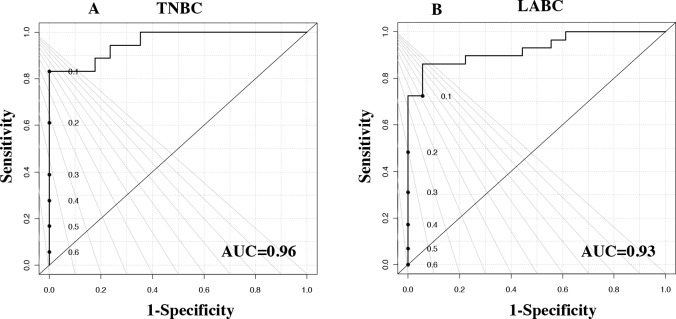
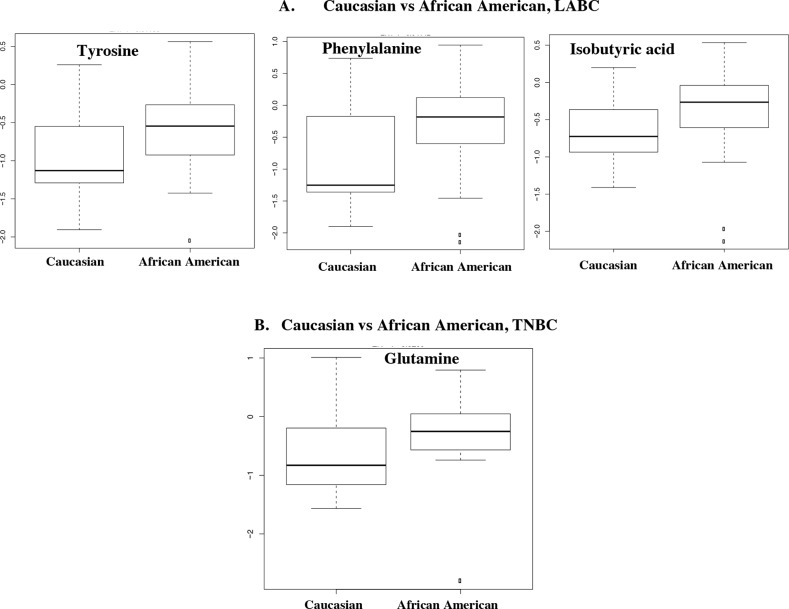
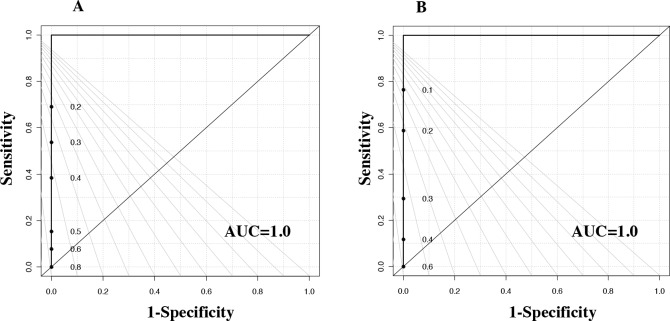
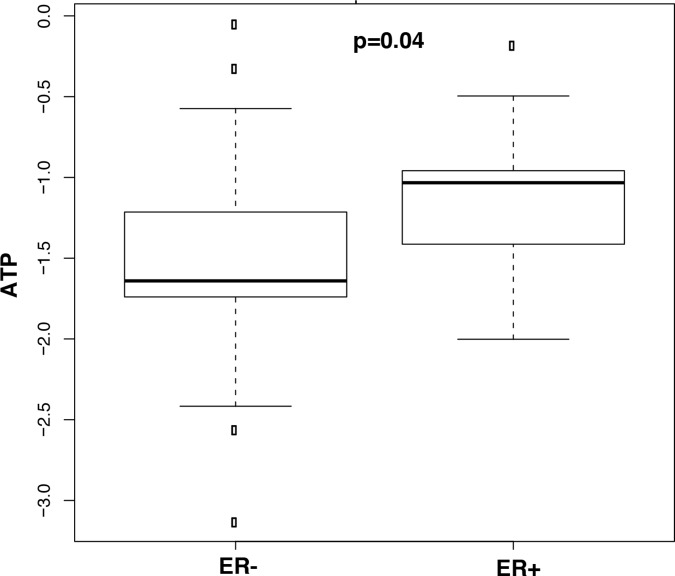
Breast cancer, a heterogeneous disease with variable pathophysiology and biology, is classified into four major subtypes. While hormonal- and antibody-targeted therapies are effective in the patients with luminal and HER-2 subtypes, the patients with triple-negative breast cancer (TNBC) subtype do not benefit from these therapies. The incidence rates of TNBC subtype are higher in African-American women, and the evidence indicates that these women have worse prognosis compared to women of European descent. The reasons for this disparity remain unclear but are often attributed to TNBC biology. In this study, we performed metabolic analysis of breast tissues to identify how TNBC differs from luminal A breast cancer (LABC) subtypes within the African-American and Caucasian breast cancer patients, respectively. We used High-Resolution Magic Angle Spinning (HR-MAS) 1H Nuclear magnetic resonance (NMR) to perform the metabolomic analysis of breast cancer and adjacent normal tissues (total n=82 samples). TNBC and LABC subtypes in African American women exhibited different metabolic profiles. Metabolic profiles of these subtypes were also distinct from those revealed in Caucasian women. TNBC in African-American women expressed higher levels of glutathione, choline, and glutamine as well as profound metabolic alterations characterized by decreased mitochondrial respiration and increased glycolysis concomitant with decreased levels of ATP. TNBC in Caucasian women was associated with increased pyrimidine synthesis. These metabolic alterations could potentially be exploited as novel treatment targets for TNBC.
Keywords: African American; Caucasian; NMR; breast cancer; triple-negative.
Conflict of interest statement
CONFLICTS OF INTEREST No potential conflicts of interest were disclosed.
Figures
Similar articles
-
LXR/RXR pathway signaling associated with triple-negative breast cancer in African American women.Breast Cancer (Dove Med Press). 2018 Dec 20;11:1-12. doi: 10.2147/BCTT.S185960. eCollection 2019. Breast Cancer (Dove Med Press). 2018. PMID: 30588086 Free PMC article.
-
Metabolic characterization of triple negative breast cancer.BMC Cancer. 2014 Dec 12;14:941. doi: 10.1186/1471-2407-14-941. BMC Cancer. 2014. PMID: 25495193 Free PMC article.
-
Immune microenvironment of triple-negative breast cancer in African-American and Caucasian women.Breast Cancer Res Treat. 2019 May;175(1):247-259. doi: 10.1007/s10549-019-05156-5. Epub 2019 Feb 6. Breast Cancer Res Treat. 2019. PMID: 30725384 Free PMC article.
-
Racial Disparities in Triple Negative Breast Cancer: A Review of the Role of Biologic and Non-biologic Factors.Front Public Health. 2020 Dec 22;8:576964. doi: 10.3389/fpubh.2020.576964. eCollection 2020. Front Public Health. 2020. PMID: 33415093 Free PMC article. Review.
-
Racial Disparity and Triple-Negative Breast Cancer in African-American Women: A Multifaceted Affair between Obesity, Biology, and Socioeconomic Determinants.Cancers (Basel). 2018 Dec 14;10(12):514. doi: 10.3390/cancers10120514. Cancers (Basel). 2018. PMID: 30558195 Free PMC article. Review.
Cited by
-
Breast Cancer Metabolomics: From Analytical Platforms to Multivariate Data Analysis. A Review.Metabolites. 2019 May 22;9(5):102. doi: 10.3390/metabo9050102. Metabolites. 2019. PMID: 31121909 Free PMC article. Review.
-
Identification of metabolic pathways contributing to ER+ breast cancer disparities using a machine-learning pipeline.Sci Rep. 2023 Jul 26;13(1):12136. doi: 10.1038/s41598-023-39215-1. Sci Rep. 2023. PMID: 37495653 Free PMC article.
-
Plasma Peptidome Pattern of Breast Cancer Using Magnetic Beads-Based Plasma Fractionation and MALDI-TOF MS: A Case Control Study in Egypt.Asian Pac J Cancer Prev. 2019 Jan 25;20(1):175-184. doi: 10.31557/APJCP.2019.20.1.175. Asian Pac J Cancer Prev. 2019. PMID: 30678429 Free PMC article.
-
Impact of the Pd2Spm (Spermine) Complex on the Metabolism of Triple-Negative Breast Cancer Tumors of a Xenograft Mouse Model.Int J Mol Sci. 2021 Oct 5;22(19):10775. doi: 10.3390/ijms221910775. Int J Mol Sci. 2021. PMID: 34639114 Free PMC article.
-
MetaboAnalyst 4.0: towards more transparent and integrative metabolomics analysis.Nucleic Acids Res. 2018 Jul 2;46(W1):W486-W494. doi: 10.1093/nar/gky310. Nucleic Acids Res. 2018. PMID: 29762782 Free PMC article.
References
-
- Bernstein L, Lacey JV. Receptors, associations, and risk factor differences by breast cancer subtypes: positive or negative? J Natl Cancer Inst. 2011;103:451–53. https://doi.org/10.1093/jnci/djr046. - DOI - PubMed
-
- Carey LA, Perou CM, Livasy CA, Dressler LG, Cowan D, Conway K, Karaca G, Troester MA, Tse CK, Edmiston S, Deming SL, Geradts J, Cheang MC, et al. Race, breast cancer subtypes, and survival in the Carolina Breast Cancer Study. JAMA. 2006;295:2492–502. https://doi.org/10.1001/jama.295.21.2492. - DOI - PubMed
-
- Dent R, Hanna WM, Trudeau M, Rawlinson E, Sun P, Narod SA. Pattern of metastatic spread in triple-negative breast cancer. Breast Cancer Res Treat. 2009;115:423–28. https://doi.org/10.1007/s10549-008-0086-2. - DOI - PubMed
-
- Clarke CA, Keegan TH, Yang J, Press DJ, Kurian AW, Patel AH, Lacey JV., Jr Age-specific incidence of breast cancer subtypes: understanding the black-white crossover. J Natl Cancer Inst. 2012;104:1094–101. https://doi.org/10.1093/jnci/djs264. - DOI - PMC - PubMed
-
- Duffy MJ, McGowan PM, Crown J. Targeted therapy for triple-negative breast cancer: where are we? Int J Cancer. 2012;131:2471–77. https://doi.org/10.1002/ijc.27632. - DOI - PubMed
LinkOut - more resources
Full Text Sources
Other Literature Sources
Research Materials
Miscellaneous
