

Prognostic significance of combined fibrinogen concentration and neutrophil-to-lymphocyte ratio in patients with resectable non-small cell lung cancer
- PMID: 29545972
- PMCID: PMC5842339
- DOI: 10.20892/j.issn.2095-3941.2017.0124
Prognostic significance of combined fibrinogen concentration and neutrophil-to-lymphocyte ratio in patients with resectable non-small cell lung cancer
Abstract
Objective: Cancer-associated inflammation and coagulation cascades play vital roles in cancer progression and survival. In this study, we investigated the significance of the combination of preoperative fibrinogen and the neutrophil-to-lymphocyte ratio (NLR) in predicting the survival of patients with non-small cell lung cancer (NSCLC).
Methods: We retrospectively enrolled 589 patients with NSCLC who underwent surgery. The univariate and multivariate Cox survival analyses were used to evaluate the prognostic indicators, including the combination of fibrinogen and NLR (F-NLR). The cut-off values for fibrinogen, NLR, and clinical laboratory variables were defined by the receiver operating characteristic (ROC) curve analysis. According to the ROC curve, the recommended cut-off values for fibrinogen and the NLR were 3.48 g/L and 2.30, respectively. Patients with both a high NLR (≥ 2.30) and hyperfibrinogenemia (≥ 3.48 g/L) were given a score of 2, whereas those with one or neither were scored as 1 or 0, respectively.
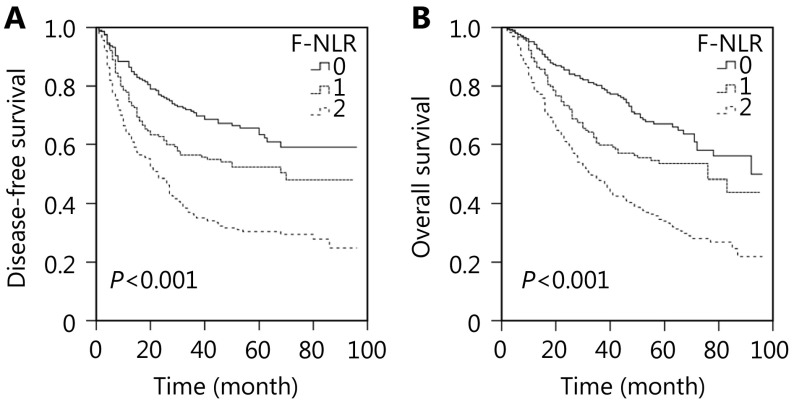
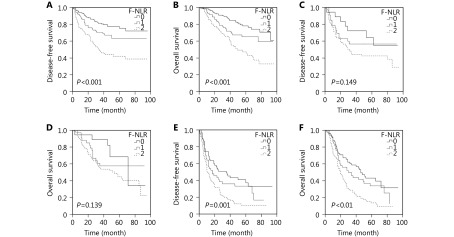
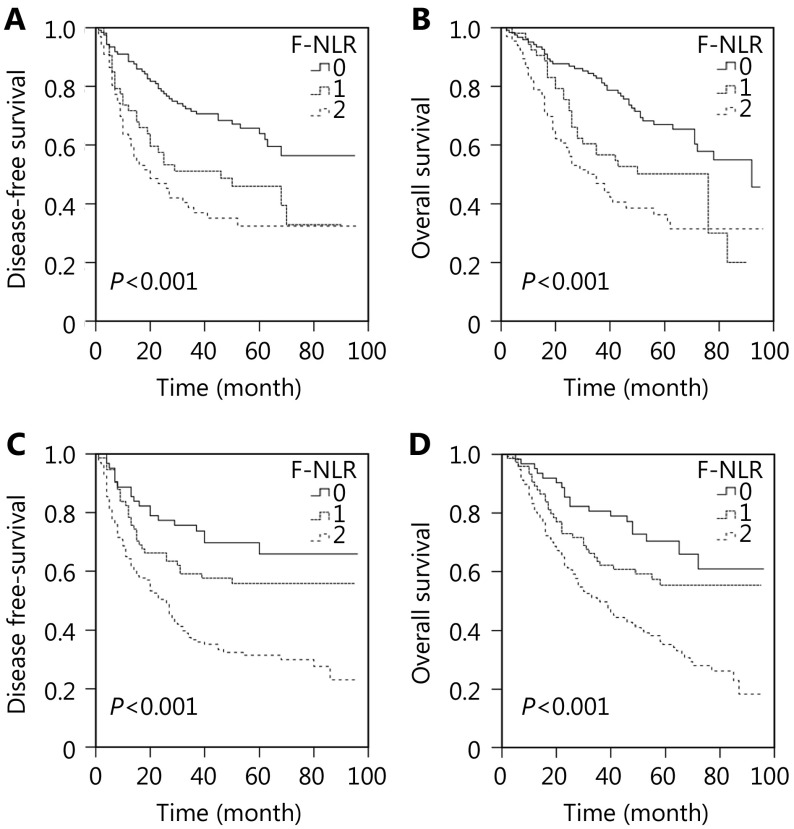
Results: Our results showed that F-NLR was an independent prognostic indicator for disease-free survival (DFS) [hazard ratio (HR), 1.466; 95% confidence interval (CI), 1.243-1.730; P < 0.001] and overall survival (OS) (HR, 1.512; 95% CI, 1.283-1.783; P < 0.001). The five-year OS rates were 66.1%, 53.5%, and 33.3% for the F-NLR = 0, F-NLR = 1, and F-NLR = 2, respectively ( P < 0.001). Correspondingly, their five-year DFS rates were 62.2%, 50.3%, and 30.4%, respectively ( P < 0.001). In the subgroup analyses of the pathological stages, the F-NLR level was significantly correlated with DFS and OS in stage I and IIIA cancers.
Conclusions: Preoperative F-NLR score can be used as a valuable prognostic marker for patients with resectable early-stage NSCLC.
Keywords: Non-small cell lung cancer; fibrinogen; prognosis; neutrophil-to-lymphocyte ratio.
Figures
Similar articles
-
Combination of preoperative fibrinogen concentration and neutrophil-to-lymphocyte ratio for prediction of the prognosis of patients with resectable breast cancer.Oncol Lett. 2020 Nov;20(5):200. doi: 10.3892/ol.2020.12061. Epub 2020 Sep 4. Oncol Lett. 2020. PMID: 32963606 Free PMC article.
-
The combination of plasma fibrinogen and neutrophil lymphocyte ratio (F-NLR) is a predictive factor in patients with resectable non small cell lung cancer.J Cell Physiol. 2018 May;233(5):4216-4224. doi: 10.1002/jcp.26239. Epub 2017 Dec 26. J Cell Physiol. 2018. PMID: 29057536
-
The Prognostic Role of a Combined Fibrinogen and Neutrophil-to-Lymphocyte Ratio Score in Patients with Resectable Hepatocellular Carcinoma: A Retrospective Study.Med Sci Monit. 2020 Jan 13;26:e918824. doi: 10.12659/MSM.918824. Med Sci Monit. 2020. PMID: 31929496 Free PMC article.
-
The Combination of Plasma Fibrinogen Concentration and Neutrophil Lymphocyte Ratio (F-NLR) as a Prognostic Factor of Epithelial Ovarian Cancer.Onco Targets Ther. 2020 Jul 27;13:7283-7293. doi: 10.2147/OTT.S264118. eCollection 2020. Onco Targets Ther. 2020. PMID: 32848410 Free PMC article.
-
The Prognostic Significance of Combined Pretreatment Fibrinogen and Neutrophil-Lymphocyte Ratio in Various Cancers: A Systematic Review and Meta-Analysis.Dis Markers. 2020 Dec 9;2020:4565379. doi: 10.1155/2020/4565379. eCollection 2020. Dis Markers. 2020. PMID: 33376559 Free PMC article.
Cited by
-
The Prognostic Value of Multiple Systemic Inflammatory Biomarkers in Preoperative Patients With Non-small Cell Lung Cancer.Front Surg. 2022 Apr 4;9:830642. doi: 10.3389/fsurg.2022.830642. eCollection 2022. Front Surg. 2022. PMID: 35445073 Free PMC article.
-
The response prediction and prognostic values of systemic inflammation response index in patients with advanced lung adenocarcinoma.Thorac Cancer. 2023 Jun;14(16):1500-1511. doi: 10.1111/1759-7714.14893. Epub 2023 May 2. Thorac Cancer. 2023. PMID: 37128769 Free PMC article.
-
Combination of preoperative fibrinogen concentration and neutrophil-to-lymphocyte ratio for prediction of the prognosis of patients with resectable breast cancer.Oncol Lett. 2020 Nov;20(5):200. doi: 10.3892/ol.2020.12061. Epub 2020 Sep 4. Oncol Lett. 2020. PMID: 32963606 Free PMC article.
-
Prognostic Impact of Using Combined Plasma Fibrinogen Level and Neutrophil-to-Lymphocyte Ratio in Resectable Non-small Cell Lung Cancer.Ann Surg Oncol. 2022 Sep;29(9):5699-5707. doi: 10.1245/s10434-022-11835-3. Epub 2022 Jun 2. Ann Surg Oncol. 2022. PMID: 35653068
-
Prognostic significance of systemic immune-inflammation index in triple-negative breast cancer.Cancer Manag Res. 2019 May 14;11:4471-4480. doi: 10.2147/CMAR.S197623. eCollection 2019. Cancer Manag Res. 2019. PMID: 31191009 Free PMC article.
References
-
- Siegel R, Ma JM, Zou ZH, Jemal A. Cancer statistics, 2014. CA Cancer J Clin. 2014;64:9–29. - PubMed
-
- Hanahan D, Weinberg RA. Hallmarks of cancer: the next generation. Cell. 2011;144:646–74. - PubMed
-
- Colotta F, Allavena P, Sica A, Garlanda C, Mantovani A. Cancer-related inflammation, the seventh hallmark of cancer: links to genetic instability. Carcinogenesis. 2009;30:1073–81. - PubMed
-
- Guthrie GJK, Charles KA, Roxburgh CSD, Horgan PG, McMillan DC, Clarke SJ. The systemic inflammation-based neutrophil-lymphocyte ratio: Experience in patients with cancer. Crit Rev Oncol Hematol. 2013;88:218–30. - PubMed
LinkOut - more resources
Full Text Sources
Other Literature Sources