. 2018 Mar 14;4(3):e1701832.
doi: 10.1126/sciadv.1701832. eCollection 2018 Mar.

Past and future drought in Mongolia

Affiliations

Past and future drought in Mongolia

Amy E Hessl et al. Sci Adv. .

Abstract

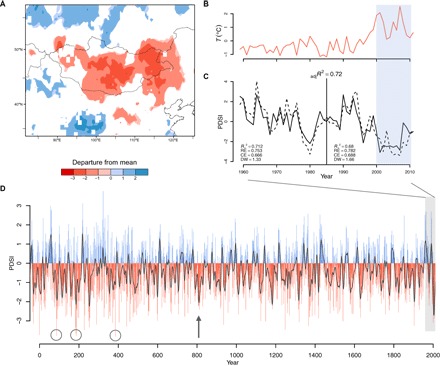
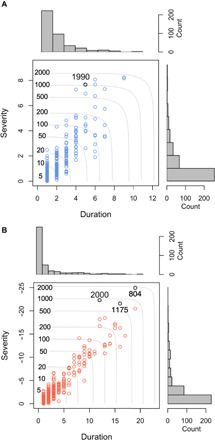
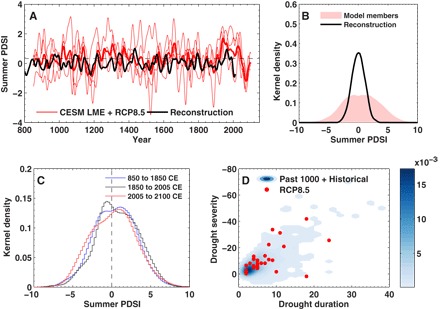
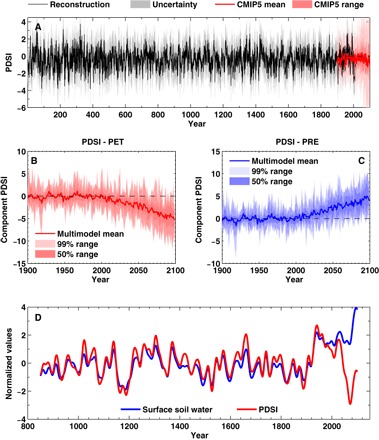
The severity of recent droughts in semiarid regions is increasingly attributed to anthropogenic climate change, but it is unclear whether these moisture anomalies exceed those of the past and how past variability compares to future projections. On the Mongolian Plateau, a recent decade-long drought that exceeded the variability in the instrumental record was associated with economic, social, and environmental change. We evaluate this drought using an annual reconstruction of the Palmer Drought Severity Index (PDSI) spanning the last 2060 years in concert with simulations of past and future drought through the year 2100 CE. We show that although the most recent drought and pluvial were highly unusual in the last 2000 years, exceeding the 900-year return interval in both cases, these events were not unprecedented in the 2060-year reconstruction, and events of similar duration and severity occur in paleoclimate, historical, and future climate simulations. The Community Earth System Model (CESM) ensemble suggests a drying trend until at least the middle of the 21st century, when this trend reverses as a consequence of elevated precipitation. Although the potential direct effects of elevated CO2 on plant water use efficiency exacerbate uncertainties about future hydroclimate trends, these results suggest that future drought projections for Mongolia are unlikely to exceed those of the last two millennia, despite projected warming.


Figures

Fig. 1
Fig. 1. The 21st-century drought.
(A) Self-calibrating Palmer Drought Severity Index (PDSI) anomalies across Asia (2000–2010 and 1959–2011 reference periods) (24). (B) Observed temperature anomalies (NASA Goddard Institute for Space Studies) (42) over Mongolia (1959–2011 reference period). (C) Reconstructed (black) and observed (dashed) PDSI with 2000–2010 drought highlighted (blue bar), and split calibration/verification period (vertical line) statistics including verification R2 (Rv2), reduction of error (RE), coefficient of efficiency (CE), Durbin-Watson statistic (DW), and overall adjR2 for entire calibration period. (D) Reconstructed PDSI (49 BCE–2011 CE). Shown are blue (PDSI > 0) and red (PDSI < 0) bars with a 15-year spline (black line) centered on the mean of the calibration period (1959–2011). More severe single-year droughts (86, 186, and 385 CE) are marked with open circles, and the severe drought beginning in 804 CE is indicated with an arrow.
Fig. 2
Fig. 2. Runs analysis and estimated return time of pluvials and droughts.
(A)Cumulative severity and duration of pluvials (blue circles) and (B) droughts (red circles) based on reconstructed continuous runs of high self-calibrating PDSI > 0 and PDSI < 0, respectively, with counts for each variable in the margins (gray bars). Contours of return time (gray) were derived from copula functions for the joint probability of severity and duration of pluvial and drought events. The pluvial beginning in 1990 and the droughts beginning in 804, 1175, and 2000 are denoted with black circles.
Fig. 3
Fig. 3. Past, present, and future drought in paleoclimate reconstructions and Community Earth System Model (CESM) model simulations.
(A) CESM Last Millennium Ensemble (LME)–simulated (red) and tree ring reconstructed (black) Penman-Monteith PDSI for Central Mongolia. Thin red lines are individual ensemble members from CESM LME that have an extension to 2100 using the Representative Concentration Pathway 8.5 (RCP8.5) scenario. The heavy red line is the ensemble mean. All time series have been smoothed with a 30-year Gaussian filter. (B) Kernel probability density estimate for the individual ensemble member simulated and the tree ring reconstructed annual PDSI values used in (A). (C) Kernel probability density estimates for the CESM LME model simulated PDSI for three periods: the last millennium (850–1850), historical (1850–2005), and future RCP8.5 (2005–2100), showing an increased occurrence of the most severe annual drought index values under the future greenhouse gas forcing scenario. (D) Bivariate kernel density of joint drought duration and severity from the CESM LME ensemble for multiyear (2 years or more) events. Blue shading shows the joint distribution for the model last millennium and historical periods, whereas red circles indicate multiyear drought events under the future RCP8.5 forcing.
Fig. 4
Fig. 4. Uncertainties in future moisture projections.
(A) Reconstructed (black) and Coupled Model Intercomparison Project Phase 5 (CMIP5)–simulated (red) PDSI. Gray shading around the reconstruction indicates uncertainty as the root mean square error of the reconstruction. Pink shading around the CMIP5 ensemble mean (red line) shows the two-tailed 99% range estimated from all individual ensemble members. (B) CMIP5-simulated PDSI–potential evapotranspiration (PET) calculated using detrended precipitation values over 2000 to 2099. (C) CMIP5-simulated PDSI precipitation (PRE) using detrended temperature, net radiation, and vapor pressure over 2000 to 2099. (D) CESM LME ensemble mean calculated PDSI (red line) compared to online simulated CESM land surface model near-surface soil moisture (blue). Both time series have been smoothed using a 30-year Gaussian filter.

References

    1. Cook B. I., Anchukaitis K. J., Touchan R., Meko D. M., Cook E. R., Spatiotemporal drought variability in the Mediterranean over the last 900 years. J. Geophys. Res. Atmos. 121, 2060–2074 (2016). - PMC - PubMed
    1. Belmecheri S., Babst F., Wahl E. R., Stahle D. W., Trouet V., Multi-century evaluation of Sierra Nevada snowpack. Nat. Clim. Change 6, 2–3 (2016).
    1. Griffin D., Anchukaitis K. J., How unusual is the 2012–2014 California drought? Geophys. Res. Lett. 41, 9017–9023 (2014).
    1. Cook B. I., Smerdon J. E., Seager R., Coats S., Global warming and 21st century drying. Clim. Dyn. 43, 2607–2627 (2014).
    1. Karnauskas K. B., Donnelly J. P., Anchukaitis K. J., Future freshwater stress for island populations. Nat. Clim. Chang. 6, 720–725 (2016).

Publication types

LinkOut - more resources