. 2018 Mar 14;4(3):eaao6369.
doi: 10.1126/sciadv.aao6369. eCollection 2018 Mar.

Divergence in problem-solving skills is associated with differential expression of glutamate receptors in wild finches

Affiliations

Divergence in problem-solving skills is associated with differential expression of glutamate receptors in wild finches

Jean-Nicolas Audet et al. Sci Adv. .

Abstract

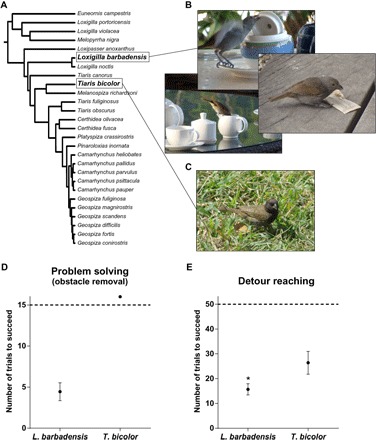
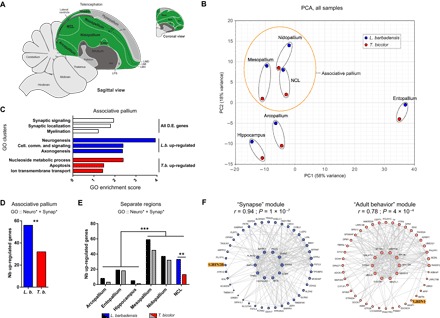
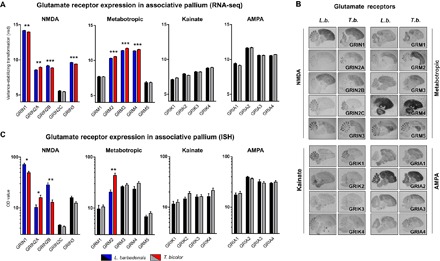
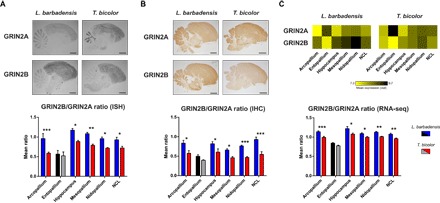
Problem solving and innovation are key components of intelligence. We compare wild-caught individuals from two species that are close relatives of Darwin's finches, the innovative Loxigilla barbadensis, and its most closely related species in Barbados, the conservative Tiaris bicolor. We found an all-or-none difference in the problem-solving capacity of the two species. Brain RNA sequencing analyses revealed interspecific differences in genes related to neuronal and synaptic plasticity in the intrapallial neural populations (mesopallium and nidopallium), especially in the nidopallium caudolaterale, a structure functionally analogous to the mammalian prefrontal cortex. At a finer scale, we discovered robust differences in glutamate receptor expression between the species. In particular, the GRIN2B/GRIN2A ratio, known to correlate with synaptic plasticity, was higher in the innovative L. barbadensis. These findings suggest that divergence in avian intelligence is associated with similar neuronal mechanisms to that of mammals, including humans.


Figures

Fig. 1
Fig. 1. Study species.
(A) Portion of the phylogenetic tree of the Thraupidae family that includes T. bicolor and L. barbadensis (38). (B) In the wild, L. barbadensis is bold, opportunistic, and highly innovative, whereas (C) T. bicolor is shy, conservative, and noninnovative. (D) Number of trials needed to complete the obstacle removal problem. L. barbadensis completed the task in a mean of 4.4 ± 1.09 trials, but none of the tested T. bicolor solved it within the 15 allocated trials. (E) The number of trials to reach the success criterion in the detour reaching task was lower in L. barbadensis (15.7 ± 2.3 trials, n = 29) than in T. bicolor (26.4 ± 4.6 trials, n = 15; *PMann-Whitney = 0.0143). Means ± SEM. Photo credit: S. Ducatez, McGill University.
Fig. 2
Fig. 2. RNA-seq analysis of L. barbadensis and T. bicolor transcriptomes.
(A) Schematic view of the avian brain (16), with the regions that were examined in this study colored in green. (B) PCA of gene expression pattern per species and per region. Individual blue (L. barbadensis) and red (T. bicolor) circles include the mean of the reads from all individuals for a given species/region. The orange outline designates the regions that form the associative pallium (mesopallium and nidopallium, including NCL). (C) Gene ontology (GO) clustering analysis of differentially expressed genes, using, separately, the whole data set of differentially expressed genes, the genes that are up-regulated in L. barbadensis (L.b.), or the genes that are up-regulated in T. bicolor (T.b.). The three clusters with the highest enrichment scores are shown (all P < 0.05 except myelination P = 0.0517). Cell. comm., cellular communication. (D) Considering only the genes that are characterized by synaptic (Synap) and neuronal (Neuro) GO terms, the number of genes that are up-regulated in L. barbadensis is higher than the number of genes that are up-regulated in T. bicolor in the associative pallium. **P < 0.01. (E) Using the same subset of genes, the number of genes that are up-regulated in L. barbadensis were compared to the number of genes that are up-regulated in T. bicolor in each of the regions. L. barbadensis had more up-regulated genes in the NCL. **P < 0.01. The total number of differentially expressed genes is significantly higher in the associative pallium than in the three other regions. ***P < 0.001. (F) Two significant constructed network modules: “Synapse” and “Adult Behavior.” See fig. S7 for all other modules. Both have a positive r value, indicating that the mean expression in the modules is higher in L. barbadensis compared to T. bicolor. Hippo, hippocampus; IH, intercalated hyperpallium; MD, dorsal mesopallium; MV, ventral mesopallium; Ento, entopallium; LSt, lateral striatum; MSt, medial striatum; B, basorostralis; LMD, lamina mesopallium dorsale; LMI, lamina mesopallium intermediate; LMV, lamina mesopallium ventrale; LPS, lamina pallio-subpallialis; Meso, mesopallium; Nido, nidopallium; Arco, arcopallium.
Fig. 3
Fig. 3. Glutamate receptor expression analysis.
(A) RNA-seq data (variance stabilizing transformation of reads) of all glutamate receptors. P values were obtained by differential expression analysis. (B) Representative autoradiography images of glutamate receptor in situ hybridizations (ISH). (C) Quantification of the signal obtained by in situ hybridization for all assessed glutamate receptors. Significantly different expression is indicated by colored bars. Means ± SEM. *P < 0.05, **P < 0.01, ***P < 0.001.
Fig. 4
Fig. 4. GRIN2A and GRIN2B expression across all brain regions.
(A) In situ hybridizations of GRIN2A and GRIN2B mRNA with their mean GRIN2B/GRIN2A ratios below, calculated with the quantifications of individual receptor expression in each region. (B) Immunohistochemistry (IHC) targeting proteins with GRIN2A- and GRIN2B-specific antibodies, with their mean GRIN2B/GRIN2A ratios below, calculated with the quantifications of individual receptor expression in each region. (C) Heatmaps of mean expression (vsd-transformed reads) for GRIN2A and GRIN2B from RNA-seq data. Bottom: Mean ratios calculated with individual receptors. Means ± SEM. *P < 0.05, **P < 0.01, ***P < 0.001. Scale bars, 500 μm.

Similar articles

Cited by

References

    1. Reader S. M., Laland K. N., Social intelligence, innovation, and enhanced brain size in primates. Proc. Natl. Acad. Sci. U.S.A. 99, 4436–4441 (2002). - PMC - PubMed
    1. Timmermans S., Lefebvre L., Boire D., Basu P., Relative size of the hyperstriatum ventrale is the best predictor of feeding innovation rate in birds. Brain Behav. Evol. 56, 196–203 (2000). - PubMed
    1. Mehlhorn J., Hunt G. R., Gray R. D., Rehkämper G., Güntürkün O., Tool-making New Caledonian crows have large associative brain areas. Brain Behav. Evol. 75, 63–70 (2010). - PubMed
    1. Healy S. D., Rowe C., A critique of comparative studies of brain size. Proc. R. Soc. Lond. B Biol. Sci. 274, 453–464 (2007). - PMC - PubMed
    1. Mace G. M., Harvey P. H., Clutton-Brock T. H., Is brain size an ecological variable? Trends Neurosci. 3, 193–196 (1980).

Publication types

Substances

LinkOut - more resources