Randomized Controlled Trial
. 2018 May 1;103(5):1910-1920.
doi: 10.1210/jc.2017-02267.

Metabolic Inflexibility Is an Early Marker of Bed-Rest-Induced Glucose Intolerance Even When Fat Mass Is Stable

Affiliations
Randomized Controlled Trial

Metabolic Inflexibility Is an Early Marker of Bed-Rest-Induced Glucose Intolerance Even When Fat Mass Is Stable

Floriane Rudwill et al. J Clin Endocrinol Metab. .

Abstract

Context: The effects of energy-balanced bed rest on metabolic flexibility have not been thoroughly examined.

Objective: We investigated the effects of 21 days of bed rest, with and without whey protein supplementation, on metabolic flexibility while maintaining energy balance. We hypothesized that protein supplementation mitigates metabolic inflexibility by preventing muscle atrophy.

Design and setting: Randomized crossover longitudinal study conducted at the German Aerospace Center, Cologne, Germany.

Participants and interventions: Ten healthy men were randomly assigned to dietary countermeasure or isocaloric control diet during a 21-day bed rest.

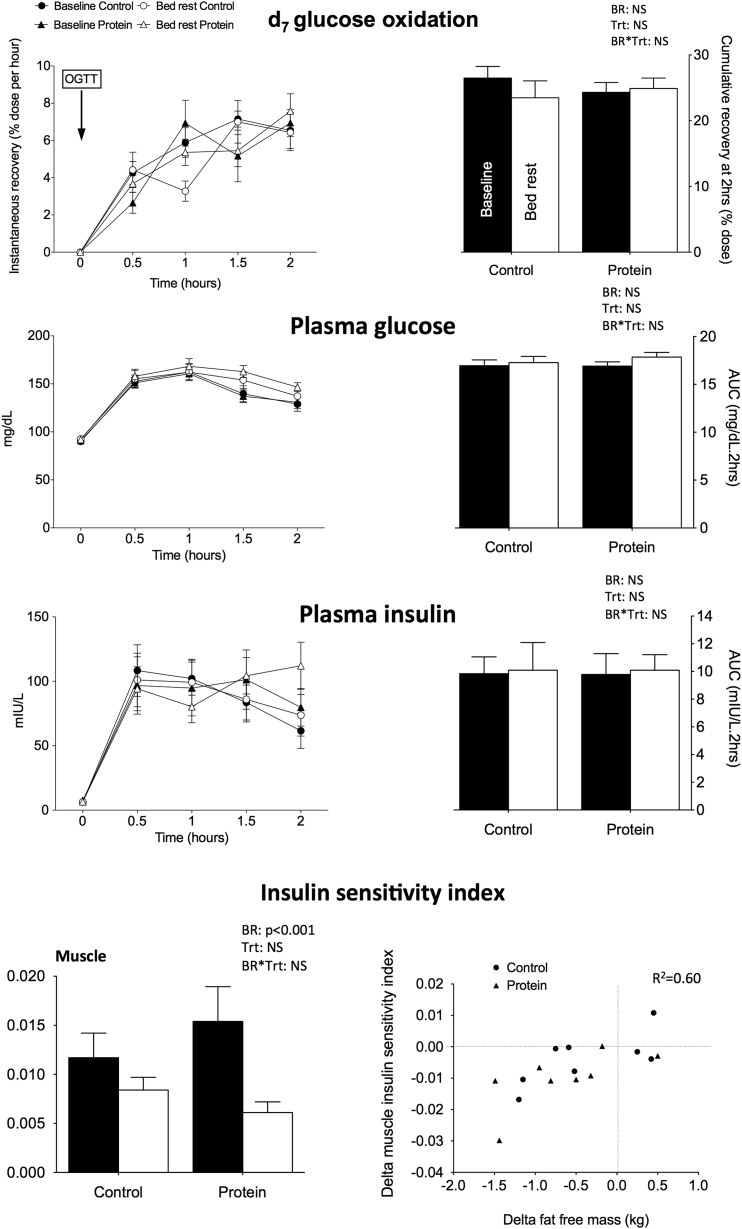
Outcome measures: Before and at the end of the bed rest, metabolic flexibility was assessed during a meal test. Secondary outcomes were glucose tolerance by oral glucose tolerance test, body composition by dual energy X-ray absorptiometry, ectopic fat storage by magnetic resonance imaging, and inflammation and oxidative stress markers.

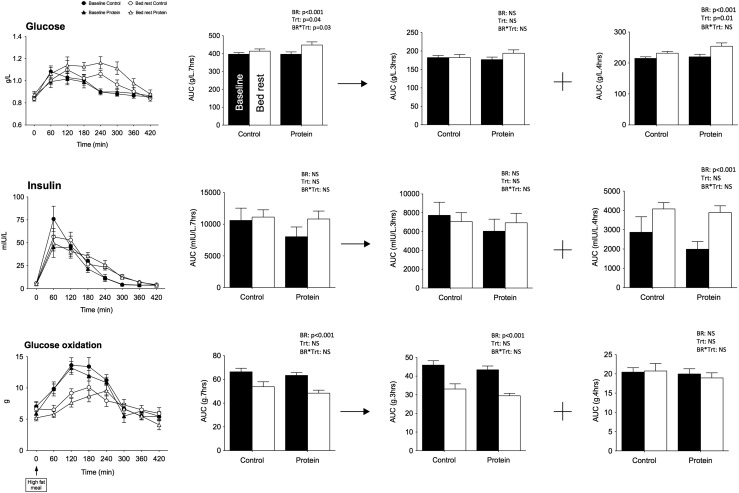
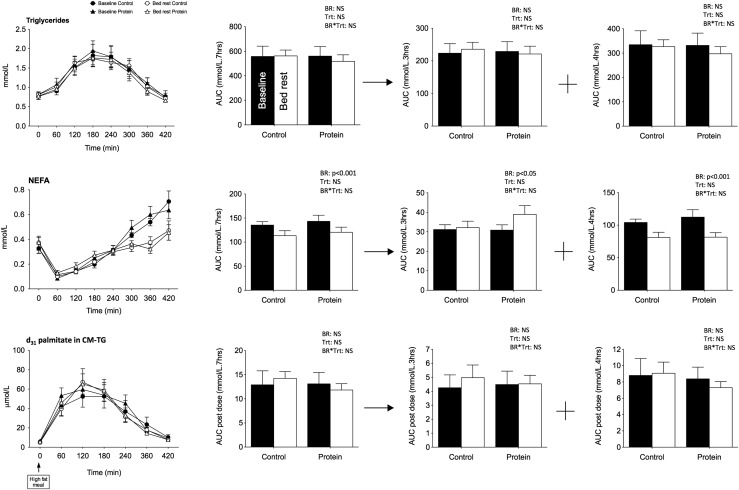
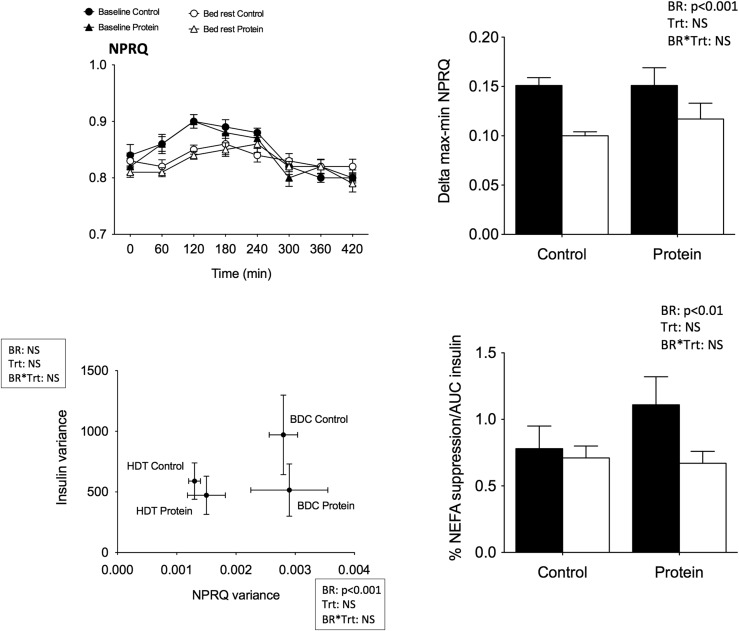
Results: Bed rest decreased the ability to switch from fat to carbohydrate oxidation when transitioning from fasted to fed states (i.e., metabolic inflexibility), antioxidant capacity, fat-free mass (FFM), and muscle insulin sensitivity along with greater fat deposition in muscle (P < 0.05 for all). Changes in fasting insulin and inflammation were not observed. However, glucose tolerance was reduced during acute overfeeding. Protein supplementation did not prevent FFM loss and metabolic alterations.

Conclusions: Physical inactivity triggers metabolic inflexibility, even when energy balance is maintained. Although reduced insulin sensitivity and increased fat deposition were observed at the muscle level, systemic glucose intolerance was detected only in response to a moderately high-fat meal. This finding supports the role of physical inactivity in metabolic inflexibility and suggests that metabolic inflexibility precedes systemic glucose intolerance.

Trial registration: ClinicalTrials.gov NCT01655979.


Figures

Figure 1.
Figure 1.
Glucose tolerance after OGTT. Mean kinetics of d7 glucose oxidation and plasma insulin and glucose of the 9 participants are presented for control and protein treatment at baseline and after 21 days of bed rest after an OGTT at 75 mg. AUCs are presented on the right side of the figure. OGTT-derived muscle insulin sensitivity index derived from plasma insulin and glucose is presented as calculated from Abdul-Ghaniet al. (21) at the right bottom of the figure. Data are means ± SEM. Statistical analyses were performed with a linear mixed effects model adjusted for period effect and controlled for repeated measures. Results are presented asP values for bed rest (BR), treatment (Trt), and BR*Trt effects.P < 0.05 is considered significant. The relationship between delta insulin sensitivity index and delta FFM is presented at the left bottom of the figure. NS, nonsignificant.
Figure 2.
Figure 2.
Plasma glucose, insulin, and glucose oxidation after lipid challenge. Mean kinetics of plasma glucose, insulin, and glucose oxidation and corresponding AUCs after a standardized fat meal (40% fat intake as energy) of the 9 participants are presented for the control and protein treatments at baseline and after bed rest. AUCs are presented over the 7-hour test and also for the first 3 hours and the last 4 hours of the test. Data are means ± SEM. Statistical analyses were performed with a linear mixed effects model adjusted for period effect and controlling for repeated measures. Results are presented asP values for bed rest (BR), treatment (Trt), and BR*Trt effects.P < 0.05 is considered significant. The relationship between delta insulin sensitivity index and delta FFM is presented at the left bottom of the figure. NS, nonsignificant.
Figure 3.
Figure 3.
Plasma triglycerides, nonesterified fatty acids, and d31 palmitate enrichment in chylomicrons after lipid challenge. Mean kinetics of plasma triglycerides and NEFA and d31 palmitate enrichment in chylomicrons observed after a standardized fat meal (40% fat intake as energy) in the 9 participants in control and protein treatments at baseline and after bed rest. AUCs are presented over 7 hours after the meal and for the first 3 hours and the last 4 hours after the meal. Data are means ± SEM. Statistical analyses were performed with a linear mixed effects model adjusted for period effect and controlled for repeated measures. Results are presented asP values for bed rest (BR), treatment (Trt), and BR*Trt effects.P < 0.05 is considered significant. NS, nonsignificant.
Figure 4.
Figure 4.
MF after lipid challenge. Upper left: Mean NPRQ kinetics over the 7 hours after ingestion of fat meal. Upper right: Mean delta max–min of NPRQ values. Lower left: Mean insulin variance values as a function of mean NPRQ variance calculated over the 7 hours after the meal. Lower right: Percentage NEFA suppression normalized by AUC insulin. Each graph represents the values from the 9 participants in the control and protein treatments at baseline (black) and after bed rest (white). Data are means ± SEM. Statistical analyses were performed with a linear mixed effects model adjusted for period effect and controlling for repeated measures. Results are presented asP values for bed rest (BR), treatment (Trt), and BR*Trt effects.P < 0.05 is considered significant. BDC, baseline data collection; HDT, head-down tilt bed rest; NS, nonsignificant.

References

    1. The world health report 2002: reducing risk, promoting healthy life. 2002. Available at:http://www.who.int/whr/2002/en. Accessed 10 July 2009. - PubMed
    1. Gratas-Delamarche A,Derbré F,Vincent S,Cillard J. Physical inactivity, insulin resistance, and the oxidative-inflammatory loop.Free Radic Res.2014;48(1):93–108. - PubMed
    1. Kelley DE,Mandarino LJ. Fuel selection in human skeletal muscle in insulin resistance: a reexamination.Diabetes.2000;49(5):677–683. - PubMed
    1. Astrup A.The relevance of increased fat oxidation for body-weight management: metabolic inflexibility in the predisposition to weight gain.Obes Rev.2011;12(10):859–865. - PubMed
    1. Kelley DE,Goodpaster B,Wing RR,Simoneau JA. Skeletal muscle fatty acid metabolism in association with insulin resistance, obesity, and weight loss.Am J Physiol.1999;277(6 Pt 1):E1130–E1141. - PubMed

Publication types

Associated data