

Metabolomics Identifies Distinctive Metabolite Signatures for Measures of Glucose Homeostasis: The Insulin Resistance Atherosclerosis Family Study (IRAS-FS)
- PMID: 29546329
- PMCID: PMC6456957
- DOI: 10.1210/jc.2017-02203
Metabolomics Identifies Distinctive Metabolite Signatures for Measures of Glucose Homeostasis: The Insulin Resistance Atherosclerosis Family Study (IRAS-FS)
Abstract
Context: Metabolomics provides a biochemical fingerprint that, when coupled with clinical phenotypes, can provide insight into physiological processes.
Objective: Survey metabolites associated with dynamic and basal measures of glucose homeostasis.
Design: Analysis of 733 plasma metabolites from the Insulin Resistance Atherosclerosis Family Study.
Setting: Community based.
Participants: One thousand one hundred eleven Mexican Americans.
Main outcome: Dynamic measures were obtained from the frequently sampled intravenous glucose tolerance test and included insulin sensitivity and acute insulin response to glucose. Basal measures included homeostatic model assessment of insulin resistance and β-cell function.
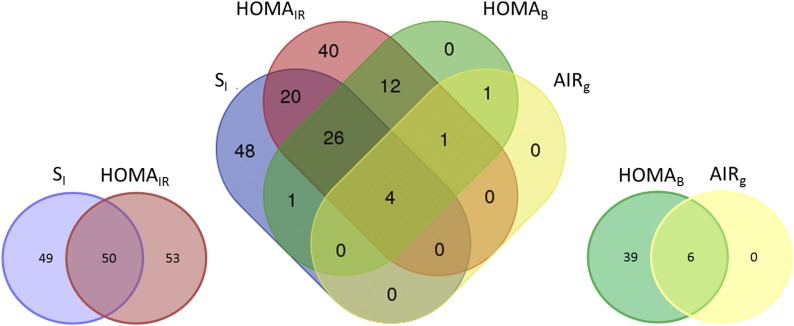
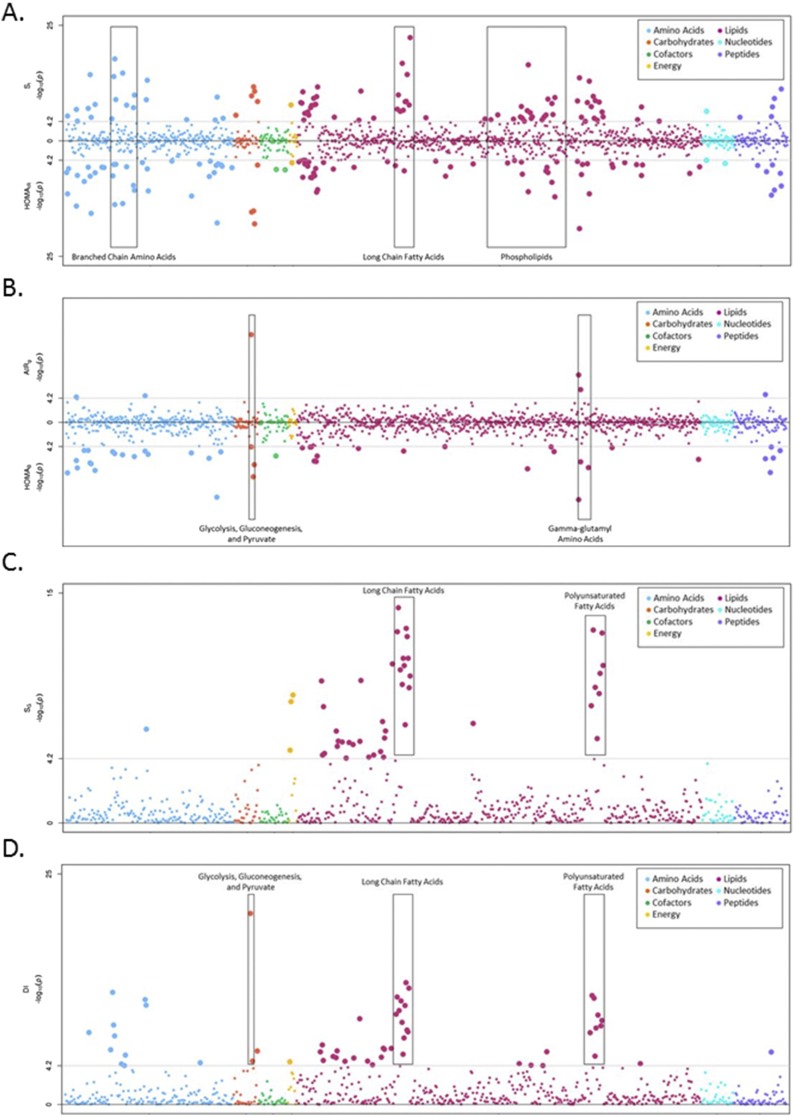
Results: Insulin sensitivity was associated with 99 metabolites (P < 6.82 × 10⁻⁵) explaining 28% of the variance (R2adj) beyond 28% by body mass index. Beyond branched chain amino acids (BCAAs; P = 1.85 × 10⁻¹⁸ to 1.70 × 10⁻⁵, R2adj = 8.1%) and phospholipids (P = 3.51 × 10⁻¹⁷ to 3.00 × 10⁻⁵, R2adj = 14%), novel signatures of long-chain fatty acids (LCFAs; P = 4.49 × 10⁻²³ to 4.14 × 10⁻⁷, R2adj = 11%) were observed. Conditional analysis suggested that BCAA and LCFA signatures were independent. LCFAs were not associated with homeostatic model assessment of insulin resistance (P > 0.024). Acute insulin response to glucose was associated with six metabolites; glucose had the strongest association (P = 5.68 × 10⁻¹⁶). Homeostatic model assessment of β-cell function had significant signatures from the urea cycle (P = 9.64 × 10⁻¹⁴ to 7.27 × 10⁻⁶, R2adj = 11%). Novel associations of polyunsaturated fatty acids (P = 2.58 × 10⁻¹³ to 6.70 × 10⁻⁵, R2adj = 10%) and LCFAs (P = 9.06 × 10⁻¹⁵ to 3.93 × 10⁻⁷, R2adj = 10%) were observed with glucose effectiveness. Assessment of the hyperbolic relationship between insulin sensitivity and secretion through the disposition index revealed a distinctive signature of polyunsaturated fatty acids (P = 1.55 × 10⁻¹² to 5.81 × 10⁻⁶; R2adj = 3.8%) beyond that of its component measures.
Conclusions: Metabolomics reveals distinct signatures that differentiate dynamic and basal measures of glucose homeostasis and further identifies new metabolite classes associated with dynamic measures, providing expanded insight into the metabolic basis of insulin resistance.
Figures
Similar articles
-
Metabolomic profiling of glucose homeostasis in African Americans: the Insulin Resistance Atherosclerosis Family Study (IRAS-FS).Metabolomics. 2023 Apr 2;19(4):35. doi: 10.1007/s11306-023-01984-1. Metabolomics. 2023. PMID: 37005925 Free PMC article.
-
Diabetes and branched-chain amino acids: What is the link?J Diabetes. 2018 May;10(5):350-352. doi: 10.1111/1753-0407.12645. Epub 2018 Feb 13. J Diabetes. 2018. PMID: 29369529
-
Combining a nontargeted and targeted metabolomics approach to identify metabolic pathways significantly altered in polycystic ovary syndrome.Metabolism. 2017 Jun;71:52-63. doi: 10.1016/j.metabol.2017.03.002. Epub 2017 Mar 8. Metabolism. 2017. PMID: 28521878 Free PMC article.
-
BCAA Metabolism and Insulin Sensitivity - Dysregulated by Metabolic Status?Mol Nutr Food Res. 2018 Mar;62(6):e1700756. doi: 10.1002/mnfr.201700756. Epub 2018 Feb 27. Mol Nutr Food Res. 2018. PMID: 29377510 Review.
-
Metabolomics and atherosclerosis.Curr Atheroscler Rep. 2010 Jul;12(4):267-72. doi: 10.1007/s11883-010-0112-9. Curr Atheroscler Rep. 2010. PMID: 20464531 Free PMC article. Review.
Cited by
-
Metabolomic profiling of glucose homeostasis in African Americans: the Insulin Resistance Atherosclerosis Family Study (IRAS-FS).Metabolomics. 2023 Apr 2;19(4):35. doi: 10.1007/s11306-023-01984-1. Metabolomics. 2023. PMID: 37005925 Free PMC article.
-
Methods for estimating insulin resistance from untargeted metabolomics data.Metabolomics. 2023 Aug 9;19(8):72. doi: 10.1007/s11306-023-02035-5. Metabolomics. 2023. PMID: 37558891 Free PMC article.
-
The Role of Elevated Branched-Chain Amino Acids in the Effects of Vertical Sleeve Gastrectomy to Reduce Weight and Improve Glucose Regulation.Cell Rep. 2020 Oct 13;33(2):108239. doi: 10.1016/j.celrep.2020.108239. Cell Rep. 2020. PMID: 33053352 Free PMC article.
-
Metabolic and Metabo-Clinical Signatures of Type 2 Diabetes, Obesity, Retinopathy, and Dyslipidemia.Diabetes. 2022 Feb 1;71(2):184-205. doi: 10.2337/db21-0490. Diabetes. 2022. PMID: 34732537 Free PMC article.
-
Mutational signature analyses in multi-child families reveal sources of age-related increases in human germline mutations.Commun Biol. 2024 Nov 6;7(1):1451. doi: 10.1038/s42003-024-07140-2. Commun Biol. 2024. PMID: 39506086 Free PMC article.
References
-
- Kahn SE, Prigeon RL, McCulloch DK, Boyko EJ, Bergman RN, Schwartz MW, Neifing JL, Ward WK, Beard JC, Palmer JP. Quantification of the relationship between insulin sensitivity and β-cell function in human subjects. Evidence for a hyperbolic function. Diabetes. 1993;42(11):1663–1672. - PubMed
-
- Matthews DR, Hosker JP, Rudenski AS, Naylor BA, Treacher DF, Turner RC. Homeostasis model assessment: insulin resistance and β-cell function from fasting plasma glucose and insulin concentrations in man. Diabetologia. 1985;28(7):412–419. - PubMed
-
- Song Y, Manson JE, Tinker L, Howard BV, Kuller LH, Nathan L, Rifai N, Liu S. Insulin sensitivity and insulin secretion determined by homeostasis model assessment and risk of diabetes in a multiethnic cohort of women: the Women’s Health Initiative Observational Study. Diabetes Care. 2007;30(7):1747–1752. - PMC - PubMed
-
- DeFronzo RA, Tobin JD, Andres R. Glucose clamp technique: a method for quantifying insulin secretion and resistance. Am J Physiol. 1979;237(3):E214–E223. - PubMed
-
- Saad MF, Anderson RL, Laws A, Watanabe RM, Kades WW, Chen YD, Sands RE, Pei D, Savage PJ, Bergman RN. A comparison between the minimal model and the glucose clamp in the assessment of insulin sensitivity across the spectrum of glucose tolerance. Insulin Resistance Atherosclerosis Study. Diabetes. 1994;43(9):1114–1121. - PubMed
Publication types
MeSH terms
Substances
Grants and funding
LinkOut - more resources
Full Text Sources
Other Literature Sources
Medical
