Observational Study
. 2018 Oct;56(10):1757-1770.
doi: 10.1007/s11517-017-1776-x. Epub 2018 Mar 16.

Novel characterization method of impedance cardiography signals using time-frequency distributions

Affiliations
Observational Study

Novel characterization method of impedance cardiography signals using time-frequency distributions

Jesús Escrivá Muñoz et al. Med Biol Eng Comput. 2018 Oct.

Abstract

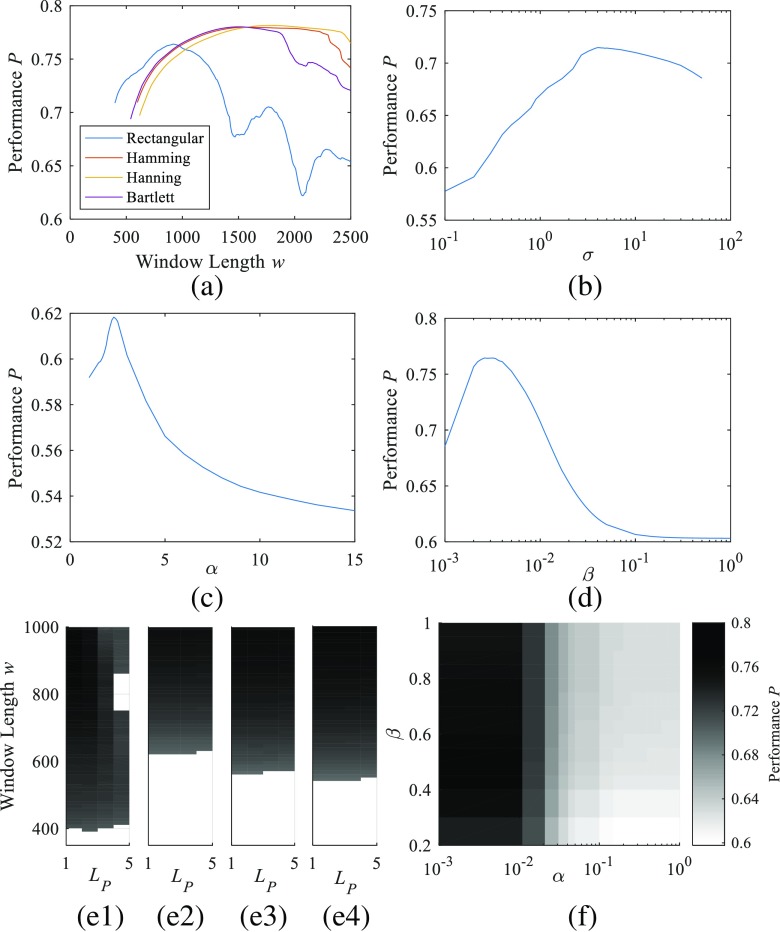
The purpose of this document is to describe a methodology to select the most adequate time-frequency distribution (TFD) kernel for the characterization of impedance cardiography signals (ICG). The predominant ICG beat was extracted from a patient and was synthetized using time-frequency variant Fourier approximations. These synthetized signals were used to optimize several TFD kernels according to a performance maximization. The optimized kernels were tested for noise resistance on a clinical database. The resulting optimized TFD kernels are presented with their performance calculated using newly proposed methods. The procedure explained in this work showcases a new method to select an appropriate kernel for ICG signals and compares the performance of different time-frequency kernels found in the literature for the case of ICG signals. We conclude that, for ICG signals, the performance (P) of the spectrogram with either Hanning or Hamming windows (P = 0.780) and the extended modified beta distribution (P = 0.765) provided similar results, higher than the rest of analyzed kernels. Graphical abstract Flowchart for the optimization of time-frequency distribution kernels for impedance cardiography signals.

Keywords: Impedance cardiography; Time-frequency distributions.


Conflict of interest statement

All procedures performed in studies involving human participants were in accordance with the ethical standards of the institutional and/or national research committee and with the 1964 Helsinki declaration and its later amendments or comparable ethical standards.

Figures

Graphical abstract
Graphical abstract
Flowchart for the optimization of time-frequency distribution kernels for impedance cardiography signals.
Fig. 1
Fig. 1
Five most frequent patterns in an ICG recording calculated with a correlation threshold of 0.85
Fig. 2
Fig. 2
Fourier model of the ICG pattern: original ICG template (dashed blue) and an approximation of two tones of the Fourier model (red). Characteristic points B, C, and X are marked on the ICG curve
Fig. 3
Fig. 3
ICG signals with a constant IF (a) and a linear frequency variation (b) synthetized with two tones
Fig. 4
Fig. 4
Periodograms of the synthetized ICG signals with no frequency variation (a) and with a linear frequency variation (b). Each instantaneous frequency is plotted individually (in color) and the total resulting spectra are also included (in black)
Fig. 5
Fig. 5
Performance optimization results: the resulting performance P of the spectrograms (a), ZAM distribution (b), CWD (c), MBD (d), SM (e), and EMBD (f) for varying parameters is plotted. The SM is optimized for a rectangular (e1), Hamming (e2), Hanning (e3), and Bartlett (e4) windows
Fig. 6
Fig. 6
a A time slice at t = 5 s of the TFD with the characteristic points As1,Ax,A2,As2, and frequency bands V1 and V2 in red of the two tones and the cross tones for the calculation of the performance P. b The resulting optimized TFD. c Location of the resulting first (in blue) and second (in red) IFs, IF1, and IF2 against the theoretical results (in black), for each type of analyzed TFD: spectrogram with a Bartlett window (1), CWD (2), and EMBD (3)
Fig. 7
Fig. 7
Results to noise tests. a and b show the performance P of several TFDs to different SNR rates and c shows the root mean square error (MSE) in the detection of the first instantaneous frequency
Fig. 8
Fig. 8
Main ICG pattern for all patients in the data base. X-axis is normalized time and Y-axis is normalized ICG. Patterns have been normalized to the same time duration in the X-axes

References

    1. Saugel B, Cecconi M, Wagner JY, Reuter DA. Noninvasive continuous cardiac output monitoring in perioperative and intensive care medicine. Br J Anaesth. 2015;114(4):562–575. doi: 10.1093/bja/aeu447. - DOI - PubMed
    1. Bundgaard-Nielsen M, Ruhnau B, Secher NH, Kehlet H. Flow-related techniques for preoperative goal-directed fluid optimization. Br J Anaesth. 2007;98(1):38–44. doi: 10.1093/bja/ael287. - DOI - PubMed
    1. Truijen J, van Lieshout JJ, Wesselink WA, Westerhof BE. A recent meta-analysis comprehensively. J Clin Monit Comput. 2012;26(4):267–278. doi: 10.1007/s10877-012-9375-8. - DOI - PMC - PubMed
    1. Rivers E, Nguyen B, Havstad S, Ressler J, Muzzin A, Knoblich B, Peterson E, Tomlanovich M, Early Goal-Directed Therapy Collaborative Group Early goal-directed therapy in the treatment of severe sepsis and septic shock. N Engl J Med. 2001;345(19):1368–1377. doi: 10.1056/NEJMoa010307. - DOI - PubMed
    1. Gan TJ, Soppitt A, Maroof M, el-Moalem H, Robertson KM, Moretti E, Dwane P, Glass PSA. Goal-directed intraoperative fluid administration reduces length of hospital stay after major surgery. Anesthesiology. 2002;97(4):820–826. doi: 10.1097/00000542-200210000-00012. - DOI - PubMed

Publication types

LinkOut - more resources