

The diversity of ice algal communities on the Greenland Ice Sheet as revealed by oligotyping
- PMID: 29547098
- PMCID: PMC5885011
- DOI: 10.1099/mgen.0.000159
The diversity of ice algal communities on the Greenland Ice Sheet as revealed by oligotyping
Abstract
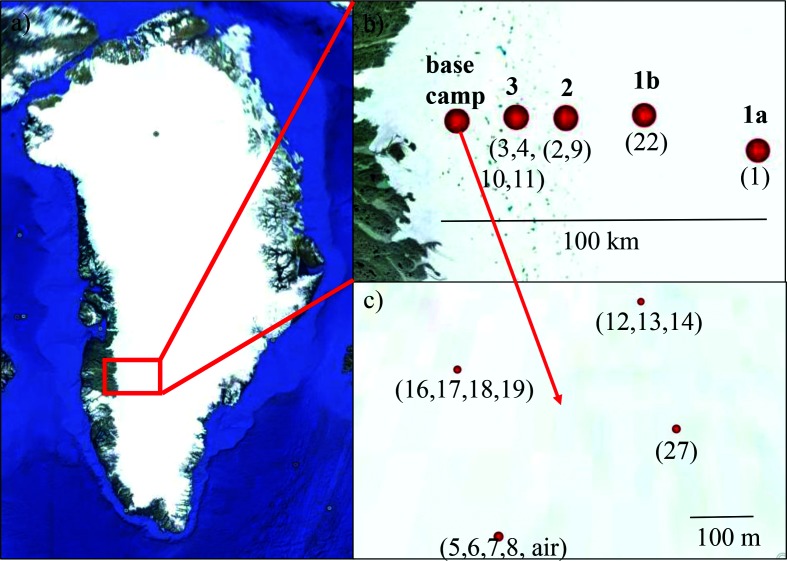
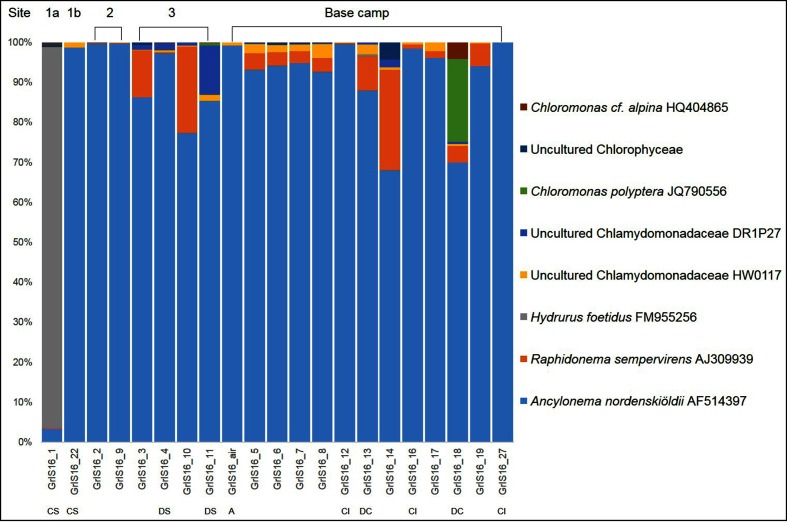
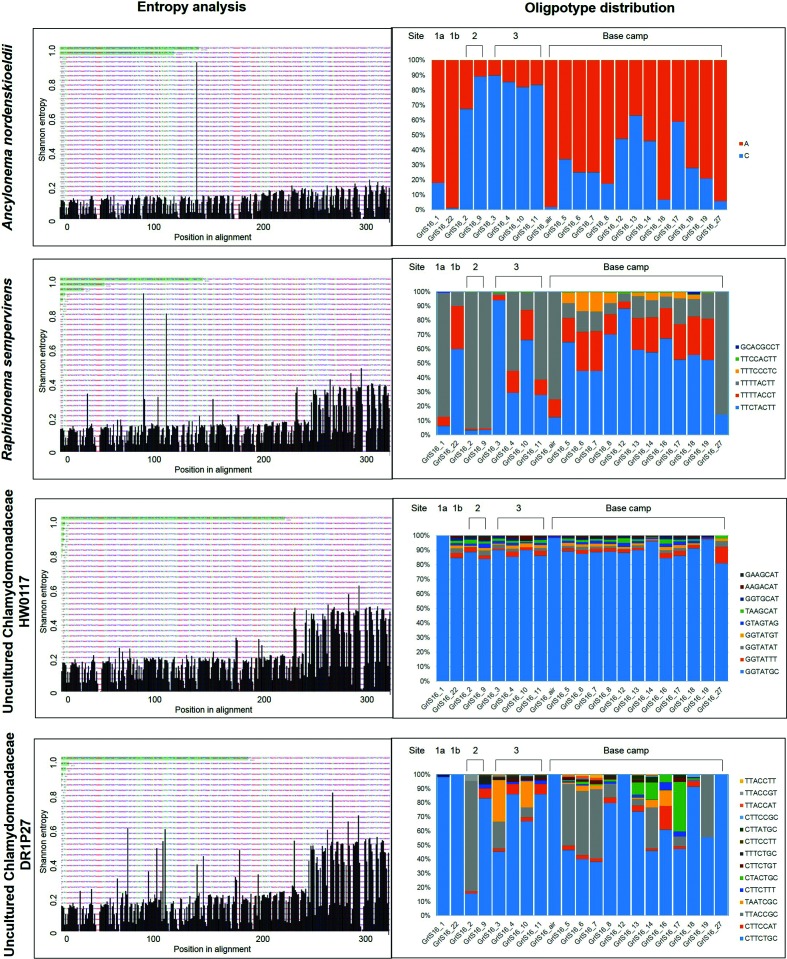
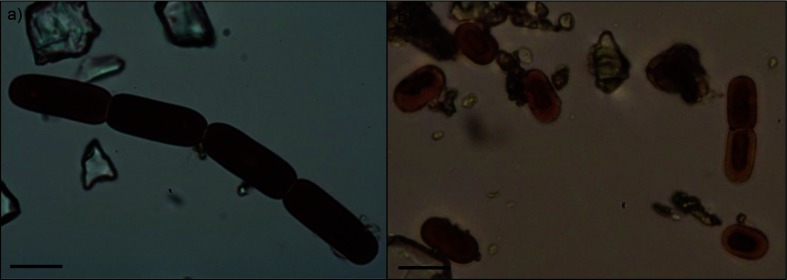
The Arctic is being disproportionally affected by climate change compared with other geographic locations, and is currently experiencing unprecedented melt rates. The Greenland Ice Sheet (GrIS) can be regarded as the largest supraglacial ecosystem on Earth, and ice algae are the dominant primary producers on bare ice surfaces throughout the course of a melt season. Ice-algal-derived pigments cause a darkening of the ice surface, which in turn decreases albedo and increases melt rates. The important role of ice algae in changing melt rates has only recently been recognized, and we currently know little about their community compositions and functions. Here, we present the first analysis of ice algal communities across a 100 km transect on the GrIS by high-throughput sequencing and subsequent oligotyping of the most abundant taxa. Our data reveal an extremely low algal diversity with Ancylonema nordenskiöldii and a Mesotaenium species being by far the dominant taxa at all sites. We employed an oligotyping approach and revealed a hidden diversity not detectable by conventional clustering of operational taxonomic units and taxonomic classification. Oligotypes of the dominant taxa exhibit a site-specific distribution, which may be linked to differences in temperatures and subsequently the extent of the melting. Our results help to better understand the distribution patterns of ice algal communities that play a crucial role in the GrIS ecosystem.
Keywords: Greenland Ice Sheet; Ice algae; Illumina; OTU; albedo; oligotyping.
Conflict of interest statement
The authors declare that there are no conflicts of interest.
Figures
References
-
- Shiklomanov IA. World fresh water resource. In: Gleick PH, editor. Water Crisis: A Guide to World Fresh Water Resources. Oxford University Press; 1993. (editor)
-
- Nghiem SV, Hall DK, Mote TL, Tedesco M, Albert MR, et al. The extreme melt across the Greenland ice sheet in 2012. Geophys Res Lett. 2012;39 doi: 10.1029/2012GL053611. - DOI
-
- Nordenskiöld AE. I.—Account of an Expedition to Greenland in the year 1870. Geol Mag. 1872;9:289–306. doi: 10.1017/S0016756800465143. - DOI
-
- Nordenskjöld NE. Cryoconite found 1870, July 19th– 25th, on the inland ice, east of Auleitsivik Fjord, Disco Bay, Greenland. Geol Mag Decad. 1875;2:157–162.
Publication types
MeSH terms
Substances
LinkOut - more resources
Full Text Sources
Other Literature Sources