. 2018 Mar 15;69(6):938-952.e6.
doi: 10.1016/j.molcel.2018.02.018.

CDK and MAPK Synergistically Regulate Signaling Dynamics via a Shared Multi-site Phosphorylation Region on the Scaffold Protein Ste5

Affiliations

CDK and MAPK Synergistically Regulate Signaling Dynamics via a Shared Multi-site Phosphorylation Region on the Scaffold Protein Ste5

María Victoria Repetto et al. Mol Cell. .

Abstract

We report an unanticipated system of joint regulation by cyclin-dependent kinase (CDK) and mitogen-activated protein kinase (MAPK), involving collaborative multi-site phosphorylation of a single substrate. In budding yeast, the protein Ste5 controls signaling through a G1 arrest pathway. Upon cell-cycle entry, CDK inhibits Ste5 via multiple phosphorylation sites, disrupting its membrane association. Using quantitative time-lapse microscopy, we examined Ste5 membrane recruitment dynamics at different cell-cycle stages. Surprisingly, in S phase, where Ste5 recruitment should be blocked, we observed an initial recruitment followed by a steep drop-off. This delayed inhibition revealed a requirement for both CDK activity and negative feedback from the pathway MAPK Fus3. Mutagenesis, mass spectrometry, and electrophoretic analyses suggest that the CDK and MAPK modify shared sites, which are most extensively phosphorylated when both kinases are active and able to bind their docking sites on Ste5. Such collaborative phosphorylation can broaden regulatory inputs and diversify output dynamics of signaling pathways.

Keywords: Cdc28; Cks1; Cln2; G protein; Ste4; cyclin; mating; pheromone; signal transduction; start.


Conflict of interest statement

Declaration of Interests

The authors declare no competing interests.

Figures

Figure 1
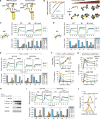
Figure 1. Single-cell assays reveal cell cycle stage-specific recruitment dynamics
(A) Pheromone stimulates plasma membrane recruitment of Ste5, which binds Gβγ (via its RING-H2 domain) and membrane phospholipids (via its PM domain). (B) At the G1 to S transition, CDK inhibits Ste5 by phosphorylating sites near the PM domain (C) Negative feedback from the MAPK Fus3 dampens Ste5 recruitment via an unknown target. (D) Membrane recruitment dynamics. Black lines show mean results. Thin colored lines show individual cell traces, to illustrate variability. In these and all related plots, Ste5-YFPx3 membrane recruitment was calculated as the ratio of surface to volume fluorescence, and expressed as the increase after pheromone stimulation. See Method Details. AU, arbitrary units. (E) Cell cycle stage classification was based on localization of fluorescent Whi5 (orange) and/or on morphology before and after stimulation with α factor (αF). G1 cells are unbudded, have nuclear Whi5, and remain unbudded 15 minutes after stimulation (at which time a mating projection may form, as shown); post-Start cells are also initially unbudded, but have cytoplasmic Whi5 (Doncic et al., 2011) and produce a bud despite stimulation; S-phase cells have a small or incipient bud at the time of stimulation. (F) Ste5 recruitment dynamics at distinct stages of the G1 to S phase transition. Note the “peak and decline” behavior in post-Start and S-phase cells. (G) Cell-to-cell variation is explained by two variables: initial recruitment and extent of decline. The dashed line defines two categories: declines < 50% or > 50%. A third category contains cells with no recruitment (i.e., below 0.06 initial recruitment, within that shown by 98% of untreated cells). Right, three examples (i-iii) of single cell dynamics (grey, raw data; orange, exponential fit — see Method Details). (H) Histograms show the distribution of cells along each measurement axis from panel G. Dashed lines mark the category thresholds used throughout this study. (I) Distribution of cells among three recruitment categories, at each cell cycle stage. Strain: VRY5013.
Figure 2
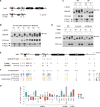
Figure 2. Both CDK and MAPK activities are required to regulate Ste5 recruitment
(A) Ste5 domain structure, interactions, and SP/TP phosphorylation motifs. Below, mutations tested in subsequent panels. (B) Initial recruitment requires the PM domain. The ΔPM and PM*memb mutants are defective at membrane binding; PM*nuc is specifically defective in nuclear localization (Winters et al., 2005). Here, and in all similar charts elsewhere, plots of recruitment vs. time show the mean (dark line) ± 95%CI (shaded). Strains: MWY003, MWY012, MWY050, MWY015. (C) The Ste5-8A mutation disrupts the S phase-specific decline. Strains: MWY003, MWY029 (D) S-phase decline requires both Fus3 and Cdc28 activity. Strains: VRY5013, VRY5090, MWY003, MWY090. (E) Ste5 recruitment in cells lacking Fus3 (Δfus3) or the G1 cyclins Cln1 and Cln2 (cln1Δ cln2Δ PMET3-CLN2 cells, transferred to +Met medium 60 min. before the experiment). Also see Figure S2A-B. Strains: MWY003, VRY3839, MWY130.
Figure 3
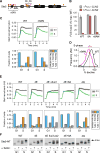
Figure 3. CDK and MAPK co-regulate the same target domain in Ste5
(A) Alternate models for collaborative regulation by CDK and MAPK. (B) In the “shared target” model, the number of sites phosphorylated is a composite function of both Cln1/2-CDK and MAPK activity levels. (C) For Ste5-16E, recruitment is blocked, and the role of Fus3 is bypassed. The 16E mutation replaces 8 SP/TP motifs with 8 EE motifs (see cartoon), which mimics constitutive phosphorylation at the 8 N-terminal sites. Strains: MWY003, MWY009, VRY5058. (D) For Ste5-8E, initial recruitment is normal but decline behavior is disrupted. The 8E mutation replaces each of the 8 N-terminal sites with single E residues (see cartoon), which partly mimics phosphorylation while preventing further modification. Strains: MWY001, MWY052, VRY5755. (E) Ste5 recruitment is blocked by induction of PGAL1-CLN2. Strains: MWY136, VRY4095. The stronger block in S phase is likely because PGAL1-CLN2 is supplemented by CLN1 and CLN2 genes expressed from their native loci. (F) Initial recruitment and Fus3 activation increase as CDK activity is reduced. Cln2-CDK activity was varied by inducing PGAL1-CLN2 expression in cdc28-as2 cells, and then adding varying doses of 1NM-PP1. Top, initial recruitment (mean ± 95% CI); see Figure S3F-G for extended data. Strains: MWY136, VRY4095. Bottom, Fus3 activation (mean ± SEM; n = 3). (G) Fus3 phosphorylation (mean ± SEM; n = 3) in cdc28-as2 cells (MWY090) synchronized by α factor arrest and release. At times of peak or low Cln2 levels (45 or 75 min., respectively; see Figure S3G), cells were treated with 1NM-PP1 (5 min.) then re-stimulated with α factor. (H) PGAL1-STE11ΔN-STE7 activates Fus3 without pheromone. Cells were induced with galactose (75 min.), then treated ± α factor (5 min.); note, prolonged pathway signaling activates FUS3 gene expression, yielding elevated Fus3 protein levels in lanes on the right. (I) Pre-activation of Fus3 by PGAL1-STE11ΔN-STE7 blocks initial Ste5 recruitment in S-phase cells. Strains: MWY003, MWY259. (J) Histograms of initial recruitment in galactose-treated cells from panel I. Dashed line marks the “no recruitment” threshold. Asterisk, p = 7 × 10⁻⁸.
Figure 4
Figure 4. Collaborative phosphorylation and mass spectrometry analysis
(A) Diagram of Ste5 and the Ste5-NT fragment used in mobility shift assays of phosphorylation. (B) Cultures of cdc15-2 cells (MWY198) harboring HA-tagged Ste5-NT were synchronized by M-phase arrest and release. At times shown, cells were incubated ± α factor for 5 min. Ste5- NT mobility, Cln2-myc levels, and MAPK phosphorylation were assayed by immunoblotting. The arrow marks maximally shifted forms that require both Cln2 and pheromone. (C) The Ste5-8A mutation reduces phosphorylation by pheromone or cell cycle alone, and prevents the maximal shift in the combined case. Note, the 8A mutation is present only in the HA-tagged Ste5-NT fragment, not in full-length Ste5 that mediates pheromone response. (D) Strains (MWY198, MWY325, MWY333) were synchronized and then treated briefly with 1NM-PP1 prior to incubation ± α factor. Note that Fus3 and Cdc28 mediate effects of α factor and cell cycle, respectively, and that both are required for the maximal shift. Pheromone also has a Fus3-independent effect; see Figure S4F and Figure S6C. (E) Summary of mass spectrometry data on Ste5 phosphorylation in vivo. For details, see Table S2 and Figure S5. To assess pheromone effects, G1 cells were compared ± α factor. To assess cell cycle effects, untreated G1- and S-phase cells were compared. Tick marks denote all detected phosphorylated sites, which include some that could not be quantified. Arrows show sites with elevated phosphorylation (> 1.5x): red, SP/TP sites; grey, other sites; unfilled arrowheads, increases detected in only 1 of 3 experiments. (F) Heat map plots show changes in the abundance of unphosphorylated and phosphorylated peptides, grouped into phosphoislands (see Method Details). Large reductions in unphosphorylated peptides indicate extensively phosphorylated regions. (G) Ratio of phosphorylation at SP/TP sites after pheromone treatment vs. cell cycle entry. Bars, mean values; black dots, values from individual biological replicates. “ox”: oxidized peptide generated during sample preparation.
Figure 5
Figure 5. Role of pheromone and Fus3 is independent of the four central SP/TP sites
(A) Diagram of phosphorylation sites studied below. (B) The Ste5-n9AN mutation does not prevent signaling from being blocked by PGAL1-CLN2. Bars (mean ± SD; n = 3) measure a pheromone-inducible transcription reporter, FUS1-lacZ. (C) The Ste5-n9AN mutant shows a partial defect in S-phase decline behavior. Strains: MWY003, MWY336. (D) Histogram of declines in S-phase cells from panel C. Note that the Ste5-n9AN mutant is shifted to lower decline. Asterisk, p = 4 × 10⁻⁸. Dashed line marks the 50% decline threshold used in bar graphs of panel C. Strains: MWY003, MWY336. (E) Recruitment of Ste5 with mutations (4E, 4Q) at the 4 central SP/TP sites, thought to be Fus3 targets. The 4E mutant was also analyzed in fus3Δ cells and combined with mutations at the 8 N-terminal sites (4E+8A). Strains: MWY003, MWY057, VRY3841, MWY160, MWY353. (F) Ste5-NT phosphorylation results for mutants in the corresponding panel above. Note that achieving the maximal shift here correlates with the S-phase decline behavior above.
Figure 6
Figure 6. Regulatory roles for kinase docking motifs and phospho-Thr residues
(A) Docking motifs for Cln1/2 (LP motif) and Fus3 (D motif), and their mutations (llpp or ND). (B) Mutations in LP and D motifs reveal that maximal Ste5-NT phosphorylation requires docking of the CDK and MAPK. Note, mutations are present only in the HA-tagged Ste5-NT fragment, and not in the endogenous Ste5. (C) Recruitment results for Ste5 with mutations in the LP, D, or both motifs. Strains: MWY003, MWY153, MWY040, MWY169. (D) Signaling by Ste5 mutants in G1 vs. S phase. Cultures were synchronized by α factor arrest and release. After 15 min. (G1) or 45 min. (S), aliquots were briefly re-stimulated with α factor. Strains: MWY001, MWY006, MWY355, MWY038, MWY168, MWY052. (E) Early Fus3 phosphorylation kinetics (mean ± SEM, n = 6) in Ste5 mutant strains expressing PGAL1-CLN2 (pPP3376). Strains, as in panel D. (F) The 8SP mutant has three TP sites replaced with SP. Inset: cyclin-CDK complexes include a Cks1 subunit with a phospho-threonine (P-Thr) binding pocket. (G) Ste5-8SP shows a partial defect in the S-phase decline behavior. Strains: MWY003, MWY278. (H) Histogram of Ste5 declines in S-phase cells from panel G. Asterisk, p = 1 × 10⁻¹⁰. (I) Cell cycle-dependent mobility shift of Ste5-NT is altered by the 8SP mutation, both alone and in the context of the 4E mutation (which eliminates remaining SP/TP sites).
Figure 7
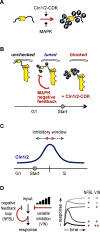
Figure 7. Models for collaborative regulation of Ste5 by CDK and MAPK inputs
(A) CDK and MAPK jointly contribute to full multi-site phosphorylation. (B) Cell cycle regulation and negative feedback operate via same phosphorylation sites. Regulatory consequences can range from mildly tuned to strongly blocked, depending on cell cycle stage. (C) Cooperative regulation can broaden the inhibitory window by allowing strong inhibition of Ste5 at sub-peak levels of Cln1/2. (D) A generalized signaling circuit combining negative feedback with variable inhibition (left) can yield a range of response behaviors (right).

Similar articles

Cited by

References

    1. Alon U. An Introduction to Systems Biology: Design Principles of Biological Circuits. Chapman & Hall/CRC Mathematical & Computational Biology; Chapman & Hall; 2006.
    1. Alvaro CG, Thorner J. Heterotrimeric G Protein-coupled Receptor Signaling in Yeast Mating Pheromone Response. J Biol Chem. 2016;291:7788–7795. - PMC - PubMed
    1. Bardwell L. A walk-through of the yeast mating pheromone response pathway. Peptides. 2005;26:339–350. - PMC - PubMed
    1. Bhaduri S, Pryciak PM. Cyclin-specific docking motifs promote phosphorylation of yeast signaling proteins by G1/S Cdk complexes. Curr Biol. 2011;21:1615–1623. - PMC - PubMed
    1. Bhattacharyya RP, Remenyi A, Good MC, Bashor CJ, Falick AM, Lim WA. The Ste5 scaffold allosterically modulates signaling output of the yeast mating pathway. Science. 2006;311:822–826. - PubMed

Publication types

MeSH terms

Substances

LinkOut - more resources