

ADHD, depression, and motor vehicle crashes: A prospective cohort study of continuously-monitored, real-world driving
- PMID: 29547761
- PMCID: PMC5889746
- DOI: 10.1016/j.jpsychires.2018.02.026
ADHD, depression, and motor vehicle crashes: A prospective cohort study of continuously-monitored, real-world driving
Abstract
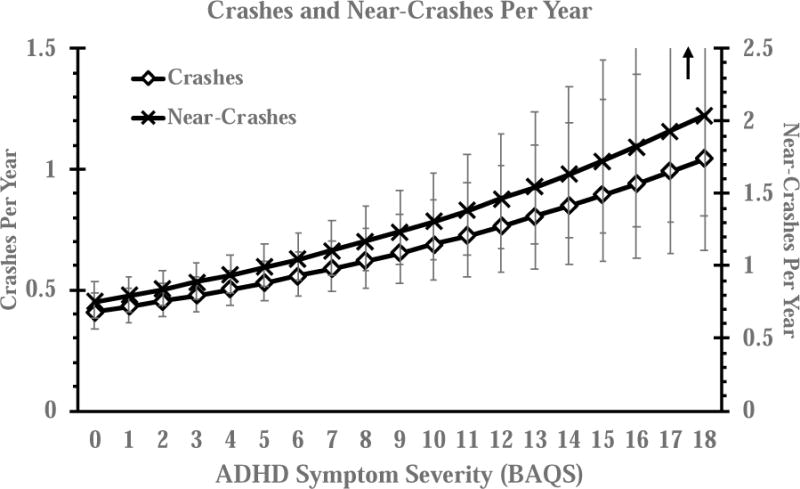
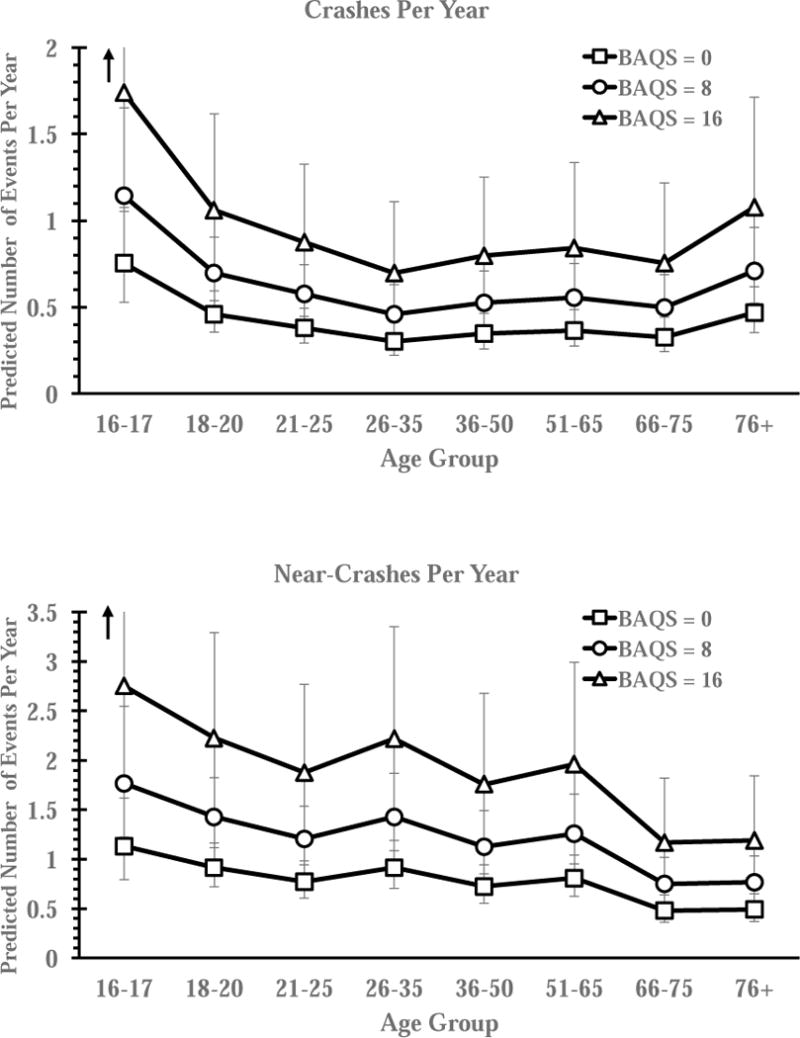
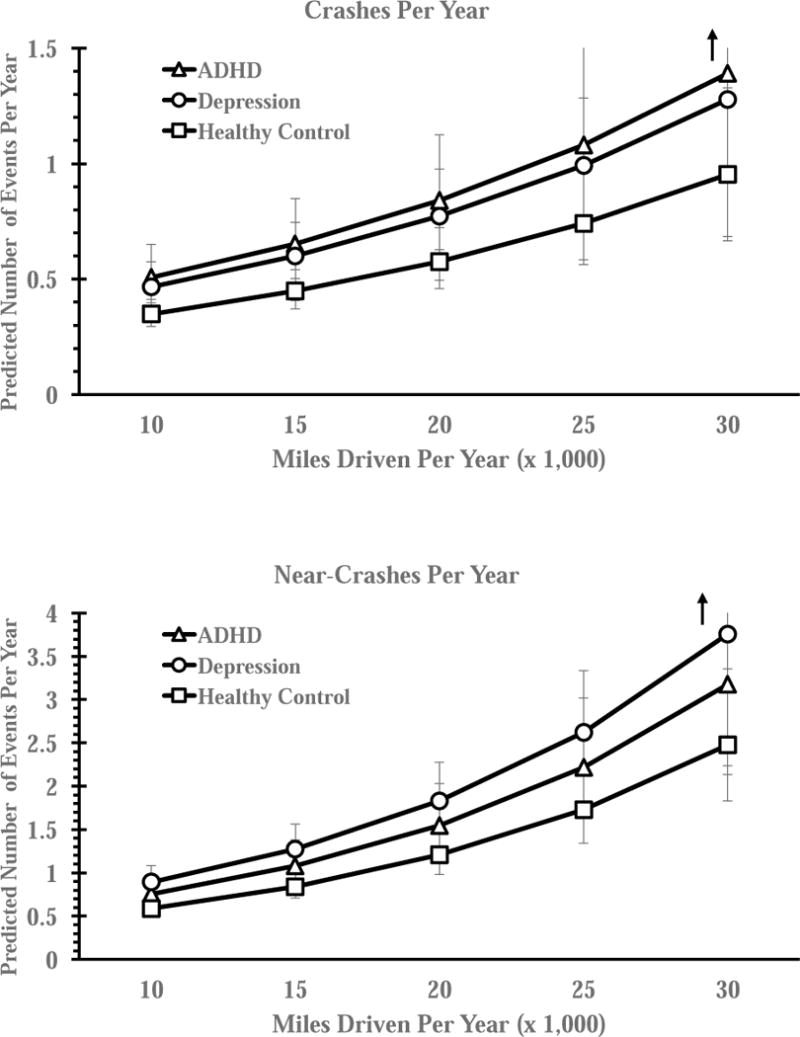
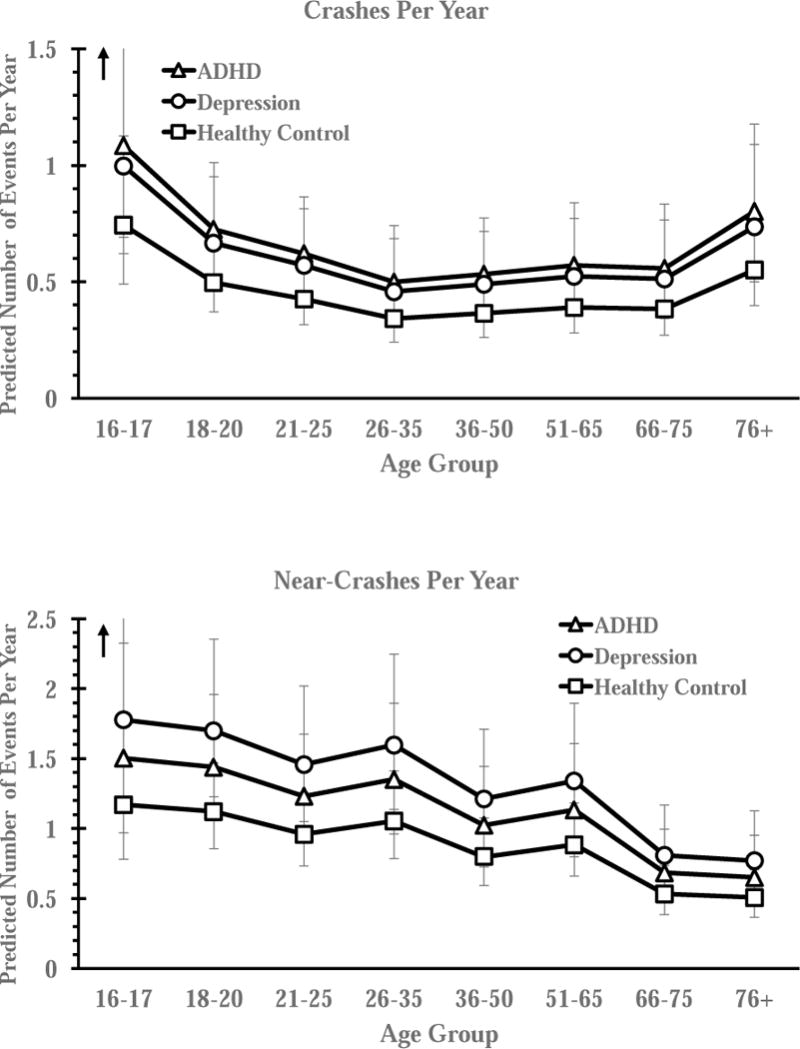
ADHD is associated with automobile crashes, traffic fatalities, and serious road trauma, but it is unclear whether this risk is (a) driven by ADHD symptoms specifically, and (b) unique to ADHD or transdiagnostic across psychiatric disabilities, such as depression, that also have concentration problems as core symptoms. The current study provides the first prospective, continuously-monitored evaluation of crash risk related to ADHD symptoms, including the first on-road comparison of ADHD with another high-prevalence psychiatric disability (depression). A probability-based sample of 3226 drivers from six U.S. sites, including subsamples with self-reported ADHD (n = 274) and depression (n = 251), consented to have their vehicles outfitted with sophisticated data acquisition technologies to continuously monitor real-world, day-to-day driving from 'engine-on to engine-off' for 1-2 years (Mean = 440 consecutive days/driver, Mean = 9528 miles/driver). Crashes and near-crashes were objectively identified via software-based algorithms and double-coded manual validation (blinded to clinical status). Miles driven, days monitored, age, gender, education, and marital status were controlled. ADHD symptoms portended 5% increased crash risk per increase in symptom severity score (IRR = 1.05). This risk corresponded to approximately 1 biennial crash and 1 annual near-crash per driver with ADHD; crash risk doubled for drivers reporting ADHD symptom severity near the sample's maximum. Analyses based on self-reported clinical status indicated similarly elevated rates for ADHD (IRR = 1.46) and depression (IRR = 1.34) that may be related, in part, to both groups' inattention/concentration symptoms. Risk was not attenuated by ADHD usual treatment, but varied according to antidepressant medication status. Previous studies have significantly underestimated the risk for traffic crashes conveyed by ADHD and depression.
Keywords: ADHD; Accidents; Depression; Motor vehicle driving; Prospective; SHRP-2.
Copyright © 2018 Elsevier Ltd. All rights reserved.
Figures
References
-
- Centers for Disease Control and Prevention, National Center for Injury Prevention and Control. Web-based Injury Statistics Query and Reporting System (WISQARS) Fatal Injury Data. 2016 Accessed from https://www.cdc.gov/injury/wisqars/overview/key_data.html 08/31/2017.
-
- Bulmash EL, Moller HJ, Kayumov L, Shen J, Wang X, Shapiro CM. Psychomotor disturbance in depression: assessment using a driving simulator paradigm. J Affect Disord. 2006;93(1):213–218. - PubMed
-
- Cox DJ, Madaan V, Cox BS. Adult attention-deficit/hyperactivity disorder and driving: why and how to manage it. Curr Psychiatry Rep. 2011;13(5):345–50x. - PubMed
-
- Vaa T. ADHD and relative risk of accidents in road traffic: A meta-analysis. Accident Anal Prev. 2014;62:415–425. - PubMed
MeSH terms
Grants and funding
LinkOut - more resources
Full Text Sources
Other Literature Sources
Medical
