. 2018 Feb;97(2-1):022416.
doi: 10.1103/PhysRevE.97.022416.

Defect-facilitated buckling in supercoiled double-helix DNA

Affiliations

Defect-facilitated buckling in supercoiled double-helix DNA

Sumitabha Brahmachari et al. Phys Rev E. 2018 Feb.

Abstract

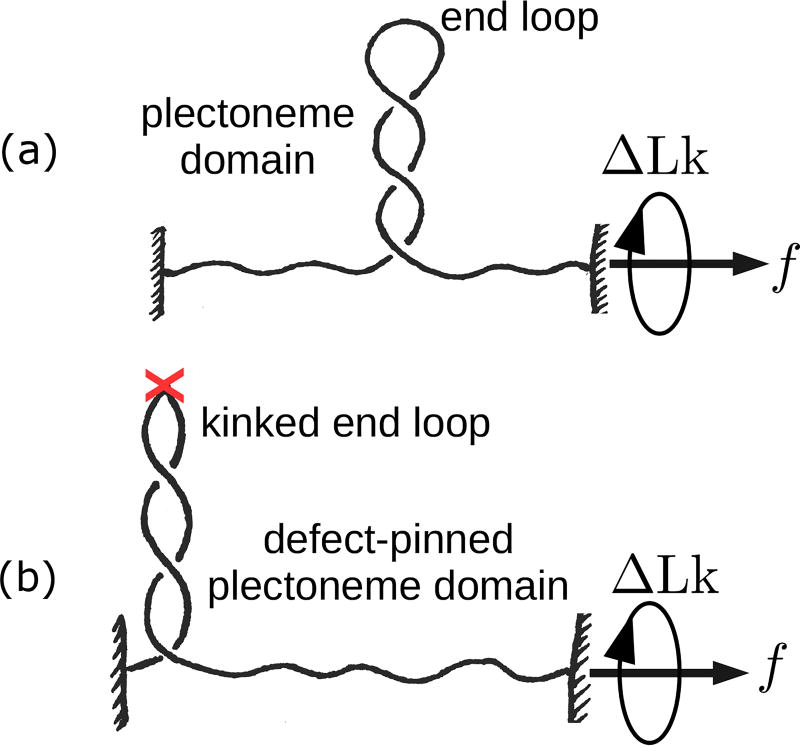
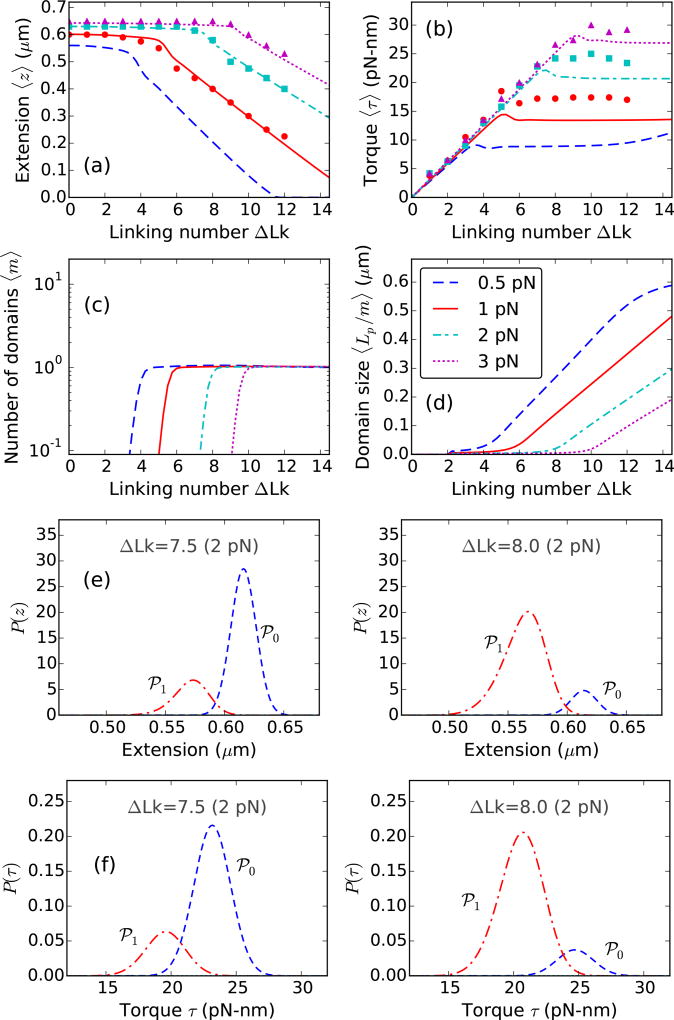
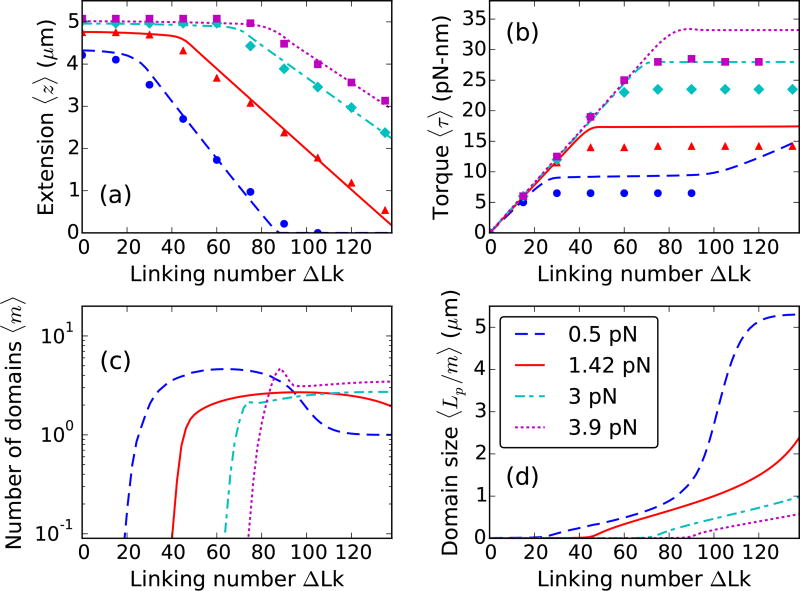
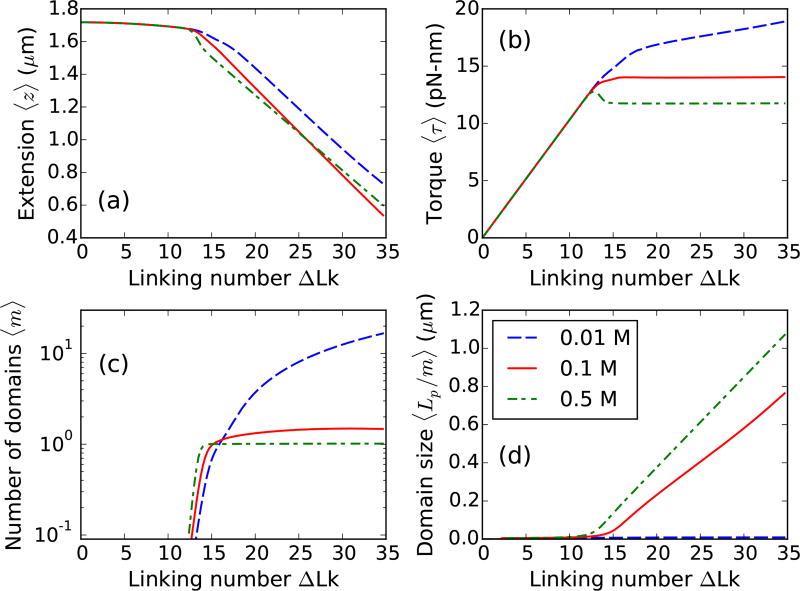
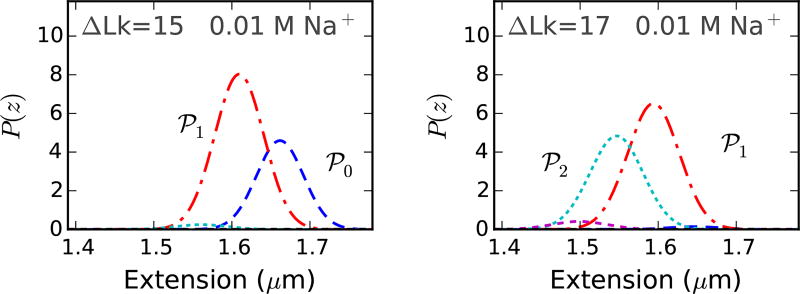
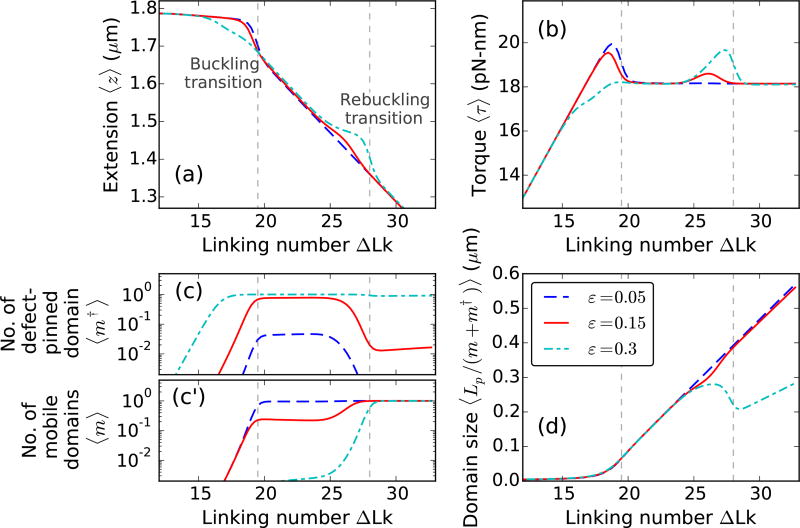
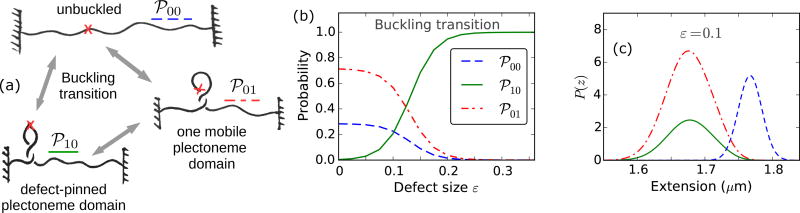
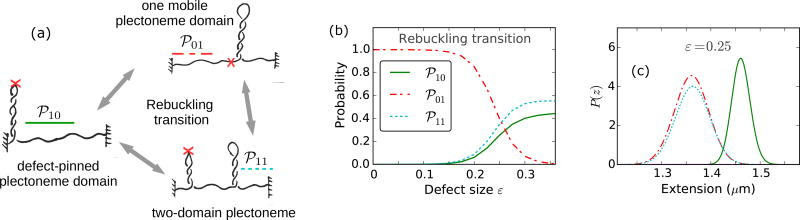
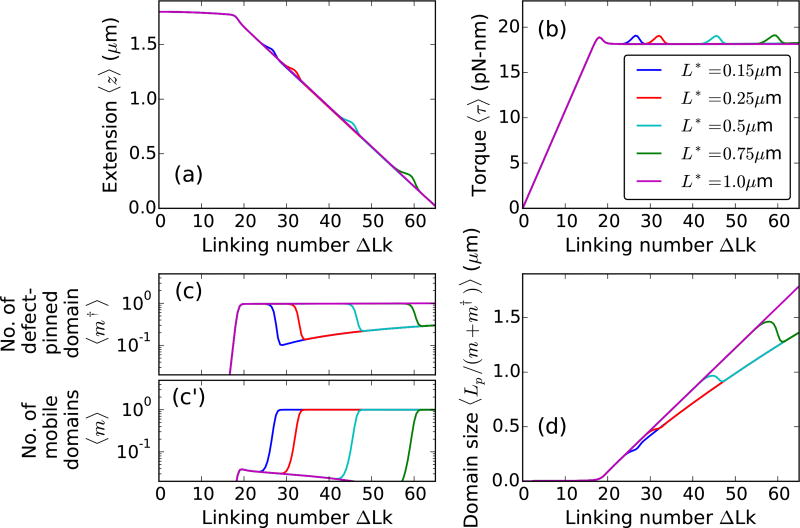
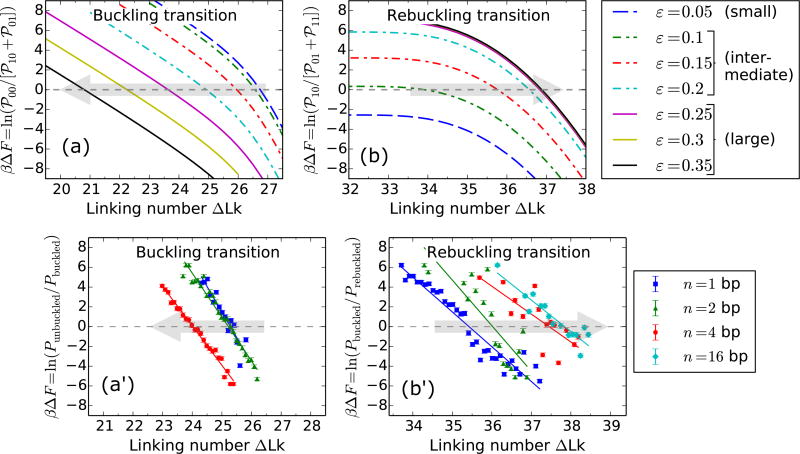
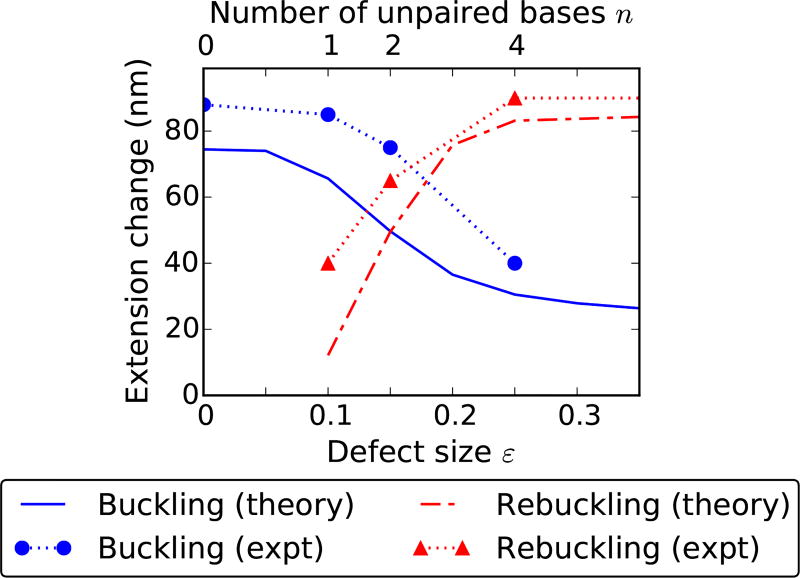
We present a statistical-mechanical model for stretched twisted double-helix DNA, where thermal fluctuations are treated explicitly from a Hamiltonian without using any scaling hypotheses. Our model applied to defect-free supercoiled DNA describes the coexistence of multiple plectoneme domains in long DNA molecules at physiological salt concentrations (≈0.1M Na^{+}) and stretching forces (≈1pN). We find a higher (lower) number of domains at lower (higher) ionic strengths and stretching forces, in accord with experimental observations. We use our model to study the effect of an immobile point defect on the DNA contour that allows a localized kink. The degree of the kink is controlled by the defect size, such that a larger defect further reduces the bending energy of the defect-facilitated kinked end loop. We find that a defect can spatially pin a plectoneme domain via nucleation of a kinked end loop, in accord with experiments and simulations. Our model explains previously reported magnetic tweezer experiments [A. Dittmore et al., Phys. Rev. Lett. 119, 147801 (2017)PRLTAO0031-900710.1103/PhysRevLett.119.147801] showing two buckling signatures: buckling and "rebuckling" in supercoiled DNA with a base-unpaired region. Comparing with experiments, we find that under 1 pN force, a kinked end loop nucleated at a base-mismatched site reduces the bending energy by ≈0.7 k_{B}T per unpaired base. Our model predicts the coexistence of three states at the buckling and rebuckling transitions, which warrants new experiments.


Figures

FIG. 13
FIG. 13
Schematic of the orthonormal triad (1o, 1⊥r, 1⊥θ), where ê shows the axis of the plectoneme superhelix.
FIG. 1
FIG. 1
(a) Schematic of stretched defect-free double-helix DNA plectonemically buckled under torsional stress. A plectoneme domain contains an end loop that is associated with a nucleation cost of the domain. (b) DNA with a defect located on its contour (denoted by an ‘X’). The defect allows a localized DNA kink that favors nucleation of a defect-pinned plectoneme domain characterized by an energy-saving kinked end loop. However, the immobile nature of the defect spatially pins the domain costing diffusion entropy.
FIG. 2
FIG. 2
Theoretical curves for supercoiled 0.7 µm (≈2 kb) DNA molecule, stretched under 0.5 (blue dashed lines), 1 (red solid lines), 2 (cyan dot-dashed lines), and 3 pN (magenta dotted lines) applied forces at 0.15 M Na+. Experimental data reproduced from Ref. [8] are plotted for 1 (red circles), 2 (cyan squares), and 3 pN (magenta triangles). (a) Extension versus linking number, shows a flat unbuckled regime at lower linking numbers. Extension decreases steeply at higher linking numbers corresponding to coexistence of a plectoneme state. The extension discontinuity connecting the two slopes corresponds to the buckling transition. (b) Torque increases linearly in the unbuckled state, and then saturates as a part of the DNA buckles to form plectoneme. Constant torque in the plectoneme coexistence state is due to the writhe contribution of the plectoneme geometry that screens DNA twist. The small overshoot in torque as well as the discontinuity in extension near the buckling transition point is related to the end loop-introduced nucleation cost of a plectoneme domain. (c) Equilibrium number of plectoneme domains grows to unity at the buckling transition point, showing nucleation of a plectoneme domain. (d) Average plectoneme domain size increases after the buckling point, indicating addition of superhelical turns to the buckled domain. Probability density of (e) extension and (f) torque near the buckling point is bimodal [ΔLk=7.5 and 8.0 under 2 pN force]. The modes of the distributions at higher extension and torque correspond to the unbuckled state (℘0, blue dashed lines); whereas, the lower extension and torque modes correspond to the one-domain plectoneme state (℘1, red dot-dashed lines). The probability distributions show an increase in the average occupancy of the buckled state (℘1) as the linking number is increased near the buckling point.
FIG. 3
FIG. 3
Theoretical curves for supercoiled 5.4 µm (≈ 16 kb) DNA, stretched under 0.5 (blue dashed lines), 1.42 (red solid lines), 3 (cyan dot-dashed lines), and 3.9 pN (magenta dotted lines) forces at 0.1 M Na+. Experimental data for 0.5 (blue circles), 1.42 (red triangles), 3 (cyan diamonds), and 3.9 pN (magenta squares) are reproduced from Ref. [9]. (a) Extension and (b) Torque plotted as a function of linking number show twisting behavior at lower linking numbers and plectoneme buckling at higher linking numbers. (c) Equilibrium number of plectoneme domains show proliferation of multiple plectoneme domains in the coexistence state. At higher forces, long molecules show a non-monotonic increase in the number of plectoneme domains at the buckling transition due to the large entropy associated with plectoneme diffusion. However, in the purely-plectoneme state (i.e., the zero extension state, refer to the 0.5 pN case, at linking numbers ≳ 90), high stability of plectoneme superhelices and absence of diffusion entropy results in favoring a single plectoneme domain. Torque in the purely-plectoneme state increases because the DNA twist increases. (d) The steepness in the increase of the average domain size increases in the purely-plectoneme state due to coalescence of plectoneme domains.
FIG. 4
FIG. 4
Effect of salt concentration on defect-free DNA. Supercoiled 2µm DNA at 1 pN stretching force under 0.01 (blue dashed line), 0.1 (red solid line), and 0.5 M Na+ (green dot-dashed line). (a) Extension and (b) Torque shows a more rounded buckling transition for lower salts due to lower stability of plectoneme superhelices. Note that the torque increases in the buckled state for lower salts corresponding to increase of DNA twist due to less twist screening by unstable plectoneme superhelices. (c) Number of plectoneme domains increase in the buckled state for lower salts, whereas, the buckled state is constituted of a single plectoneme domain at higher salts. (d) Average size of a domain increases in the higher salt case. For lower salts, proliferation of multiple domains lead to a very small domain size in the buckled state.
FIG. 5
FIG. 5
Probability density of extension at 0.01MNa+ under 1 pN force near the buckling transition for a 2 µm DNA (≈ 6 kb) [Fig. 4]. The extension distribution is bimodal, however, the two modes, corresponding to unbuckled DNA (℘0, blue dashed line) and one plectoneme domain (℘1, red dot-dashed line), are less resolved at lower salts due to increased fluctuations. The probability distribution remains bimodal after the buckling point, due to appearance of multidomain plectoneme states (e.g., the two domain state ℘2, cyan dotted line at ΔLk=17). Decreased stability of the plectoneme superhelix at lower salts result in coexistence of multiple plectoneme domains. Increasing the linking number in the buckled state increases the probability of occupancy of a plectoneme state with a larger number of domains.
FIG. 6
FIG. 6
Supercoiling 2µm DNA (≈ 6 kb) with a defect of size ε = 0.05 (blue dashed lines), 0.15 (red solid lines), and 0.3 (cyan dot-dashed lines) located L* = 150 nm (≈ 450 bp) from the surface, under 2 pN stretching force and 0.5 M Na+. The buckling transition is associated with nucleation of a plectoneme domain, whereas, the rebuckling transition is due to a maximum-size constraint on the defect-pinned plectoneme domain [1]. (a) Extension and (b) Torque versus linking number curves show, respectively, a sharp decrease and an overshoot at the buckling and rebuckling transition points. The magnitudes of torque overshoot and extension jump, associated with the nucleation cost at the transition, decrease with increasing defect size ε for the buckling transition; whereas, at the rebuckling point, they increase with increasing size of the defect. (c) Equilibrium number of pinned plectoneme domain shows an appearance of the defect-pinned plectoneme at the buckling point, however, probability of nucleating the defect-pinned domain is vanishingly small for small defects (ε < 0.1). Near the rebuckling point, the defect-pinned domain is stable only for large defects (ε > 0.25). (c′) Equilibrium number of mobile plectoneme domains shows that a mobile domain is favored at the buckling point only when the defect is small; for larger defects, a mobile domain does not appear before the rebuckling point. This suggests that the rebuckling transition does not occur for small defects. (d) Average size of a plectoneme domain shows an increase after the buckling point. Rebuckling transition occurs when the size of the defect-pinned domain is 2L* or 0.3 µm. Near the rebuckling point, for larger defects, the average size of a domain shows an abrupt decrease due to nucleation of a mobile plectoneme domain. The vertical dashed lines correspond to buckling and rebuckling transitions [see Figs. 7 and 8], however, note that the critical linking numbers for the transitions are defect size dependent [Fig. 10].
FIG. 7
FIG. 7
Buckling transition for various defect sizes. (a) Schematic of the three possible states at the buckling transition: unbuckled state (℘00, blue dashed line), defect-pinned plectoneme (℘10, green solid line), and mobile plectoneme domain (℘01, red dot-dashed line). (b) Total probability of the three states at the buckling transition (ΔLk=19.5 under f = 2 pN and 0.5 M Na+, see Fig. 6) as a function of the defect size ε. For larger defects (ε > 0.1), the defect-pinned domain (℘10) is the favored post-buckling state, because of the lower bending energy of a kinked end loop associated with ℘10. While, for small defects (ε < 0.1) the bending energy saved from a kinked end loop is lower than the loss of diffusion entropy of the pinned state (℘10), which makes the mobile domain (℘01) the favored post-buckling state. Note the relatively higher probability of the unbuckled state for smaller defects. This is due to a shift of the buckling point towards lower linking numbers with increasing defect sizes (Fig. 10). (c) Probability density of DNA extension at the buckling transition shows the typical bimodal character observed for defect-free DNA (Fig. 2), however, the defect size controls the states populating the lower-extension mode of the distribution. This also suggests that measurement of the extension alone is insufficient to distinguish between the states involved at the buckling transition.
FIG. 8
FIG. 8
Rebuckling transition for various defect sizes. (a) Schematic of the three possible states at the rebuckling transition: the critically-big defect-pinned plectoneme domain (℘10, green solid lines), one mobile plectoneme domain (℘01, red dot-dashed lines), and two-domain plectoneme containing one defect-pinned and one mobile domains (℘11, cyan dotted lines). (b) Total probability of the three states at the rebuckling point (ΔLk=28 under f = 2 pN and 0.5 M Na+, see Fig. 6) as a function of the defect size ε. For small defects (0 < ε < 0.1), the post-buckling state is the mobile domain (℘01) and not the defect-pinned domain (℘10) (see Fig. 7). As a result, rebuckling is not observed for small defects and the ℘01 state continues to increase in size after buckling, same as the case for a defect-free DNA (Fig. 2). For intermediate defects (0.1 < ε < 0.25), the defect is large enough to bias nucleation of the defect-pinned domain (℘10) at the buckling transition (Fig. 7); however, at the rebuckling point, one mobile domain (℘01) is more stable than the two-domain state (℘11). For large defects (ε > 0.25), the defect-pinned domain (℘10) is highly stable, resulting in nucleation of a new mobile domain at the rebuckling point; this makes the two domain state (℘11) favored after the rebuckling transition. Note the higher probability of ℘10 for larger defects, which is due to a shift of the rebuckling transition to higher linking numbers for larger defect sizes (Fig. 10). (c) Probability density of extension for ε = 0.25 at the rebuckling point. The bimodal extension profile is due to the finite nucleation energy associated with a teardrop loop of a mobile domain. The state populating the lower-extension mode of the distribution depends on the size of the defect, such that large and intermediate defects favor ℘11 and ℘01 states, respectively. Small defects show a unimodal extension profile after buckling transition, and do not exhibit rebuckling.
FIG. 9
FIG. 9
Displacement of the defect site. Twist response of 2 µm DNA under 2 pN force at 0.5 M Na+ with an intermediate defect (ε = 0.2) located L* = 0.15 (blue), 0.25 (red), 0.5 (cyan), 0.75 (green), and 1 µm (magenta) from one of the DNA ends. The location of the defect site controls the critical size of the pinned plectoneme domain (2L*) nucleated at the buckling point. This results in an increase of the critical linking number for the rebuckling transition for defects located farther away from the end, seen as a shift in extension and torque bumps. For a centrally-located defect (L* = 1 µm, magenta lines) the rebuckling transition does not occur because the critical size of the defect-pinned domain is equal to the total size of the DNA. Note that unpinning of the defect-pinned domain occurs at the rebuckling transition, as expected for intermediate defects.
FIG. 10
FIG. 10
Comparison of theoretical and experimental shifts in the critical linking numbers associated with buckling and rebuckling transitions as a function of the defect size for f = 3.6 pN. The size of the defect is defined theoretically via the parameter ε, and experimentally, as n, the number of adjacent base pair mismatches on the DNA [1]. Theoretically, the defects are categorized into small, intermediate, and large (Fig. 8) depending on the numerical value of ε, as shown in the figure legend. The free energy difference, ΔF between the lower and higher extension states at the buckling or rebuckling transitions is obtained from the logarithm of the ratio of area-under-curve of extension histograms (as shown on the y-axis labels). For a specified defect size, the critical linking number corresponds to ΔF = 0. The gray shaded arrows show the direction of increasing defect sizes. (a)Buckling transition: Theoretical plot shows a decrease in the critical linking number with an increase in ε for intermediate and large defects, whereas, the buckling point does not shift for small defects. Large and intermediate defects nucleate a defect-pinned plectoneme domain that has a lower nucleation energy, this causes a decrease in the critical linking number. Small defects nucleate a mobile domain at the buckling transition, as a result the critical linking number is independent of the defect size. (a′) A similar shift of the critical buckling point to lower linking numbers with increasing n is observed experimentally (see Fig. S4(b) of Ref. [1]), where the solid lines show the best-fit linear regression for various n. (b) Rebuckling transition: Theoretical plot showing the change in the critical linking number as a function of ε. Small defects do not show rebuckling transition: the blue dashed line does not intersect ΔF = 0. Intermediate defects show an increase in the associated critical linking number with increasing ε. Rebuckling for intermediate defects involves a decrease (increase) in the probability of the defect-pinned domain (one mobile domain), and consequently, a higher stability of the defect-pinned domain delays the rebuckling transition. Large defects show rebuckling but not a shift in the rebuckling point with ε. For large defects, a mobile domain is added to the defect-pinned domain at the rebuckling transition, making the rebuckling critical linking number independent of ε. (b′) Experimental plot of ΔF near the rebuckling transition for various n (solid curves are the best-fit straight lines) agrees with the theoretical trend of the shift in the rebuckling critical linking number.
FIG. 11
FIG. 11
Change in extension at the buckling and rebuckling transitions as a function of the defect size for 3.6 pN force. The extension change at a transition depends on the size of the nucleated domain, which has contributions from the end loop and the plectoneme superhelical state. In case of buckling (blue solid line), the critical linking number decreases with increasing defect size causing a decrease in the plectoneme contribution as well as the size of the end loop, reducing the extension change at the transition. However, for small defects, nucleation of a mobile domain causes a saturation in the extension change for buckling transition and an absence of rebuckling transition, hence no associated extension change (red dot-dashed line). For intermediate defects, rebuckling extension change increases with the defect size due to an increase in the associated critical linking number resulting in a higher superhelix contribution. Whereas, for large defects, the extension change is constant because of a fixed superhelix contribution corresponding to a fixed critical linking number (Fig. 10). Experimental data for the extension change (see Fig. 2(c) in Ref. [1]) as function of the number of adjacent unpaired bases n (top x-axis) compares well with theory. The experimental error bars, omitted in the plot, are smaller than the size of the point markers.
FIG. 12
FIG. 12
Contour plot of p-values near rebuckling transition (ε = 0.15) for various points on the force-salt landscape. We fit the theoretical extension distributions near the rebuckling point to a single Gaussian distribution, and using the chi-squared test calculate the p-value, which serves as a goodness-of-fit statistic. Lower p-values (lighter shade) indicate that the extension histograms near the rebuckling point are characteristically bimodal and are not well fitted by single Gaussian distributions; whereas, higher p-values (darker shade) indicate the rebuckling extension histograms are well approximated as Gaussian distributions. Since the experimental signal associated with the rebuckling transition is the bimodal character of DNA extension, we find that the rebuckling transition is more likely to be observed experimentally when the p-value is low, i.e., higher forces and higher salts. The dotted black line shows the experimentally observed boundary for the appearance of the rebuckling signal associated with a defect containing two adjacent base-pair mismatches (n = 2 bp) (see Fig. 3 of Ref. [1]). The bimodal rebuckling signal was reliably observed in experiments for salts and forces on the right-hand side of the dotted line.

Similar articles

Cited by

References

    1. Dittmore A, Brahmachari S, Takagi Y, Marko JF, Neuman KC. Phys. Rev. Lett. 2017;119:147801. - PMC - PubMed
    1. Smith SB, Finzi L, Bustamante C. Science. 1992;1122:258. - PubMed
    1. Hagerman PJ. Annu. Rev. Biophys. Chem. 1988;17:265. - PubMed
    1. Marko JF, Siggia ED. Macromolecules. 1995;28:8759.
    1. Ganji M, Kim SH, Van Der Torre J, Abbondanzieri E, Dekker C. Nano Lett. 2016;16:4699. - PubMed

LinkOut - more resources