

Mycobacterium tuberculosis thymidylate kinase antigen assays for designating incipient, high-risk latent M.tb infection
- PMID: 29548281
- PMCID: PMC5857104
- DOI: 10.1186/s12879-018-3007-y
Mycobacterium tuberculosis thymidylate kinase antigen assays for designating incipient, high-risk latent M.tb infection
Abstract
Background: Precise designation of high risk forms of latent Mycobacterium tuberculosis-M.tb infections (LTBI) is impossible. Delineation of high-risk LTBI can, however, allow for chemoprophylaxis and curtail majority cases of active tuberculosis (ATB). There is epidemiological evidence to support the view that LTBI in context of HIV-1 co-infection is high-risk for progression to ATB relative to LTBI among HIV-ve persons. We recently showed that assays of M.tb thymidylate kinase (TMKmt) antigen and host specific IgG can differentiate ATB from LTBI and or no TB (NTB, or healthy controls). In this study, we aimed to expose the differential levels of TMKmt Ag among HIV+ve co-infected LTBI relative to HIV-ve LTBI as a strategy to advance these assays for designating incipient LTBI.
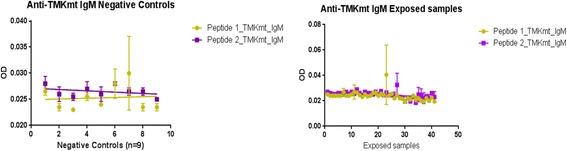
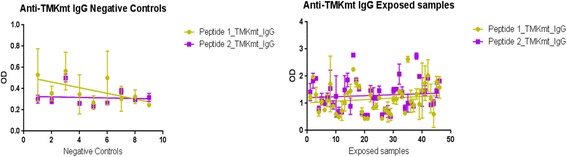
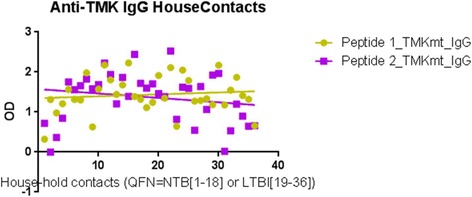
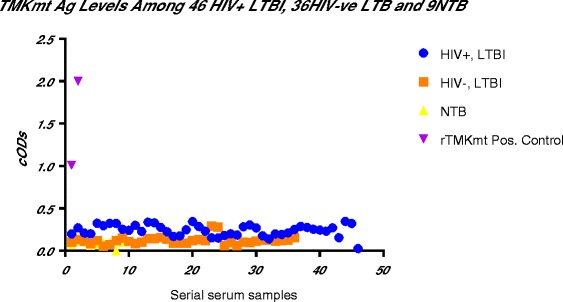
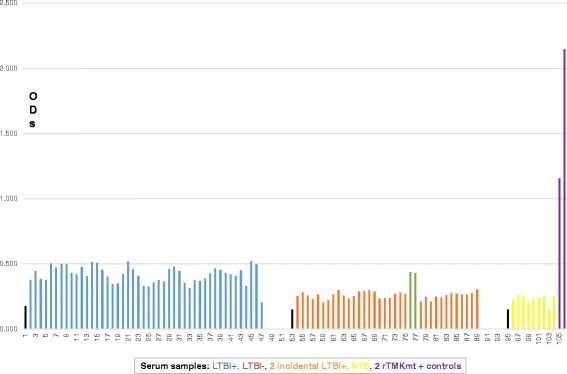
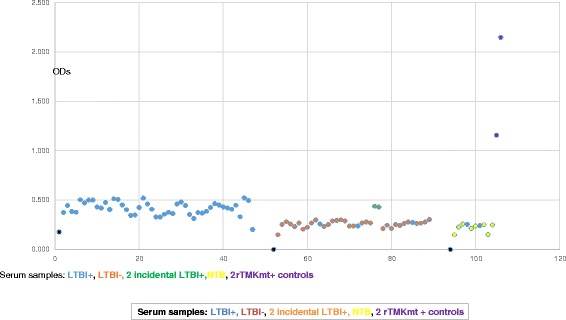
Methods: TMKmt host specific IgM and IgG detection Enzyme Immuno-Assays (EIA) were conducted on 40 TB exposed house-hold contacts (22 LTBI vs. 18 no TB (NTB) by QunatiFERON-TB GOLD®); and TMKmt Ag detection EIA done on 82 LTBI (46 HIV+ve vs 36 HIV-ve) and 9 NTB (American donors). Purified recombinant TMKmt protein was used as positive control for the Ag assays.
Results: IgM levels were found to be equally low across QuantiFERON-TB GOLD® prequalified NTB and TB exposed house-hold contacts. Higher TMKmt host specific IgG trends were found among TB house-hold contacts relative to NTB controls. TMKmt Ag levels among HIV+ve LTBI were 0.2676 ± 0.0197 (95% CI: 0.2279 to 0.3073) relative to 0.1069 ± 0.01628 (95% CI: 0.07385 to 0.14) for HIV-ve LTBI (supporting incipient nature of LTBI in context of HIV-1 co-infection). NTB had TMKmt Ag levels of 0.1013 ± 0.02505 (5% CI: 0.0421 to 0.1606) (intimating that some were indeed LTBI).
Conclusions: TMKmt Ag levels represent a novel surrogate biomarker for high-risk LTBI, while host-specific IgG can be used to designate NTB from LTBI.
Keywords: Latent M.tb infections (LTBI);Thymidylate Kinase; Mycobacterium tuberculois; Serodiagnosis; Tuberculosis.
Conflict of interest statement
Ethics approval and consent to participate
This protocol was approved by the School of Biomedical Sciences Institutional Review & Ethics Committee (SBS-IREC) at the College of Health Sciences, Makerere University Kampala, Uganda as protocol # SBS 263 titled “Exploration of Mycobacterium tuberculosis thymidylate kinase based culture- and immunodiagnostic- assays towards rapid and easy detection of Tuberculosis”. Since the study used broadly consented serum of TB house-hold contacts and LTBI previously collected by the Makerere University-Case-Western Reserve University (MU-CWRU) TB Research Unit Project, the need for participant consent was waived by the SBS-IREC.
Consent for publication
Not Applicable
Competing interests
“Tehe authors declare that they have no competing interests.” M.W has previously filed a related patent # UG/P/2013/000006 at the Uganda Registration Services Bureau (URBS) and African Regional Intellectaul Property Organization (ARIPO).
Publisher’s Note
Springer Nature remains neutral with regard to jurisdictional claims in published maps and institutional affiliations.
Figures
Similar articles
-
Sero-diagnosis of Active Mycobacterium tuberculosis Disease among HIV Co-infected Persons using Thymidylate Kinase based Antigen and Antibody Capture Enzyme Immuno-Assays.Mycobact Dis. 2017 Jun;7(2):241. doi: 10.4172/2161-1068.1000241. Epub 2017 May 31. Mycobact Dis. 2017. PMID: 28856068 Free PMC article.
-
Immuno-diagnosis of Mycobacterium tuberculosis in sputum, and reduction of timelines for its positive cultures to within 3 h by pathogen-specific thymidylate kinase expression assays.BMC Res Notes. 2017 Aug 8;10(1):368. doi: 10.1186/s13104-017-2649-y. BMC Res Notes. 2017. PMID: 28789704 Free PMC article.
-
Heme oxygenase-1 and neopterin plasma/serum levels and their role in diagnosing active and latent TB among HIV/TB co-infected patients: a cross sectional study.BMC Infect Dis. 2021 Jul 27;21(1):711. doi: 10.1186/s12879-021-06370-7. BMC Infect Dis. 2021. PMID: 34315412 Free PMC article.
-
Latent tuberculosis infection--Revisiting and revising concepts.Tuberculosis (Edinb). 2015 Jul;95(4):373-84. doi: 10.1016/j.tube.2015.04.003. Epub 2015 May 15. Tuberculosis (Edinb). 2015. PMID: 26038289 Review.
-
Interferon gamma release assays: principles and practice.Enferm Infecc Microbiol Clin. 2010 Apr;28(4):245-52. doi: 10.1016/j.eimc.2009.05.012. Epub 2009 Sep 24. Enferm Infecc Microbiol Clin. 2010. PMID: 19783328 Review.
Cited by
-
Serum antibody profiles in individuals with latent Mycobacterium tuberculosis infection.Microbiol Immunol. 2019 Mar;63(3-4):130-138. doi: 10.1111/1348-0421.12674. Epub 2019 Apr 9. Microbiol Immunol. 2019. PMID: 30851131 Free PMC article.
References
-
- DEJ S, Raviglione M, Kochi A. In: Blooe BR, editor. Pathogenesis, Protection, and Control. Tuberculosis. Washington DC; 1996. Am. Soc. Microbiol.
-
- Wheeler PR & Ratledgee C. Pathogenesis, Protection, and Control. Tuberculosis, ed. B.R. Blooem. 1994, Washington DC: Am. Soc. Microbiol.
-
- WHO Preventive therapy against tuberculosis in people living with HIV. Wkly Epidemiol Rec. 1999;74:385–398. - PubMed
Publication types
MeSH terms
Substances
Grants and funding
LinkOut - more resources
Full Text Sources
Other Literature Sources
