

Total RNA extraction from tissues for microRNA and target gene expression analysis: not all kits are created equal
- PMID: 29548320
- PMCID: PMC5857145
- DOI: 10.1186/s12896-018-0421-6
Total RNA extraction from tissues for microRNA and target gene expression analysis: not all kits are created equal
Abstract
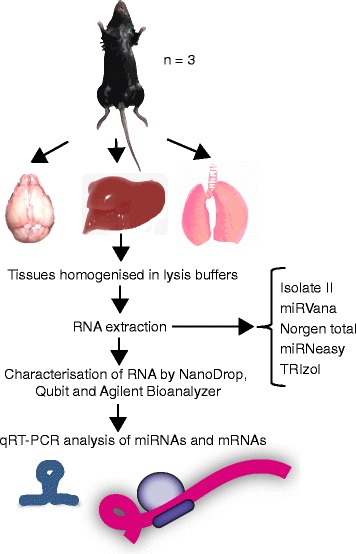
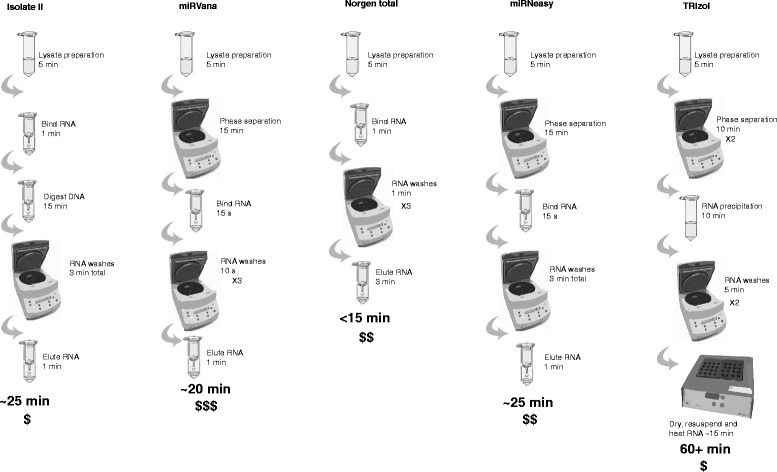
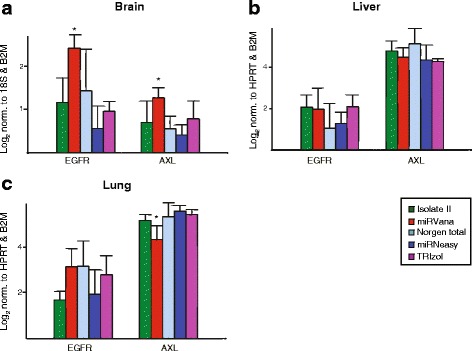
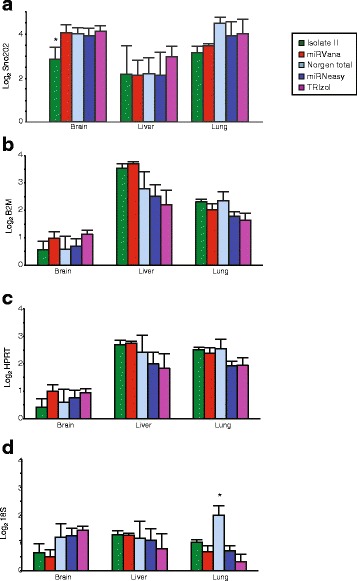
Background: microRNAs (miRNAs) are short non-coding RNAs that fine-tune gene expression. The aberrant expression of miRNAs is associated with many diseases and they have both therapeutic and biomarker potential. However, our understanding of their usefulness is dependent on the tools we have to study them. Previous studies have identified the need to optimise and standardise RNA extraction methods in order to avoid biased results. Herein, we extracted RNA from murine lung, liver and brain tissues using five commercially available total RNA extraction methods. These included either: phenol: chloroform extraction followed by alcohol precipitation (TRIzol), phenol:chloroform followed by solid-phase extraction (column-based; miRVana and miRNeasy) and solid-phase separation with/without affinity resin (Norgen total and Isolate II). We then evaluated each extraction method for the quality and quantity of RNA recovered, and the expression of miRNAs and target genes.
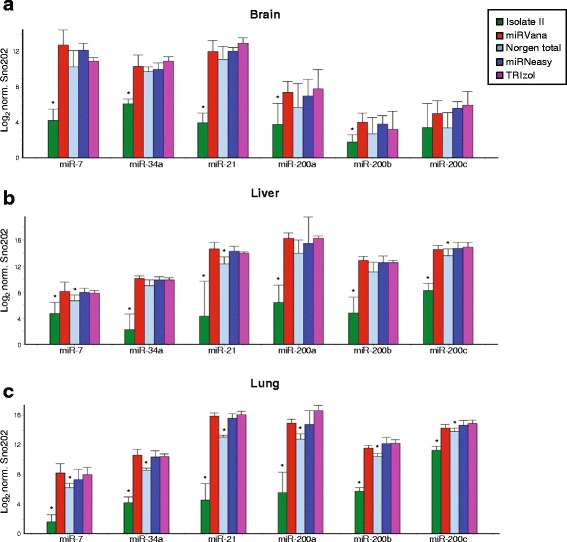
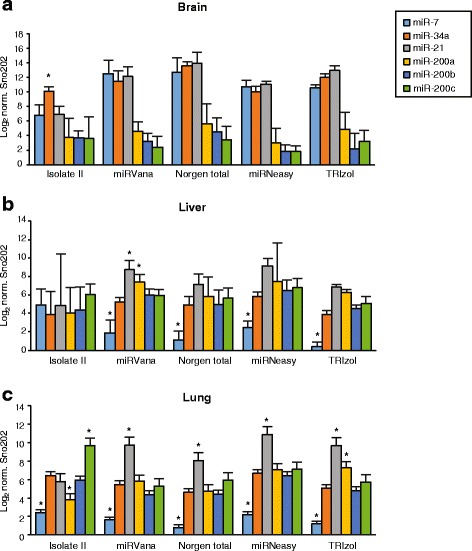
Results: We identified differences between each of the RNA extraction methods in the quantity and quality of RNA samples, and in the analysis of miRNA and target gene expression. For the purposes of consistency in quantity, quality and high recovery of miRNAs from tissues, we identified that Phenol:chloroform phase separation combined with silica column-based solid extraction method was preferable (miRVana microRNA isolation). We also identified a method that is not appropriate for miRNA analysis from tissue samples (Bioline Isolate II). For target gene expression any of the kits could be used to analyse mRNA, but if interested in analysing mRNA and miRNA from the same RNA samples some methods should be avoided.
Conclusions: Different methods used to isolate miRNAs will yield different results and therefore a robust RNA isolation method is required for reproducibility. Researchers should optimise these methods for their specific application and keep in mind that "total RNA" extraction methods do not isolate all types of RNA equally.
Keywords: Biomarkers; Extraction; Real-time PCR; Tissue; miRNA-based therapy; microRNA isolation method; microRNAs.
Conflict of interest statement
Ethics approval
Animals were sourced, housed and treated in accordance with institutional guidelines approved by the Harry Perkins Institute of Medical Research Ethics Committee under application #AEO35.
Consent for publication
Not applicable.
Competing interests
The authors declare that they have no competing interests.
Publisher’s Note
Springer Nature remains neutral with regard to jurisdictional claims in published maps and institutional affiliations.
Figures
Similar articles
-
Phenol/Chloroform-Free TiO2-Based miRNA Extraction from Cell Lysate.Int J Mol Sci. 2022 Aug 9;23(16):8848. doi: 10.3390/ijms23168848. Int J Mol Sci. 2022. PMID: 36012112 Free PMC article.
-
Evaluation of miRNAs expression in medullary thyroid carcinoma tissue samples: miR-34a and miR-144 as promising overexpressed markers in MTC.Hum Pathol. 2018 Sep;79:212-221. doi: 10.1016/j.humpath.2018.05.019. Epub 2018 Jun 6. Hum Pathol. 2018. PMID: 29885402
-
miRNA Isolation from FFPET Specimen: A Technical Comparison of miRNA and Total RNA Isolation Methods.Pathol Oncol Res. 2016 Jul;22(3):505-13. doi: 10.1007/s12253-015-0027-4. Epub 2015 Dec 17. Pathol Oncol Res. 2016. PMID: 26678076
-
Evaluation of RNA isolation methods for microRNA quantification in a range of clinical biofluids.BMC Biotechnol. 2021 Aug 6;21(1):48. doi: 10.1186/s12896-021-00706-6. BMC Biotechnol. 2021. PMID: 34362351 Free PMC article.
-
MicroRNA isolation and stability in stored RNA samples.Biochem Biophys Res Commun. 2009 Dec 4;390(1):1-4. doi: 10.1016/j.bbrc.2009.09.061. Epub 2009 Sep 19. Biochem Biophys Res Commun. 2009. PMID: 19769940 Review.
Cited by
-
Global gene expression profiling of blast lung injury of goats exposed to shock wave.Chin J Traumatol. 2020 Oct;23(5):249-257. doi: 10.1016/j.cjtee.2020.08.005. Epub 2020 Aug 21. Chin J Traumatol. 2020. PMID: 32917472 Free PMC article.
-
Bias in RNA-seq Library Preparation: Current Challenges and Solutions.Biomed Res Int. 2021 Apr 19;2021:6647597. doi: 10.1155/2021/6647597. eCollection 2021. Biomed Res Int. 2021. PMID: 33987443 Free PMC article. Review.
-
The Regulatory Role of Mitochondrial MicroRNAs (MitomiRs) in Breast Cancer: Translational Implications Present and Future.Cancers (Basel). 2020 Aug 28;12(9):2443. doi: 10.3390/cancers12092443. Cancers (Basel). 2020. PMID: 32872155 Free PMC article. Review.
-
MicroRNA Let-7e in the Mouse Prefrontal Cortex Differentiates Restraint-Stress-Resilient Genotypes from Susceptible Genotype.Int J Mol Sci. 2021 Aug 30;22(17):9439. doi: 10.3390/ijms22179439. Int J Mol Sci. 2021. PMID: 34502349 Free PMC article.
-
Fluidic Programmable Gravi-maze Array for High Throughput Multiorgan Drug Testing.bioRxiv [Preprint]. 2025 Jun 24:2025.06.18.660241. doi: 10.1101/2025.06.18.660241. bioRxiv. 2025. PMID: 40666863 Free PMC article. Preprint.
References
Publication types
MeSH terms
Substances
LinkOut - more resources
Full Text Sources
Other Literature Sources
