

Population aging and migration - history and UN forecasts in the EU-28 and its east and south near neighborhood - one century perspective 1950-2050
- PMID: 29548339
- PMCID: PMC5857107
- DOI: 10.1186/s12992-018-0348-7
Population aging and migration - history and UN forecasts in the EU-28 and its east and south near neighborhood - one century perspective 1950-2050
Abstract
Background: There is a gap in knowledge on long term pace of population aging acceleration and related net-migration rate changes in WHO European Region and its adjacent MENA countries. We decided to compare European Union (EU-28) region with the EU Near Neighborhood Policy Region East and EU Near Neighborhood Policy Region South in terms of these two essential features of third demographic transition. One century long perspective dating back to both historical data and towards reliable future forecasts was observed.
Methods: United Nation's Department of Economic and Social Affairs estimates on indicators of population aging and migration were observed. Time horizon adopted was 1950-2050. Targeted 44 countries belong to either one of three regions named by EU diplomacy as: European Union or EU-28, EU Near Neighborhood Policy Region East (ENP East) and EU Near Neighborhood Policy Region South (ENP South).
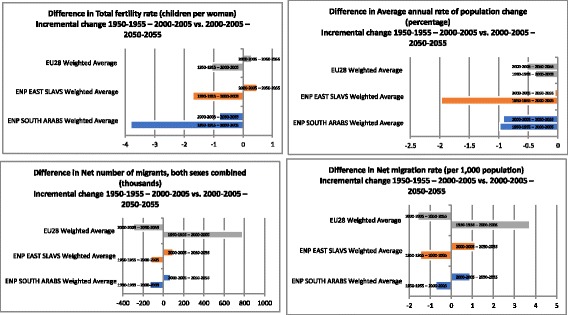
Results: European Union region currently experiences most advanced stage of demographic aging. The latter one is the ENP East region dominated by Slavic nations whose fertility decline continues since the USSR Era back in late 1980s. ENP South region dominated by Arab League nations remains rather young compared to their northern counterparts. However, as the Third Demographic Transition is inevitably coming to these societies they remain the spring of youth and positive net emigration rate. Probably the most prominent change will be the extreme fall of total fertility rate (children per woman) in ENP South countries (dominantly Arab League) from 6.72 back in 1950 to medium-scenario forecasted 2.10 in 2050. In the same time net number of migrants in the EU28 (both sexes combined) will grow from - 91,000 in 1950 to + 394,000 in 2050.
Conclusions: Long term migration from Eastern Europe westwards and from MENA region northwards is historically present for many decades dating back deep into the Cold War Era. Contemporary large-scale migrations outsourcing from Arab League nations towards rich European Protestant North is probably the peak of an iceberg in long migration routes history. However, in the decades to come acceleration of aging is likely to question sustainability of such movements of people.
Keywords: Europe; Forecasts; History; Long term; MENA; Migration; Population aging; Trends; UN; WHO.
Conflict of interest statement
Ethics approval and consent to participate
Not applicable.
Consent for publication
Not applicable.
Competing interests
The authors declare that they have no competing interests.
Publisher’s Note
Springer Nature remains neutral with regard to jurisdictional claims in published maps and institutional affiliations.
Figures
References
-
- European External Action Service. European Neighbourhood Policy (ENP). https://eeas.europa.eu/topics/european-neighbourhood-policy-enp_en?page=2. Accessed 07 May 2017.
-
- Commonwealth of Independent States. http://www.cisstat.com/eng/cis.htm. Accessed 07 May 2017.
-
- Jakovljevic M. The aging of Europe. The unexplored potential. Farmeconomia Health Econ Ther Pathw. 2015;16(4):89. doi: 10.7175/fe.v16i4.1220. - DOI
-
- GBD 2015 Mortality and Causes of Death Collaborators Global, regional, and national life expectancy, all-cause mortality, and cause-specific mortality for 249 causes of death, 1980–2015: a systematic analysis for the Global Burden of Disease Study 2015. Lancet. 2016;388(10053):1459–1544. doi: 10.1016/S0140-6736(16)31012-1. - DOI - PMC - PubMed
-
- Jakovljevic M, Laaser U. Population aging from 1950 to 2010 in seventeen transitional countries in the wider region of South Eastern Europe (Original research). SEEJPH 2015. http://www.seejph.com/index.php/seejph/article/view/49/40. 10.12908/SEEJPH-2014-42.
Publication types
MeSH terms
Grants and funding
LinkOut - more resources
Full Text Sources
Other Literature Sources
Research Materials
Miscellaneous
