. 2018 Mar 20;48(3):584-598.e5.
doi: 10.1016/j.immuni.2018.02.015. Epub 2018 Mar 13.

Sensing Microbial Viability through Bacterial RNA Augments T Follicular Helper Cell and Antibody Responses

Affiliations

Sensing Microbial Viability through Bacterial RNA Augments T Follicular Helper Cell and Antibody Responses

Gaetan Barbet et al. Immunity. .

Abstract

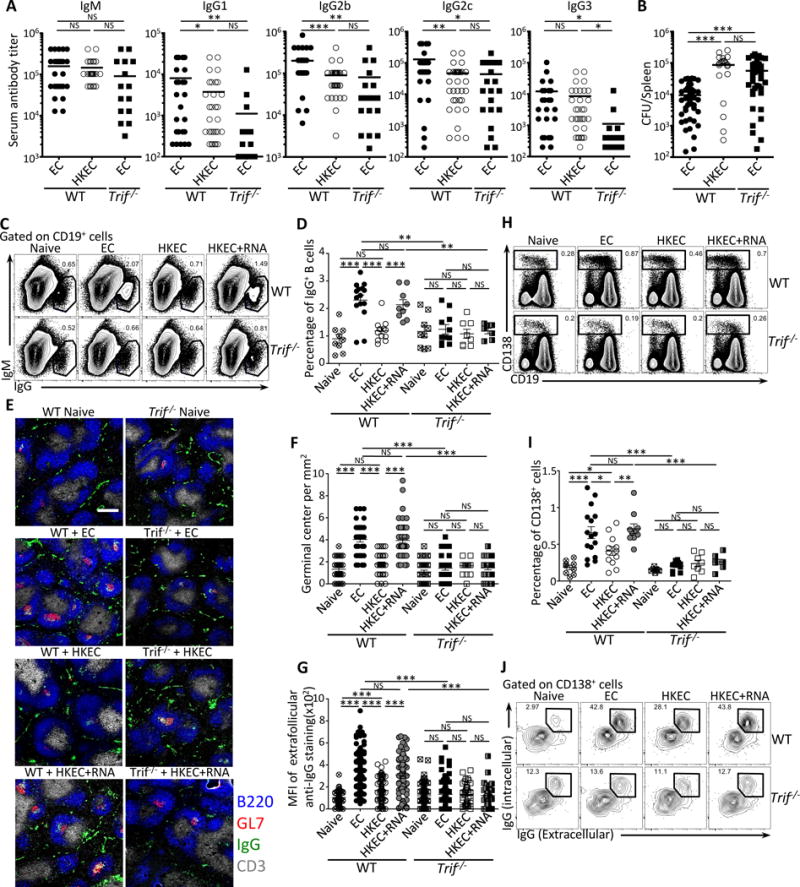
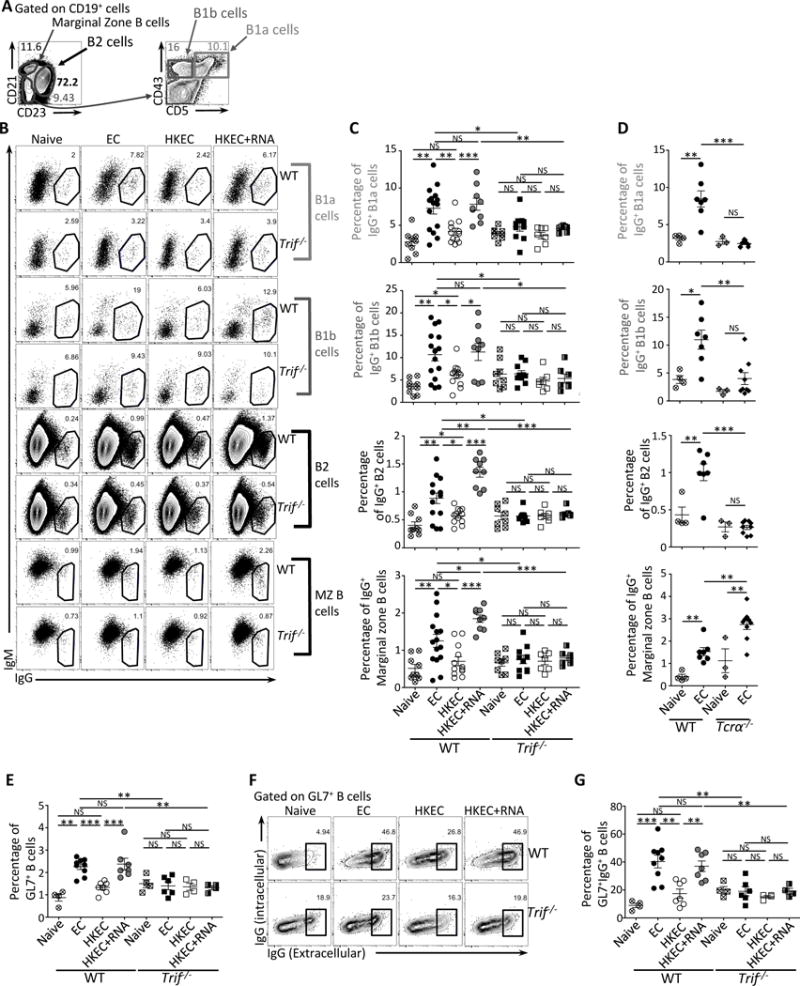
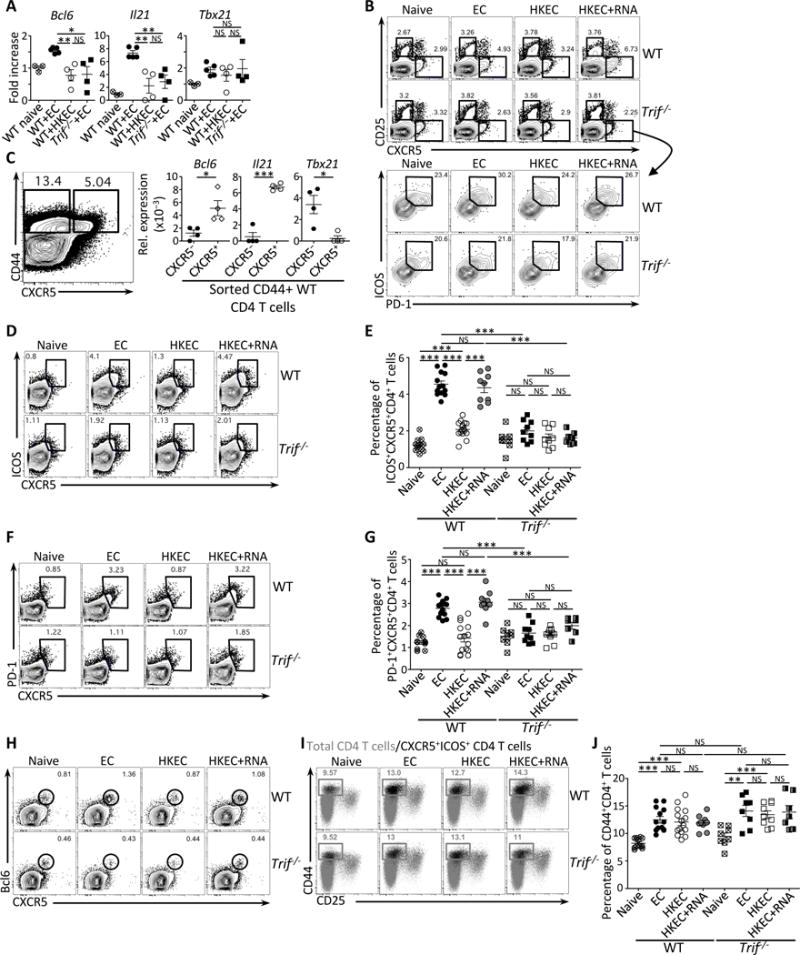
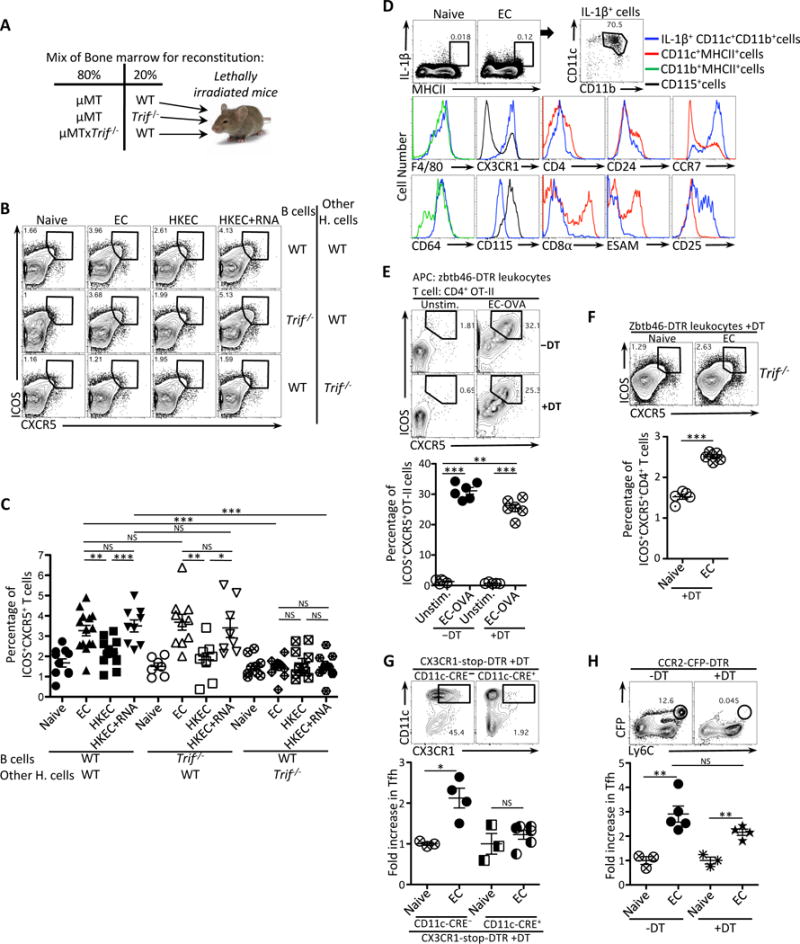
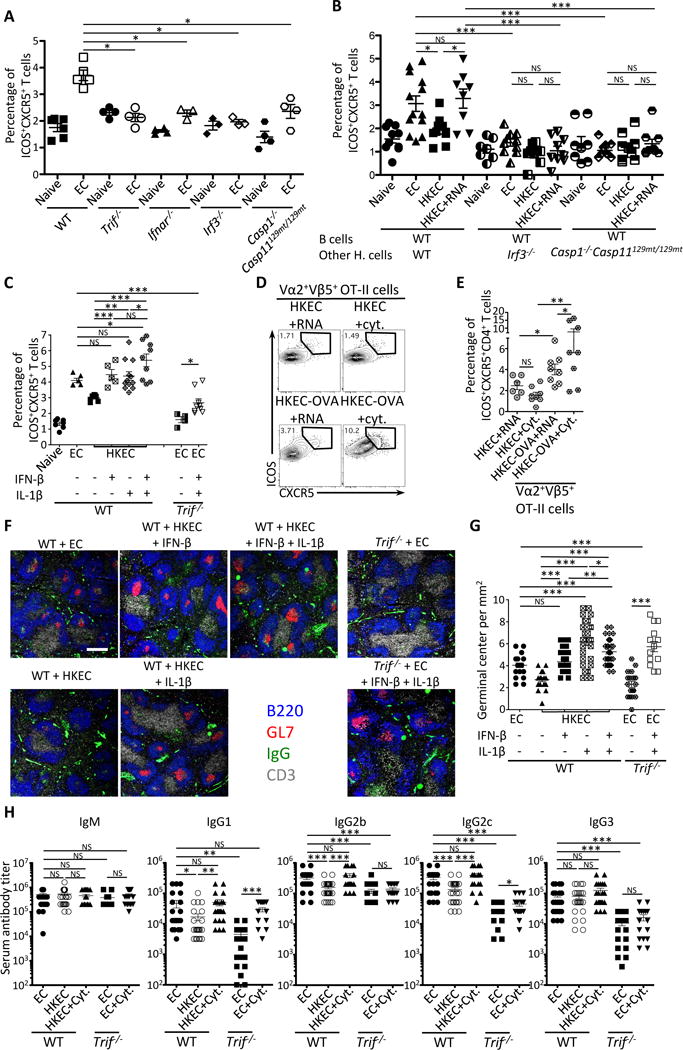
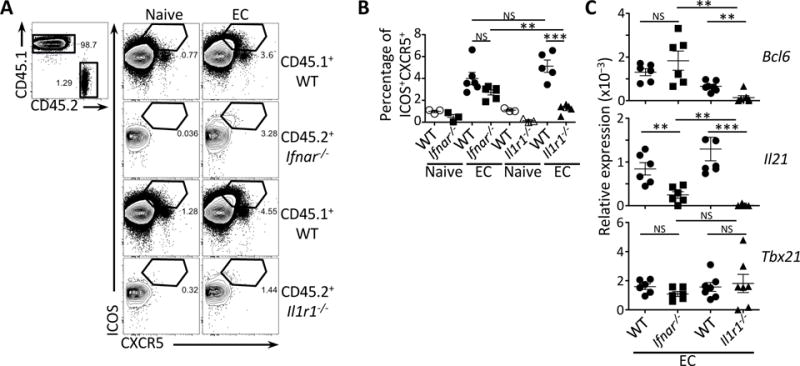
Live vaccines historically afford superior protection, yet the cellular and molecular mechanisms mediating protective immunity remain unclear. Here we found that vaccination of mice with live, but not dead, Gram-negative bacteria heightened follicular T helper cell (Tfh) differentiation, germinal center formation, and protective antibody production through the signaling adaptor TRIF. Complementing the dead vaccine with an innate signature of bacterial viability, bacterial RNA, recapitulated these responses. The interferon (IFN) and inflammasome pathways downstream of TRIF orchestrated Tfh responses extrinsically to B cells and classical dendritic cells. Instead, CX3CR1+CCR2- monocytes instructed Tfh differentiation through interleukin-1β (IL-1β), a tightly regulated cytokine secreted upon TRIF-dependent IFN licensing of the inflammasome. Hierarchical production of IFN-β and IL-1β dictated Tfh differentiation and elicited the augmented humoral responses characteristic of live vaccines. These findings identify bacterial RNA, an innate signature of microbial viability, as a trigger for Tfh differentiation and suggest new approaches toward vaccine formulations for coordinating augmented Tfh and B cell responses.

Keywords: Bacterial RNA; CX3CR1; Follicular T helper cell; inflammasome; microbial viability; monocytes; type-I interferon; vaccine.


Conflict of interest statement

COMPETING FINANCIAL INTERESTS

J.M.B. and L.E.S. have a patent related to this work: PCT/US2012/047087 “Use of Bacterial RNA or Structural Motifs thereof as adjuvants for vaccines”.

Figures

Figure 1
Figure 1. Detection of bacterial viability through TRIF triggers germinal center formation and IgG production
Wild-type (WT) and Trif−/− mice were vaccinated intraperitoneally with 5×10⁷ live ThyA EC, heat-killed ThyA EC (HKEC), or HKEC+RNA(30μg). (A) Day 25 serum titers of class-specific anti-E. coli (EC) antibodies. (B) Spleen EC colony forming units (CFU) at 24 hours post-injection of 5×10⁸ live EC into mice vaccinated 6 months earlier. (C, D) Flow cytometry dot plots (C) and percentages (D) of gated IgG+CD19+ B cells. (E–G) Immunofluorescence micrographs (E) at 4X magnification on spleen sections stained for B220, GL-7, IgG and CD3. Scale bar = 300 μm. (F) Numbers of germinal centers (GC) per mm2. (G) Mean fluorescence intensity (MFI) of extra-follicular IgG staining. (H, I) Flow cytometry dot plots (H) and percentages (I) of gated CD138+ plasma cells and plasmablasts (inclusive of CD19+ plasmablasts and CD19 plasma cells). (J) Flow cytometry for intracellular and surface IgG expression by CD138+ plasma cells and plasmablasts. Data represent at least 3 independent experiments. C–J Data in spleens of indicated genotypes before (naïve) and 7 days post-vaccination. (F, G) Each symbol represents one field counted in the scatter plots. (C, H, J) Numbers adjacent to outlined areas indicate percent of cells in gates. Except for (F) and (G), each symbol represents an individual mouse in the scatter plots. NS, not significant (P > 0.05); *, P<0.05, **, P≤0.01 and ***, P≤0.001 (two-tailed unpaired t test). All data represent at least 3 experiments pooled. Mouse numbers are in (A) WT+EC, n=32; WT+HKEC, n=38; Trif−/−+EC, n=20; (B) WT+EC, n=49; WT+HKEC, n=22; Trif−/−+EC, n=39; (D) WT (naive, n=9 ;+EC, n=15; +HKEC, n=12; +HKEC+RNA, n=9) and Trif−/− (naive, n=9 ;+EC, n=11; +HKEC, n=8; +HKEC+RNA, n=7); (F) and (G) WT (naive, n=4 ;+EC, n=6; +HKEC, n=5; +HKEC+RNA, n=6) and Trif−/− (naive, n=6 ;+EC, n=5; +HKEC, n=4; +HKEC+RNA, n=4); (I) WT (naive, n=9 ;+EC, n=16; +HKEC, n=12; +HKEC+RNA, n=10) and Trif−/− (naive, n=7 ;+EC, n=11; +HKEC, n=8; +HKEC+RNA, n=8). See also Figure S1.
Figure 2
Figure 2. Detection of bacterial viability through TRIF induces immunoglobulin class-switching in all B cell subsets
Wild-type (WT), Trif−/− and TCRα−/− mice were vaccinated intraperitoneally as indicated with either 5×10⁷ live ThyA EC, heat-killed ThyA EC (HKEC), or HKEC+RNA(30μg). (A) Flow cytometry gating strategy for different B cell populations. (B, C) Flow cytometry dot plots (B) and percentages (C) of IgG+ B1a, B1b, B2 or marginal zone (MZ) B cells. (D) Percentages of IgG+ B1a, B1b, B2 or MZ cells identified as in (A). (E) Percentages of GL7+CD19+ B cells. (F) Flow cytometry dot plots gated on GL7+CD19+ GC B cells and stained for intracellular and extracellular IgG. (G) Percentages of IgG+ cells within GL7+CD19+ B cells. (B–G) Data in spleens of indicated genotypes before (naïve) and 7 days post vaccination. C, D, E and G, each symbol represents an individual mouse in the scatter plots. NS, not significant (P > 0.05); *, P<0.05, **, P≤0.01 and ***, P≤0.001 (two-tailed unpaired t test). For each scatter plot, the bar indicates the mean±s.e.m. Numbers adjacent to outlined areas indicate percent of cells in gates. Each symbol represents an individual mouse in scatter plots. Data represent at least 3 experiments pooled. Mouse numbers are in (C) WT(naive, n=9 ;+EC, n=15; +HKEC, n=12; +HKEC+RNA, n=9) and Trif−/−(naive, n=8 ;+EC, n=10; +HKEC, n=7; +HKEC+RNA, n=7); (D) WT(naive, n=4 ;+EC, n=7) and Tcrα−/−(naive, n=3 ;+EC, n=9); (E) and (G) WT(naive, n=4 ;+EC, n=9; +HKEC, n=7; +HKEC+RNA, n=7) and Trif−/−(naive, n=4 ;+EC, n=6; +HKEC, n=4; +HKEC+RNA, n=4). See also Figure S2 and Tables S1 and S2.
Figure 3
Figure 3. TRIF-dependent detection of bacterial viability promotes Tfh cell differentiation
Wild-type (WT) and Trif−/− mice were vaccinated intraperitoneally as indicated with either 5×10⁷ live ThyA EC, heat-killed ThyA EC (HKEC), or HKEC+RNA(30μg). (A) Quantitative RT-PCR for Bcl6, Il21 and Tb×21 transcripts in total CD4+ T cells on day 5 after vaccination. Fold increase over naïve mice is shown. (B) Flow cytometry dot plots gated on CD4+ T cells showing expression for CD25 and CXCR5 (upper panels), and ICOS and PD-1 within gated CXCR5+ T cells (lower panel). (C) Quantitative RT-PCR for Bcl6, Il21 and Tbx21 transcripts in sorted CD44+CD4+ T cells either CXCR5 (left contour plot) or CXCR5+ (right contour plot). Data represent relative expression to β-actin. (D, E) Flow cytometry dot plots (D) and percentages (E) of CXCR5+ICOS+CD4+ T cells. (F, G) Flow cytometry dot plots (F) and percentages (G) of CXCR5+PD-1+CD4+ T cells. (H) Flow cytometry dot plots for CXCR5 and Bcl6 gated on CD4+ T cells. (I) Flow cytometry of CD44+CD25CD4+ T cells. Gray dots represent the total CD4+ T cell population; black dots represent the CXCR5+ICOS+CD4+ T cell population. (J) Percentages of total CD44+CD4+ T cells. (B–J) Data for CD4+ T cells in spleens of indicated genotypes before and 5 days post vaccination. Each symbol represents an individual mouse in scatter plots. NS, not significant (P > 0.05); *, P<0.05, **, P≤0.01and ***, P≤0.001 (two-tailed unpaired t test). Data are mean±s.e.m. Numbers adjacent to outlined areas indicate percent of cells in gates. Data are representative of at least 3 independent experiments. Mouse numbers are in (E), (G) and (J) WT (naive, n=11; +EC, n=13; +HKEC, n=15; +HKEC+RNA, n=9) and Trif−/− (naive, n=8; +EC, n=9; +HKEC, n=9; +HKEC+RNA, n=7). See also Figure S3.
Figure 4
Figure 4. Tfh cell differentiation requires TRIF-mediated type-I interferon and inflammasome signals and CX3CR1+CCR2 monocytes
(A) Experimental strategy to generate bone marrow chimeric mice. (B, C) Flow cytometry dot plots (B) and percentages (C) of CXCR5+ICOS+CD4+ T cells in chimeric mice generated as in (A) and vaccinated with either 5×10⁷ live ThyA EC, heat-killed ThyA EC (HKEC), or HKEC+RNA(30μg). (D) Flow cytometry analyses of splenic MHC-II+ cells stained intracellularly for IL-1β and for indicated surface markers in gated cell populations in naïve or vaccinated WT mice at 5 hours post-injection of live EC. Brefeldin A was injected at 1 hour post injection of live EC. (E) Flow cytometry (upper panel) and percentages (lower panel) of CXCR5+ICOS+CD4+ T cells obtained in vitro after 4 days of co-culture of Zbtb46-DTR leukocytes and OVA-specific OT-II CD4+ T cells. DT was added at 100ng/ml to leukocytes 2 hours before infection with EC. (F) Flow cytometry (upper panel) and percentages (lower panel) of CXCR5+ICOS+CD4+ T cells in vivo 7 days after vaccination with EC in Trif−/− mice that had been adoptively transferred with zbtb46-DTR leukocytes 26 hours before vaccination and treated with DT 2 hours later. (G) Flow cytometry analyses of CD11c+CX3CR1+ cells in the spleen before and after depletion (upper panels). Fold increase of CXCR5+ICOS+CD4+ T cells in the spleens of DT-treated CX3CR1-stop-DTR (either CD11c-CRE or CD11c-CRE+) 5 days after vaccination with EC (lower panel). (H) Flow cytometry analyses of CFP+Ly6C+ monocytes in the spleens before and after depletion (upper panel). Fold increase of CXCR5+ICOS+CD4+ T cells in the spleens of PBS or DT treated CCR2-CFP-DTR mice 5 days after vaccination with EC (lower panel). NS, not significant (P > 0.05); *, P<0.05; **, P≤0.01; ***, P≤0.001 (two-tailed unpaired t test). Data are mean±s.e.m. Numbers adjacent to outlined areas indicate percent of cells in gates. Each symbol represents an individual mouse. Mouse numbers are in (C) WT(WT B cells)(naive, n=11 ;+EC, n=14; +HKEC, n=12; +HKEC+RNA, n=9), WT(Trif−/− B cells)(naive, n=7 ;+EC, n=10; +HKEC, n=8; +HKEC+RNA, n=8) and Trif−/−(WT B cells)(naive, n=9 ;+EC, n=11; +HKEC, n=10; +HKEC+RNA, n=12); (F) naïve, n=5, +EC, n=5; (G) CCR2-CFP-DTR−DT(naïve, n=3, +EC, n=5) CCR2-CFP-DTR+DT(naïve, n=3, +EC, n=4); (H) CD11c-CRE(naïve, n=3, +EC, n=4) CD11c-CRE+(naïve, n=3, +EC, n=6). See also Figure S4
Figure 5
Figure 5. The TRIF-dependent effector cytokines IFN-β and IL-1β augment the Tfh and antibody responses to the killed vaccine
(A) Percentages of CXCR5+ICOS+CD4+ T cells in naïve and live EC vaccinated mice indicated on the X-axis. (B) Percentages of CXCR5+ICOS+CD4+ T cells in indicated naïve or vaccinated chimeric mice generated as in Figure 4A, except here lethally irradiated mice received 20% B cell-sufficient WT BM and 80% B cell-deficient μMT BM on either WT, Irf3−/− or Casp1−/−Casp129mt/129mt backgrounds. (C) Percentages of ICOS+CXCR5+CD4+ T cells in WT or Trif−/− mice that had received indicated vaccines. (D, E) Flow cytometry dot plots (D) and percentages (E) of CXCR5+ICOS+ cells within gated Vα2+Vβ5+ transgenic OT-II TCR expressing CD4+ T cells adoptively transferred into mice 48 hours before receiving indicated vaccines. (F, G) Immunofluorescence micrographs at 4X magnification on spleen sections from indicated mice stained for B220, GL-7, IgG and CD3. Scale bar = 300μm (F), and quantification of GC per mm2 (G) where each symbol represents an individual field of view. (H) Day 25 serum titers of class-specific anti-EC antibodies. Tfh and GC responses were measured in spleens on days 5 and 7, respectively, after vaccination of indicated mice with 5×10⁷ live EC, HKEC or HKEC+RNA(30μg). 50 U IFN-β and/or 1μg IL-1β were injected intravenously 20 hours after vaccination. NS, not significant (P > 0.05); *, P<0.05; **, P≤0.01 and ***, P≤0.001 (two-tailed unpaired t test). Data are mean±s.e.m. Numbers adjacent to outlined areas indicate percent of cells in gates. Mouse numbers are in (A) WT(naive, n=6 ;+EC, n=5), Trif−/−(naive, n=4 ;+EC, n=4), Ifnar−/−(naive, n=4 ;+EC, n=3), Irf3−/−(naive, n=3 ;+EC, n=3) Casp1−/−Casp11129mt/129mt(naive, n=4 ;+EC, n=4); (B) WT(WT B cells)(naive, n=10 ;+EC, n=13; +HKEC, n=10; +HKEC+RNA, n=8), Irf3−/−(WT B cells)(naive, n=7 ;+EC, n=10; +HKEC, n=9; +HKEC+RNA, n=9), Casp1−/−Casp11129mt/129mt(WT B cells)(naive, n=8 ;+EC, n=10; +HKEC, n=9; +HKEC+RNA, n=9); (C) WT(naive, n=7 ; +EC, n=6; +HKEC, n=7; +HKEC+IFN-β, n=5; +HKEC+IL-1β, n=12; +HKEC+IFN-β+IL-1β, n=9) and Trif−/−(+EC, n=4; +EC+IFN-β+IL-1β, n=9); (E) WT+OTII T cells(+HKEC+RNA, n=6; +HKEC+IFN-β+IL-1β, n=8+HKEC+RNA, n=8; +HKEC+IFN-β+IL-1β, n=8); (G) WT(+EC, n=5; +HKEC, n=4; +HKEC+IFN-β, n=6; +HKEC+IL-1β, n=6; +HKEC+IFN-β+IL-1β, n=6) and Trif−/− (+EC, n=3; +EC+IFN-β+IL-1β, n=4); (H) WT(+EC, n=25; +HKEC, n=28; +HKEC+IFN-β+IL-1β, n=23) and Trif (+EC, n=22; +HKEC, n=15; +HKEC+IFN-β+IL-1β, n=18). See also Figure S5.
Figure 6
Figure 6. T cell intrinsic role of TRIF-dependent cytokines in Tfh cell differentiation
(A) Flow cytometry dot plots for ICOS and CXCR5 on CD45.1+ or CD45.2+CD4+ T cells that were either Ifnar−/− or Il1r1−/−. (B) Percentages of ICOS+CXCR5+CD4+ T cells within the CD45.1+ or CD45.2+ populations from (A). (C) Quantitative RT-PCR analysis for Bcl6, Il21 and Tbx21 transcripts in sorted CD44+CD4+ T cells either CD45.1+ (WT) or CD45.2+ (Ifnar−/− or Il1r1−/−). Data represent expression relative to β-actin. (A, B, C) Data on pre-gated CD4+ T cells showing endogenous CD45.1+ cells or adoptively transferred CD45.2+ (Ifnar−/− or Il1r1−/−) CD4+ T cells isolated from spleens 5 days after injection of 5×10⁷ live EC. NS, not significant (P > 0.05); *, P<0.05; **, P≤0.01 and ***, P≤0.001 (two-tailed unpaired t test). Data are mean±s.e.m. Numbers adjacent to outlined areas indicate percent of cells in gates. Mouse numbers are in (B) WT+ Ifnar−/− T cells (naive, n= 3; +EC, n=6) and WT+ Il1r1−/− T cells (naive, n= 3; +EC, n=5); (C) WT+ Ifnar−/− T cells (+EC, n=6) and WT+ Il1r1−/− T cells (+EC, n=7). See also Figure S6.

Similar articles

Cited by

References

    1. Auffray C, Fogg D, Garfa M, Elain G, Join-Lambert O, Kayal S, Sarnacki S, Cumano A, Lauvau G, Geissmann F. Monitoring of blood vessels and tissues by a population of monocytes with patrolling behavior. Science. 2007;317:666–670. - PubMed
    1. Baumgarth N. The double life of a B-1 cell: self-reactivity selects for protective effector functions. Nat Rev Immunol. 2011;11:34–46. - PubMed
    1. Blander JM. A long-awaited merger of the pathways mediating host defence and programmed cell death. Nat Rev Immunol. 2014;14:601–618. - PubMed
    1. Blander JM, Sander LE. Beyond pattern recognition: five immune checkpoints for scaling the microbial threat. Nat Rev Immunol. 2012;12:215–225. - PubMed
    1. Broz P, Dixit VM. Inflammasomes: mechanism of assembly, regulation and signalling. Nat Rev Immunol. 2016;16:407–420. - PubMed

Publication types

MeSH terms