. 2018 May 4;8(5):1687-1699.
doi: 10.1534/g3.117.300548.

Haplotype-Based Genome-Wide Prediction Models Exploit Local Epistatic Interactions Among Markers

Affiliations

Haplotype-Based Genome-Wide Prediction Models Exploit Local Epistatic Interactions Among Markers

Yong Jiang et al. G3 (Bethesda). .

Abstract

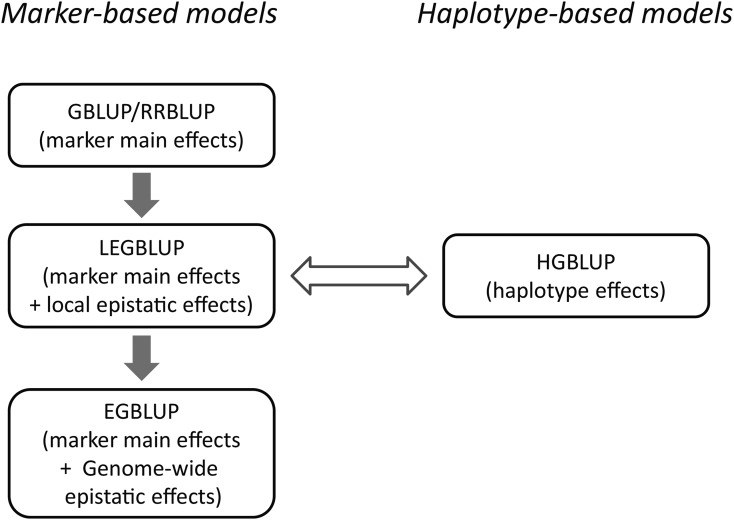
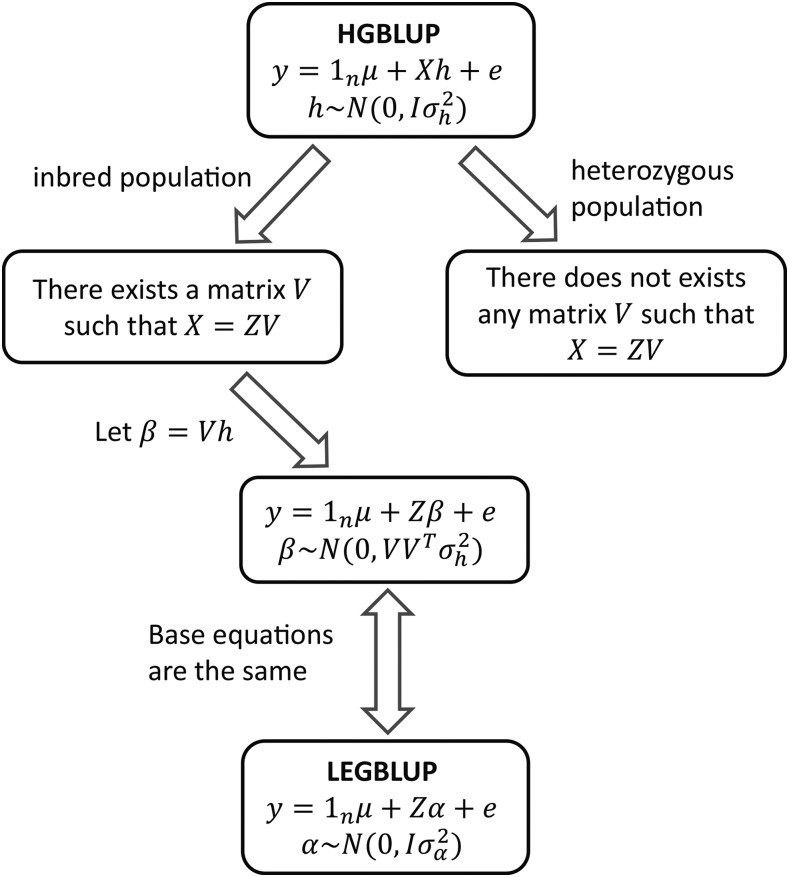
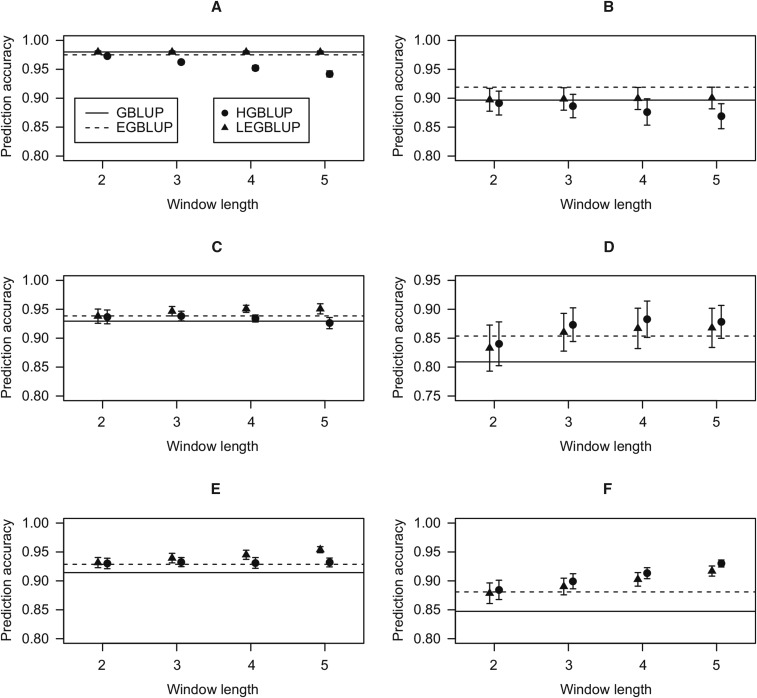
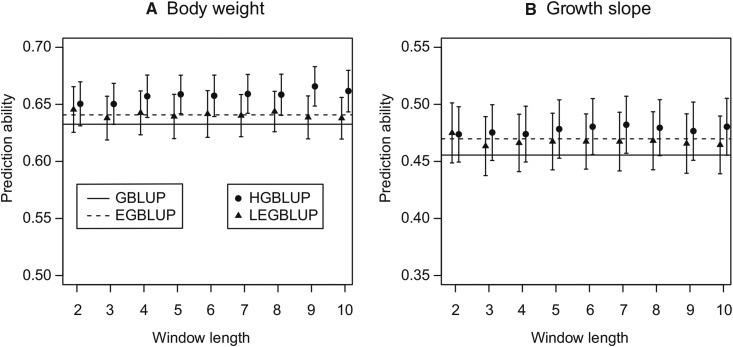
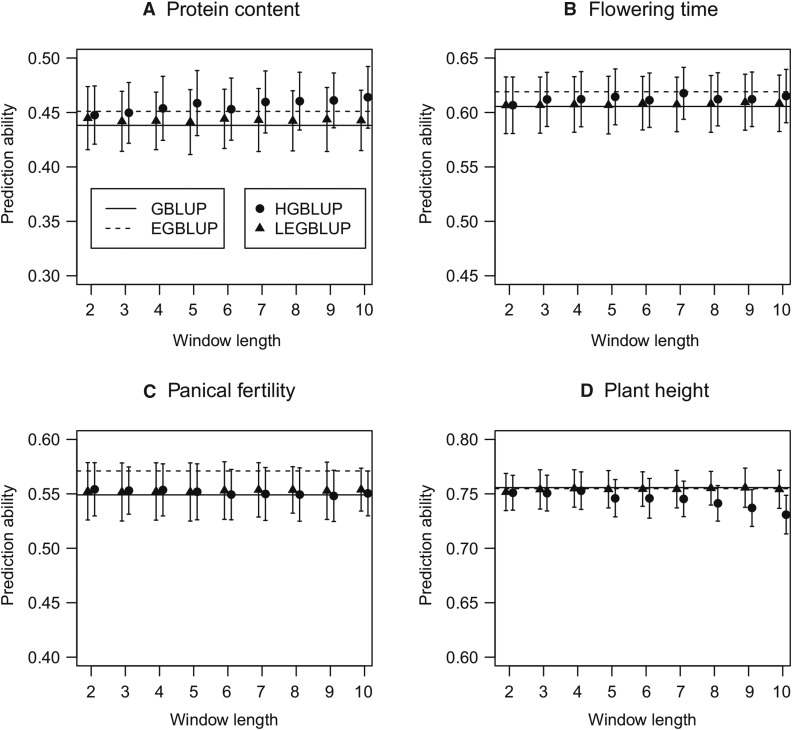
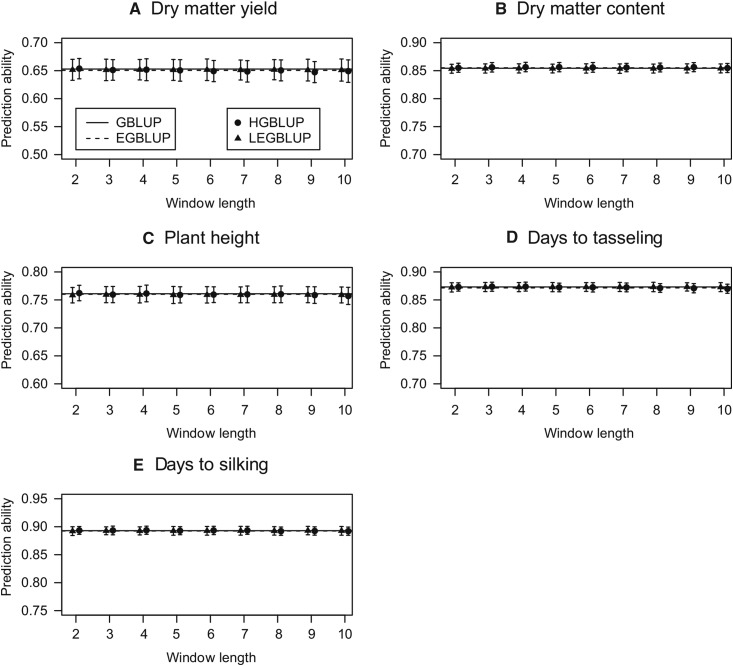
Genome-wide prediction approaches represent versatile tools for the analysis and prediction of complex traits. Mostly they rely on marker-based information, but scenarios have been reported in which models capitalizing on closely-linked markers that were combined into haplotypes outperformed marker-based models. Detailed comparisons were undertaken to reveal under which circumstances haplotype-based genome-wide prediction models are superior to marker-based models. Specifically, it was of interest to analyze whether and how haplotype-based models may take local epistatic effects between markers into account. Assuming that populations consisted of fully homozygous individuals, a marker-based model in which local epistatic effects inside haplotype blocks were exploited (LEGBLUP) was linearly transformable into a haplotype-based model (HGBLUP). This theoretical derivation formally revealed that haplotype-based genome-wide prediction models capitalize on local epistatic effects among markers. Simulation studies corroborated this finding. Due to its computational efficiency the HGBLUP model promises to be an interesting tool for studies in which ultra-high-density SNP data sets are studied. Applying the HGBLUP model to empirical data sets revealed higher prediction accuracies than for marker-based models for both traits studied using a mouse panel. In contrast, only a small subset of the traits analyzed in crop populations showed such a benefit. Cases in which higher prediction accuracies are observed for HGBLUP than for marker-based models are expected to be of immediate relevance for breeders, due to the tight linkage a beneficial haplotype will be preserved for many generations. In this respect the inheritance of local epistatic effects very much resembles the one of additive effects.

Keywords: GenPred; Genomic Selection; Shared Data Resources; epistasis; genome-wide prediction; haplotype; local epistatic effect.


Figures

Figure 1
Figure 1
Characteristics and relationships of genomic prediction models considered in this study. The genetic effects exploited by the model were indicated in brackets. GBLUP: genome-wide best linear unbiased prediction; RRBLUP: ridge regression best linear unbiased prediction; EGBLUP: extended genome-wide best linear unbiased prediction; LEGBLUP: locally extended genome-wide best linear unbiased prediction; HGBLUP: haplotype-based genome-wide best linear unbiased prediction. The gray arrows indicate that the models differ with regard to the type and number of effects that are exploited. The equivalence of the LEGBLUP and HGBLUP models that was shown for inbred populations is illustrated by the double arrow.
Figure 2
Figure 2
A brief outline of the theoretical relationship between HGBLUP and LEGBLUP. The essential case of a single haplotype block is outlined. LEGBLUP: locally extended genome-wide best linear unbiased prediction; HGBLUP: haplotype-based genome-wide best linear unbiased prediction. In the HGBLUP model, y denotes the vector of observed phenotypic values, 1n is the n-dimensional vector of ones where n is the number of genotypes, μ is the common intercept term, h is the vector of haplotype allele effects inside the haplotype block, X is the corresponding design matrix, and e is the residual term. In the LEGBLUP model, α is the vector of main additive and local epistatic effects of all markers inside the haplotype block, Z is the corresponding design matrix, other terms are the same as in HGBLUP. In both models, μ is assumed to be a fixed unknown parameter, h and α are random vectors with distributions shown in the figure, and the residual term eN(0,Iσe2).
Figure 3
Figure 3
Prediction accuracies of GBLUP, EGBLUP, LEGBLUP, and HGBLUP using simulated data. The data were simulated assuming a trait with the following features; h2 = 0.7, σa2/σaa2 = 4:3. (a). Scenario 1: only additive effects were simulated; (b) Scenario 2: additive and global epistatic effects were simulated; (c) Scenario 3: additive and digenic local epistatic effects were simulated, effects were assumed to be independent; (d) Scenario 4: additive, digenic and higher-order local epistatic effects were simulated, effects were assumed to be independent; (e) Scenario 5: additive and digenic local epistatic effects were simulated, effects were assumed to be correlated; (f) Scenario 6: additive, digenic and higher-order local epistatic effects were simulated, effects were assumed to be correlated; GBLUP: genome-wide best linear unbiased prediction; EGBLUP: extended genome-wide best linear unbiased prediction; LEGBLUP: locally extended genome-wide best linear unbiased prediction; HGBLUP: haplotype-based genome-wide best linear unbiased prediction. Standard errors of the estimated prediction accuracies are indicated by whiskers. The LEGBLUP and HGBLUP models were implemented with different window length (i.e., number of SNPs), varying from 2 to 5.
Figure 4
Figure 4
Prediction abilities of GBLUP, EGBLUP, LEGBLUP and HGBLUP for the mouse data set. GBLUP: genomic best linear unbiased prediction; EGBLUP: extended genomic best linear unbiased prediction; LEGBLUP: locally extended genomic best linear unbiased prediction; HGBLUP: haplotype-based genomic best linear unbiased prediction. Standard errors of the estimated prediction abilities are indicated by whiskers. The LEGBLUP and HGBLUP models were implemented with different window length (i.e., number of SNPs), varying from 2 to 10.
Figure 5
Figure 5
Prediction abilities of GBLUP, EGBLUP, LEGBLUP and HGBLUP for the rice data set. GBLUP: genomic best linear unbiased prediction; EGBLUP: extended genomic best linear unbiased prediction; LEGBLUP: locally extended genomic best linear unbiased prediction; HGBLUP: haplotype-based genomic best linear unbiased prediction. Whiskers indicate standard errors of the estimated prediction abilities. The LEGBLUP and HGBLUP models were implemented with different window length (i.e., number of SNPs), varying from 2 to 10.
Figure 6
Figure 6
Prediction abilities of GBLUP, EGBLUP, LEGBLUP and HGBLUP for the maize data set. GBLUP: genomic best linear unbiased prediction; EGBLUP: extended genomic best linear unbiased prediction; LEGBLUP: locally extended genomic best linear unbiased prediction; HGBLUP: haplotype-based genomic best linear unbiased prediction. Standard errors of the estimated prediction abilities are indicated by whiskers. The LEGBLUP and HGBLUP models were implemented with different window length (i.e., number of SNPs), varying from 2 to 10.

References

    1. Akdemir D., Jannink J. L., 2015. Locally epistatic genomic relationship matrices for genomic association and prediction. Genetics 199(3): 857–871. 10.1534/genetics.114.173658 - DOI - PMC - PubMed
    1. Akdemir D., Jannink J. L., Isidro-Sánchez J., 2017. Locally epistatic models for genome-wide prediction and association by importance sampling. Genet. Sel. Evol. 49(1): 74 10.1186/s12711-017-0348-8 - DOI - PMC - PubMed
    1. Bauer E., Falque M., Walter H., Bauland C., Camisan C., et al. , 2013. Intraspecific variation of recombination rate in maize. Genome Biol. 14(9): R103 10.1186/gb-2013-14-9-r103 - DOI - PMC - PubMed
    1. Boichard D., Guillaume F., Baur A., Croiseau P., Rossignol M. N., et al. , 2012. Genomic selection in French dairy cattle. Anim. Prod. Sci. 52(3): 115–120. 10.1071/AN11119 - DOI
    1. Calus M. P. L., Meuwissen T. H. E., de Roos A. P. W., Veerkamp R. F., 2008. Accuracy of genomic selection using different methods to define haplotypes. Genetics 178(1): 553–561. 10.1534/genetics.107.080838 - DOI - PMC - PubMed

Publication types

Substances

LinkOut - more resources