. 2018 May;59(5):820-829.
doi: 10.1194/jlr.M081745. Epub 2018 Mar 16.

In vitro exploration of ACAT contributions to lipid droplet formation during adipogenesis

Affiliations

In vitro exploration of ACAT contributions to lipid droplet formation during adipogenesis

Yuyan Zhu et al. J Lipid Res. 2018 May.

Abstract

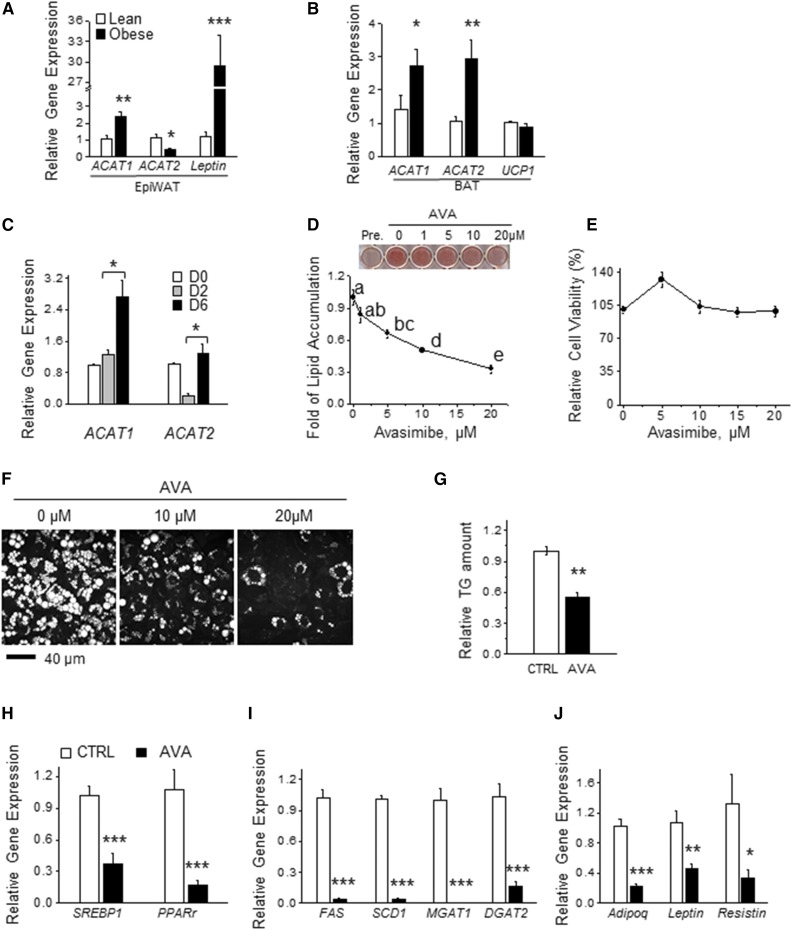
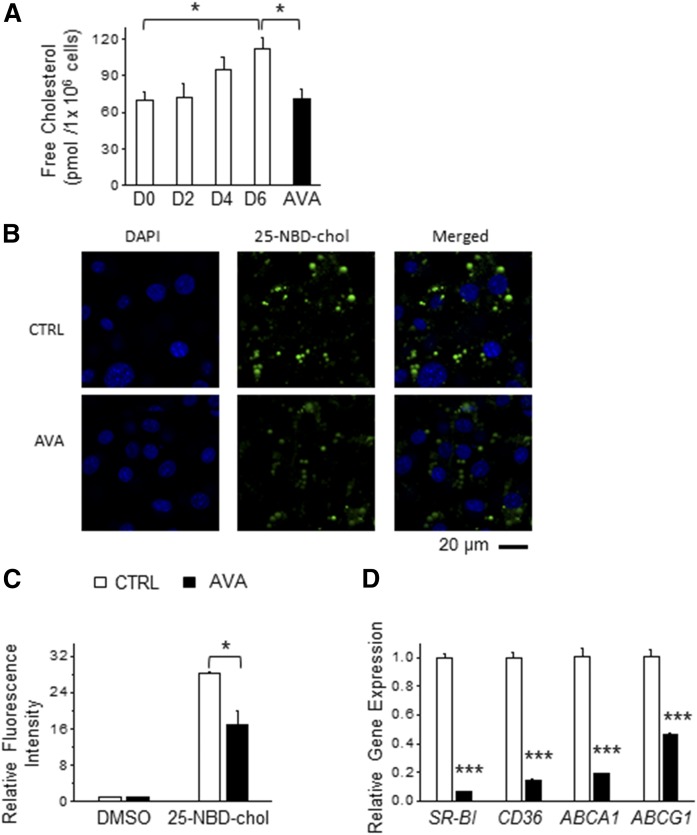
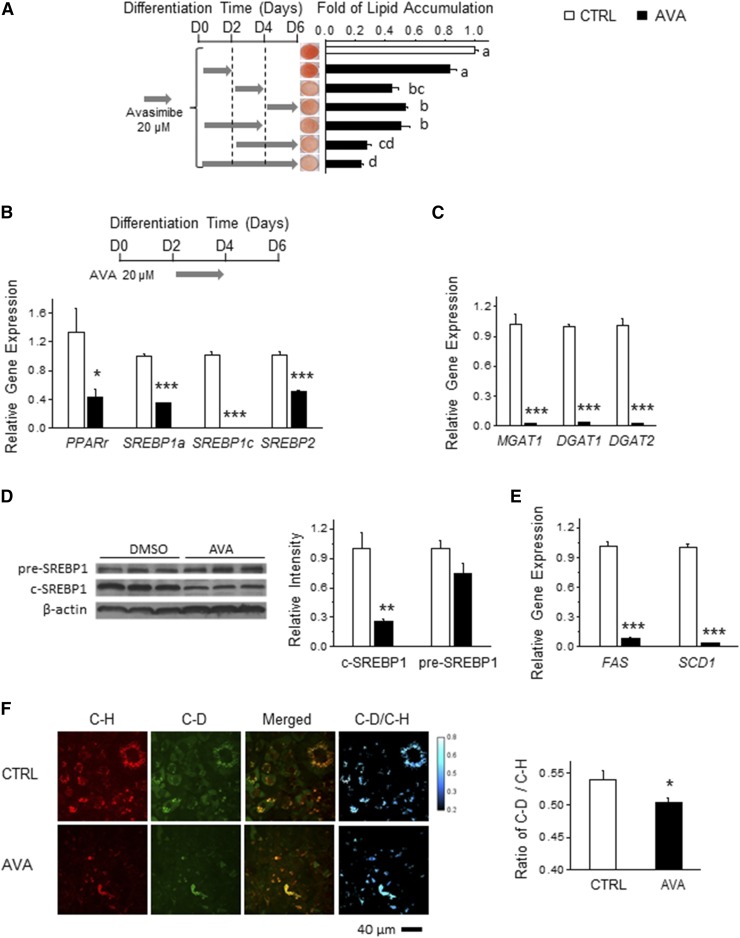
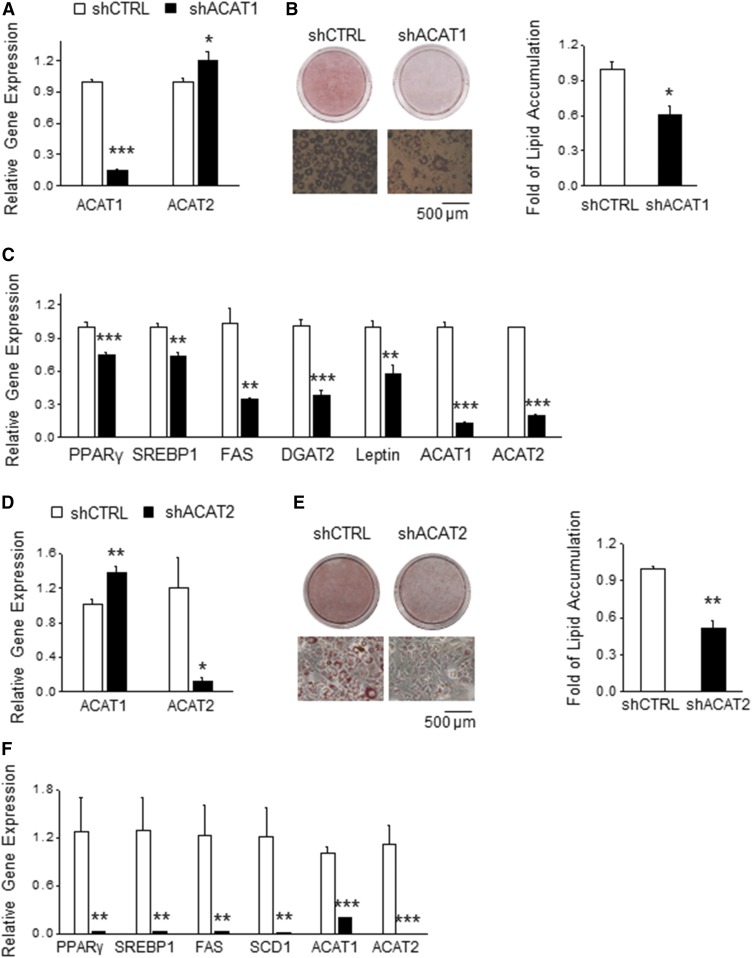
As adipose tissue is the major cholesterol storage organ and most of the intracellular cholesterol is distributed to lipid droplets (LDs), cholesterol homeostasis may have a role in the regulation of adipocyte size and function. ACATs catalyze the formation of cholesteryl ester (CE) from free cholesterol to modulate the cholesterol balance. Despite the well-documented role of ACATs in hypercholesterolemia, their role in LD development during adipogenesis remains elusive. Here, we identify ACATs as regulators of de novo lipogenesis and LD formation in murine 3T3-L1 adipocytes. Pharmacological inhibition of ACAT activity suppressed intracellular cholesterol and CE levels, and reduced expression of genes involved in cholesterol uptake and efflux. ACAT inhibition resulted in decreased de novo lipogenesis, as demonstrated by reduced maturation of SREBP1 and SREBP1-downstream lipogenic gene expression. Consistent with this observation, knockdown of either ACAT isoform reduced total adipocyte lipid content by approximately 40%. These results demonstrate that ACATs are required for storage ability of lipids and cholesterol in adipocytes.

Keywords: acyl-CoA:cholesterol acyltransferase; adipocytes; avasimibe; cholesterol metabolism; fatty acid synthesis; triglycerides.


Conflict of interest statement

The other authors declare no conflicts of interest.

Figures

Fig. 1.
Fig. 1.
Inhibiting ACATs suppresses lipid accumulation in adipocytes during adipogenesis. A, B: mRNA levels of ACAT1 and ACAT2 determined by real-time PCR in epiWAT (A) and BAT (B) from chow diet-fed mice and age-matched DIO mice (male, 13 weeks old, C57BL/6J, Jackson Laboratory). Signals were normalized to RPL27 (n = 4). C: mRNA levels of ACAT1 and ACAT2 in 3T3-L1 cells during adipogenesis as determined by real-time PCR and normalized to β-actin (n = 3, repeated three times). D: ORO staining from adipocytes (day 6) that were differentiated with or without AVA at various concentrations (1–20 μM) for 6 days (n = 3). E: Adipocyte viability upon AVA treatment (0–20 μM) for 48 h was determined by MTT assay (n = 3). F: CARS image analysis of intracellular LDs in adipocytes that were differentiated in the presence or absence of AVA (10 or 20 μM) for 9 days (n = 3). G: Mature adipocytes differentiated with or without AVA (20 μM) during days 4–8 were subjected to TLC. The intensity of the TG spots in TLC was quantified by ImageJ and normalized to control (CTRL) (n = 3). mRNA levels of genes involved in adipogenic transcription program (H), lipid synthesis (I), and adipokine production (J) were determined by real-time PCR with signals normalized β-actin (n = 3). All the data were normalized to control. Data presented are expressed as mean ± SEM. Student’s two-tailed t-test was applied to A–C and G–J. *P < 0.05; **P < 0.01; ***P < 0.001. One-way ANOVA with Bonferroni post hoc test was applied in D and E, and different lowercase letters indicate significant different (P < 0.05).
Fig. 2.
Fig. 2.
ACAT inhibition alters the intracellular cholesterol balance in adipocytes. A: The 3T3-L1 preadipocytes were differentiated in the presence or absence of 20 μM AVA for 6 days and the cells were harvested at various stages of adipogenesis as indicated [day (D)0, D2, D4, and D6] for measurement of FC level (n = 3). B: The 3T3-L1 adipocytes (D6) treated with a fluorescent cholesterol analog (25-NBD-chol, 1 μg/ml) and DAPI in the presence or absence of AVA (20 μM) for 2 h. Representative images by confocal microscopy are presented (n = 3). C: The 3T3-L1 cells (day 2) were cultured in medium supplemented with or without AVA (20 μM) or 25-NBD-chol (1 μg/ml) for 48 h, and then the intracellular fluorescence intensity was quantified (n = 5). Data were normalized to DMSO-treated control. D: mRNA levels of genes involved in cholesterol uptake (SR-BI and CD36) and cholesterol efflux (ABCA1 and ABCG1) were determined by real-time PCR and normalized to β-actin (n = 3). Data presented are the mean ± SEM; *P < 0.05; **P < 0.01; ***P < 0.001.
Fig. 3.
Fig. 3.
ACAT inhibition reduces lipogenic gene expression in adipogenesis through inhibition of SREBP1 processing. A: The 3T3-L1 preadipocytes were differentiated with or without AVA (20 μM) for the indicated period of time. After 6 days of differentiation, ORO staining was performed and the corresponding quantification was calculated to determine the intracellular lipid content. Representative images are presented (n = 3). The 3T3-L1 cells were cocultured with or without AVA (20 μM) for 48 h from day 2 and were harvested to determine mRNA levels of PPARγ, SREBP1a, SREBP1c, and SREBP2 (B) and MGAT1, DGAT1, and DGAT2 (C) (n = 3). Adipocytes differentiated in the presence or absence of AVA (10 μM, during days 2–6) were subjected to immunoblotting to determine SREBP1 level (D) and real-time PCR to determine the mRNA levels of SREBP1 downstream genes (E) (n = 3). F: During adipogenesis, 3T3-L1 cells (day 2) were cultured in medium supplemented with deuterium-glucose (D-Glucose) (25 mM) in the presence or absence of AVA (10 μM) for 2 days. SRS imaging was taken at the carbon-deuterium (C-D) vibration (∼2,120 cm−1) and the carbon-hydrogen (C-H) vibration (∼2,850 cm−1), indicating total lipids and deuterium-incorporated lipids, respectively. ImageJ was used for quantification (n = 3). Data are presented are mean ± SEM. One-way ANOVA with Bonferroni post hoc test was applied to A, and different lowercase letters indicate significant different (P < 0.05). Student’s two-tailed t-test was applied to B–F. *P < 0.05; **P < 0.01; ***P < 0.001.
Fig. 4.
Fig. 4.
ACAT1 or ACAT2 are required for lipid accumulation. A: Preadipocytes were infected with lentiviral particles carrying either an ACAT1-targeted shRNA (shACAT1) or a scrambled shRNA (shCTRL). mRNA levels of ACAT1 and ACAT2 in ACAT1 knockdown (shACAT1) or control (shCTRL) preadipocytes were measured by real-time PCR (n = 3) to determine the knockdown specificity and efficacy. B: shCTRL and shACAT1 preadipocytes were differentiated to mature adipocytes for 6 days and then stained with ORO to quantify lipid content (n = 3). Representative images are shown. C: Mature adipocytes differentiated from shCTRL and shACAT1 preadipocytes were subjected to real-time PCR to determine the mRNA levels of genes involved in adipogenesis, lipid synthesis, and adipokine production (n = 3). D: mRNA levels of ACAT1 and ACAT2 in ACAT2 knockdown (shACAT2) or control (shCTRL) preadipocytes were measured by real-time PCR (n = 3) to determine the knockdown specificity and efficacy. E: shCTRL and shACAT2 preadipocytes were differentiated to mature adipocytes for 6 days and then stained with ORO to quantify lipid content (n = 3). Representative images are shown. F: Mature adipocytes differentiated from shCTRL and shACAT2 preadipocytes were subjected to real-time PCR to determine mRNA levels of genes involved in adipogenesis and lipid synthesis (n = 3). Data presented are the mean ± SEM and analyzed by Student’s two-tailed t-test. *P < 0.05; **P < 0.01; ***P < 0.001.

Similar articles

Cited by

References

    1. Farkas J., Angel A., and Avigan M. I.. 1973. Studies on the compartmentation of lipid in adipose cells. II. Cholesterol accumulation and distribution in adipose tissue components. J. Lipid Res. 14: 344–356. - PubMed
    1. Prattes S., Horl G., Hammer A., Blaschitz A., Graier W. F., Sattler W., Zechner R., and Steyrer E.. 2000. Intracellular distribution and mobilization of unesterified cholesterol in adipocytes: triglyceride droplets are surrounded by cholesterol-rich ER-like surface layer structures. J. Cell Sci. 113: 2977–2989. - PubMed
    1. Le Lay S., Krief S., Farnier C., Lefrere I., Le Liepvre X., Bazin R., Ferre P., and Dugail I.. 2001. Cholesterol, a cell size-dependent signal that regulates glucose metabolism and gene expression in adipocytes. J. Biol. Chem. 276: 16904–16910. - PubMed
    1. Kovanen P. T., Nikkila E. A., and Miettinen T. A.. 1975. Regulation of cholesterol synthesis and storage in fat cells. J. Lipid Res. 16: 211–223. - PubMed
    1. Schreibman P. H., and Dell R. B.. 1975. Human adipocyte cholesterol. Concentration, localization, synthesis, and turnover. J. Clin. Invest. 55: 986–993. - PMC - PubMed

Publication types

LinkOut - more resources