. 2018 May 4;293(18):6893-6904.
doi: 10.1074/jbc.RA118.002703. Epub 2018 Mar 16.

Kv2.1 clusters on β-cell plasma membrane act as reservoirs that replenish pools of newcomer insulin granule through their interaction with syntaxin-3

Affiliations

Kv2.1 clusters on β-cell plasma membrane act as reservoirs that replenish pools of newcomer insulin granule through their interaction with syntaxin-3

Dafna Greitzer-Antes et al. J Biol Chem. .

Abstract

The voltage-dependent K+ (Kv) channel Kv2.1 is a major delayed rectifier in many secretory cells, including pancreatic β cells. In addition, Kv2.1 has a direct role in exocytosis at an undefined step, involving SNARE proteins, that is independent of its ion-conducting pore function. Here, we elucidated the precise step in exocytosis. We previously reported that syntaxin-3 (Syn-3) is the key syntaxin that mediates exocytosis of newcomer secretory granules that spend minimal residence time on the plasma membrane before fusion. Using high-resolution total internal reflection fluorescence microscopy, we now show that Kv2.1 forms reservoir clusters on the β-cell plasma membrane and binds Syn-3 via its C-terminal C1b domain, which recruits newcomer insulin secretory granules into this large reservoir. Upon glucose stimulation, secretory granules were released from this reservoir to replenish the pool of newcomer secretory granules for subsequent fusion, occurring just adjacent to the plasma membrane Kv2.1 clusters. C1b deletion blocked the aforementioned Kv2.1-Syn-3-mediated events and reduced fusion of newcomer secretory granules. These insights have therapeutic implications, as Kv2.1 overexpression in type-2 diabetes rat islets restored biphasic insulin secretion.

Keywords: Kv2.1; insulin secretion; newcomer insulin granule; pancreatic islet; plasma membrane; potassium channel; syntaxin-3; vesicles.


Conflict of interest statement

The authors declare that they have no conflicts of interest with the contents of this article

Figures

Figure 1.
Figure 1.
Depletion of Kv2.1 in β-cells reduces exocytosis of insulin secretory granules with the consequent inhibition of biphasic GSIS. A and B, Ad-Kv2.1 shRNA versus Ad-scrambled shRNA (as control) treatment of Wistar rat islets (A, representative of two separate experiments; second experiment is shown in Fig. S3A) and in INS 832/13 (INS) cells (B, two experiments run on the same blot) resulted in reduction of Kv2.1 expression. C, rat (Wistar) islet perifusion showing the effects of Ad-Kv2.1 shRNA versus Ad-scrambled shRNA treatments on biphasic GSIS. AUC graph, first phase, 11–23 min; second phase, 23–41 min; GSIS, n = 3, analyzed by independent-samples t test. D and E, patch-clamp Cm of INS cells transfected with pcDNA3-Kv2.1-shRNA/mCherry (rat sequence). The mCherry-expressing cells (indicated by arrows) showed reduction of Kv2.1 expression (D, bottom images) versus control PLKO-mCherry plasmid, showing abundant Kv2.1 (D, top images). E, rescue of Kv2.1 shRNA-mCherry with pcDNA3-Kv2.1-EGFP (mouse sequence) in INS cells. Top, representative recordings of a train of 500-ms depolarizations from −70 to 10 mV; bottom left, cumulative changes in Cm normalized to basal cell membrane capacitance (fF/pF); bottom right, total Cm1st-10th pulses, n = 3 experiments with 9–13 cells/group. F, separating the independent effects of Kv2.1 on Kv currents (left) and exocytosis (right); n = 3 experiments with 13–15 cells/group for i and n = 13 cells/group for ii. In control INS cells, stromatoxin (100 nm) inhibited Kv current but did not affect exocytosis. In Kv2.1-overexpressing INS cells, the greatly enhanced Kv currents were inhibited by stromatoxin to a similar extent as control INS cells, but the Kv2.1-enhanced increase in exocytosis was not affected by stomatoxin. All values in this figure represent mean ± S.E. (error bars); *, p < 0.05; **, p < 0.01.
Figure 2.
Figure 2.
Kv2.1-WT or Kv2.1-pore mutant can potentiate insulin granule fusion with consequent enhancement of biphasic GSIS. A, GK rat islet levels of SNARE and Kv2.1 proteins. Bottom graph, summary of three experiments. B, Ad-Kv2.1-WT or Ad-Kv2.1-pore mutant overexpression in GK rat islets can rescue the deficient biphasic GSIS (n = 3). AUC analysis on the right is ANOVA with post hoc test for two-by-two comparisons. C, Kv2.1 overexpression in INS cells infected with Ad-Kv2.1-WT or Ad-Kv2.1-pore mutant. Ad-GFP infection of GK islets was used as a control. Bottom graph, summary of three experiments. D, depletion of Kv2.1 inhibits secretory granule fusion (Ad-NPY-pHluorin used to track granule fusion) in INS cells. Histograms show secretory granule fusion events in first (first 5 min after 16.7 mm glucose + 10 nm GLP-1 stimulation) and second phases (5–15 min) in control (top) versus Kv2.1 shRNA–treated cells (middle). Bottom, summary of secretory granule fusion in first and second phases (n = 3 experiments with 9–10 cells/group). E, Kv2.1 overexpression increases secretory granule fusion (first- and second-phase GSIS) that is independent of channel pore function. The number of fusion events of INS cells expressing NPY-pHluorin and Kv2.1-mCherry (top, white bars, n = 6 experiments with 28–32 cells/group) or Kv2.1-pore mutant-mCherry (bottom, gray bars, n = 3 experiments with 10 cells/group) was compared and normalized to cells expressing NPY-pHluorin only (black bars). All values in this figure represent mean ± S.E. (error bars); *, p < 0.05; **, p < 0.01.
Figure 3.
Figure 3.
Spatial and functional relationships between insulin secretory granule fusion and Kv2.1 clusters on the β-cell plasma membrane. A, TIRFM imaging of stimulated (18 mm glucose + 10 nm GLP-1) INS cells cotransfected with Kv2.1-mCherry (red) and NPY-pHluorin (green). B, the same INS cell as in A with grid division drawn onto the entire plasma membrane surface into 5.12-μm2 ROIs for analysis. C, positive correlation between the number of secretory granule fusion events and Kv2.1 cluster density. Shown is a summary of 25 cells from eight experiments. The values were normalized to the maximal value and averaged according to cluster density at 20% increments. D and E, positive correlation between the number of secretory granule fusion events and cluster density is independent of channel electrical function. D, comparison of “cluster density versus number of events” correlation between Kv2.1 (black) and Kv2.1-pore mutant (gray). E, change in the number of fusion events from baseline cluster density (n = 3 with 10 cells). Inset, no significant change in the Pearson correlation coefficients. F, secretory granule fusions occur adjacent to the Kv2.1 clusters and are independent of channel electrical function. Top, example of distance assessment (see enlarged image, bottom) between a secretory granule fusion event (green, top serial images showing newcomer secretory granule fusion) and nearest Kv2.1-mCherry cluster (red), which is indicated by the white diagonal bar drawn from the center of the Kv2.1 cluster to the center of the insulin granule. Left graph, correlation between percentage of fusion events and distance from the nearest Kv2.1-mCherry (white; n = 8 with 25 cells) or Kv2.1-pore mutant-mCherry (gray; n = 3 with 10 cells) cluster. Right graph, mean distance from nearest Kv2.1-mCherry (white; n = 3 with 11 cells) or Kv2.1-pore mutant-mCherry (gray; n = 3 with 11 cells) cluster. G, analysis of fusion events at distance <1 μm. An “on-cluster” secretory granule fusion event is considered to be within a distance of 0–0.5 μm, as shown in A, and an “adjacent-to-cluster” secretory granule fusion is considered to be within a distance of 0.5–1 μm, as shown in B. Bottom, comparison of the percentage of fusion events that were “on” clusters and “adjacent to” clusters. All values in this figure represent mean ± S.E. (error bars); *, p < 0.05; **, p < 0.01.
Figure 4.
Figure 4.
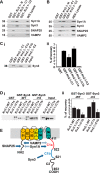
Syntaxin-3 interactions with distinct C1 domains within Kv2.1 form a Kv2.1-SNARE excitosome complex. A, endogenous SNARE proteins from INS cells bind different cytoplasmic domains of Kv2.1 (C1, aa 411–621; C2, aa 622–853; N, aa 1–186). B, overexpressed SNARE proteins in HEK293 cells bind different cytoplasmic domains of Kv2.1. For VAMP2, we used VAMP2-EGFP to obtain clearer signals, which explains the larger molecular weight. A and B, representative blot of three separate experiments. A second experiment for A and B is shown in Fig. S3 (B and C). C, GST (as control) and GST-Kv2.1-C1, -C1a (aa 411–522), -C1b (aa 523–621), or -C2, all bound to GSH-agarose beads, were used to pull down Syn-3 from the lysate extract of HEK293 cells transfected with Syn-3. i, representative blot of three separate experiments. ii, mean ± S.E. (error bars) summary results from three experiments. Ponceau S staining of a blot to demonstrate the similar amounts of GST fusion proteins loaded is shown in Fig. S3D. D, Syn-3-WT and its cytoplasmic H3 domain bind to distinct ΔKv2.1-C1a (deletion of aa 411–522) or -ΔC1b (deletion of aa 523–621). i, representative blot of three separate experiments, with the equal inputs shown on the right. Ponceau S staining of the blot to demonstrate the similar amounts of GST proteins loaded is shown in Fig. S2E. ii, summary of densitometry scanning of the specific bands from the three experiments. The results are expressed as mean ± S.E., and values normalized to the percentage of recovery from the cell lysate extract (500 μg of protein) were used for the binding (inputs shown in i (right)). E, a schematic showing where these different SNARE proteins bind to the different cytoplasmic domains of Kv2.1. Dark blue arrows, strong binding; light blue arrows, weaker binding.
Figure 5.
Figure 5.
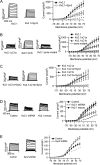
Syntaxin-3 affects β-cell Kv2.1 currents. A, Syn-3 overexpression in HEK293 cells inhibited the current amplitude of co-expressed Kv2.1. Left, representative whole-cell currents of Kv2.1 without or with Syn-3; Right, current-voltage relationship of Kv2.1 without (n = 9 cells) or with Syx-3 (n = 7 cells). Currents were normalized by cell capacitance to yield current density. Values are means ± S.E. (error bars); *, p < 0.05. B and C, comparison of current amplitudes of Kv2.1 and Kv2.1-pore mutant (in B) and also Kv2.1ΔC1a and Kv2.1ΔC1b without (B) and with Syn-3 co-expression (in C) in HEK293 cells (n = 10–11 cells). D, Kv current, reduced by Kv2.1 depletion in INS cells, can be rescued by Kv2.1 restoration. Left, representative Kv currents in INS cells infected with control shRNA/mCherry (control), Kv2.1 shRNA/mCherry (Kv2.1 shRNA–treated), or Kv2.1 shRNA/mCherry plus Kv2.1-EGFP (Kv2.1 rescue). Right, current–voltage relationship. Values are means ± S.E. (n = 9–10 cells). *, p < 0.05; **, p < 0.01; control versus Kv2.1 shRNA–treated cells or rescue of Kv2.1 shRNA–treated cells. E, Syn-3 depletion in INS cells by shRNA treatment increased Kv current amplitudes. Left, representative Kv currents from control/mCherry and Syn-3 shRNA/mCherry–treated INS cells. Right, current–voltage relationships; shRNA control (n = 9 cells) and Syn-3 shRNA (n = 9 cells).
Figure 6.
Figure 6.
Distinct Kv2.1 C1a/b domains have different effects on secretory granule fusion and its relationship to the Kv2.1 clusters. A, schematic description of Kv2.1 domain deletion constructs. B, comparison of Kv2.1/Kv2.1ΔC1a/Kv2.1ΔC1b-mCherry cluster formation (black/gray/white, respectively); number of clusters (left), size of clusters (middle), and overall mCherry fluorescence (right) (n = 3 with 15–17 cells). C, C1b deletion reverses the effect of Kv2.1 on secretory granule fusion. Number of secretory granule fusion events normalized to cells expressing NPY-pHluorin only (striped, as control), compared with cells expressing NPY-pHluorin and Kv2.1-mCherry (black) or Kv2.1ΔC1a-mCherry (gray) or Kv2.1ΔC1b-mCherry (white, n = 3 with 10–11 cells, one-way ANOVA Bonferroni test). D, changes in the profile of “secretory granule fusion distance from Kv2.1 clusters” caused by the Kv2.1 domain deletions. Shown is a percentage of fusion events (main graph) and mean distance from the nearest cluster (top inset) comparison of Kv2.1-mCherry (black), Kv2.1ΔC1a-mCherry (gray), and Kv2.1ΔC1b-mCherry (white; n = 3 with 10–11 cells, one-way ANOVA Bonferroni test). E, correlation between the number of fusion events and Kv2.1 cluster density was impaired in Kv2.1ΔC1a-mCherry and completely abolished in Kv2.1ΔC1b-mCherry. Left, comparison of “cluster density versus number of fusion events” correlation between Kv2.1-mCherry (black), Kv2.1ΔC1a-mCherry (gray) and Kv2.1ΔC1b-mCherry (white). Middle, comparison of the change in the number of fusion events from baseline Kv2.1 cluster density of the three constructs (n = 3 with 10–11 cells). Right, change in the Pearson correlation coefficients. All values in this figure represent mean ± S.E. (error bars). *, p < 0.05; **, p < 0.01.

Similar articles

Cited by

References

    1. Jacobson D. A., Kuznetsov A., Lopez J. P., Kash S., Ammälä C. E., and Philipson L. H. (2007) Kv2.1 ablation alters glucose-induced islet electrical activity, enhancing insulin secretion. Cell Metab. 6, 229–235 10.1016/j.cmet.2007.07.010 - DOI - PMC - PubMed
    1. MacDonald P. E., Sewing S., Wang J., Joseph J. W., Smukler S. R., Sakellaropoulos G., Wang J., Saleh M. C., Chan C. B., Tsushima R. G., Salapatek A. M., and Wheeler M. B. (2002) Inhibition of Kv2.1 voltage-dependent K+ channels in pancreatic beta-cells enhances glucose-dependent insulin secretion. J. Biol. Chem. 277, 44938–44945 10.1074/jbc.M205532200 - DOI - PubMed
    1. Singer-Lahat D., Sheinin A., Chikvashvili D., Tsuk S., Greitzer D., Friedrich R., Feinshreiber L., Ashery U., Benveniste M., Levitan E. S., and Lotan I. (2007) K+ channel facilitation of exocytosis by dynamic interaction with syntaxin. J. Neurosci. 27, 1651–1658 10.1523/JNEUROSCI.4006-06.2007 - DOI - PMC - PubMed
    1. Feinshreiber L., Singer-Lahat D., Ashery U., and Lotan I. (2009) Voltage-gated potassium channel as a facilitator of exocytosis. Ann. N.Y. Acad. Sci. 1152, 87–92 10.1111/j.1749-6632.2008.03997.x - DOI - PubMed
    1. Feinshreiber L., Singer-Lahat D., Friedrich R., Matti U., Sheinin A., Yizhar O., Nachman R., Chikvashvili D., Rettig J., Ashery U., and Lotan I. (2010) Non-conducting function of the Kv2.1 channel enables it to recruit vesicles for release in neuroendocrine and nerve cells. J. Cell Sci. 123, 1940–1947 10.1242/jcs.063719 - DOI - PubMed

Publication types

MeSH terms