. 2018 Mar 16;9(1):1104.
doi: 10.1038/s41467-018-03130-1.

Functional architecture of reward learning in mushroom body extrinsic neurons of larval Drosophila

Affiliations

Functional architecture of reward learning in mushroom body extrinsic neurons of larval Drosophila

Timo Saumweber et al. Nat Commun. .

Abstract

The brain adaptively integrates present sensory input, past experience, and options for future action. The insect mushroom body exemplifies how a central brain structure brings about such integration. Here we use a combination of systematic single-cell labeling, connectomics, transgenic silencing, and activation experiments to study the mushroom body at single-cell resolution, focusing on the behavioral architecture of its input and output neurons (MBINs and MBONs), and of the mushroom body intrinsic APL neuron. Our results reveal the identity and morphology of almost all of these 44 neurons in stage 3 Drosophila larvae. Upon an initial screen, functional analyses focusing on the mushroom body medial lobe uncover sparse and specific functions of its dopaminergic MBINs, its MBONs, and of the GABAergic APL neuron across three behavioral tasks, namely odor preference, taste preference, and associative learning between odor and taste. Our results thus provide a cellular-resolution study case of how brains organize behavior.


Conflict of interest statement

The authors declare no competing financial interests.

Figures
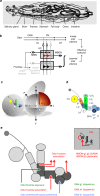
Fig. 1
Fig. 1
Overview of anatomical relationships, and of the requirement of MBINs and MBONs across behavioral tasks. a Body plan of stage 3 Drosophila larvae (modified with permission from ref. ); brain refers to the ventral nerve cord plus the two brain hemispheres toward the left. Also see Supplementary Movies 1-5. b Simplified diagram of the olfactory and gustatory pathways, and of the organization of innate and learned olfactory behavior, as well as of innate gustatory behavior in the larva. AL antennal lobe, KC Kenyon cells of the mushroom body, LH lateral horn, MBIN mushroom body input neurons, MBON mushroom body output neurons, OSN olfactory sensory neurons, PN olfactory projection neurons. The red triangles indicate KC output synapses that are modulated by the joint presentation of odor and fructose; gray and black triangles indicate silent and active synapses, respectively. The gray boxes indicate mushroom body compartments. The integral sign implies that learned odor valence can be based on an integration of MBON activity from multiple compartments. Circuitry within the AL and the APL neuron are not displayed. Also, circuit motifs newly discovered, namely KC-KC connections as well as KC > DAN and MBIN > MBON connections, are not included. c Schematic of the location and orientation of the mushroom body within the larval nervous system. The mushroom body is only shown in one hemisphere. A anterior, D dorsal, P posterior, L lateral, M medial, V ventral. d Organization of the larval mushroom body in 11 compartments. CX calyx; IP and LP intermediate and lower peduncle; LA lateral appendix; UVL, IVL, and LVL upper, intermediate, and lower vertical lobe; SHA, UT, IT, LT shaft as well as upper, intermediate, and lower toe of the medial lobe. Single-letter synonyms of compartment names are given as “a–k”; these letters are used to indicate compartment innervation by the MBEs in Fig. 2. e Summary of the requirement of MBINs, MBONs, and of the APL neuron across behavioral tasks, based on the data shown in Figs. 2–4, and Supplementary Table 1
Fig. 2
Fig. 2
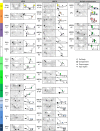
Atlas of the MBE neurons. Identification of the MBE neurons by compartment innervation, input and output regions, and cell body location. The MBE of only one hemisphere is shown (for the segmentally homologous, unpaired OAN-a1 and OAN-a2 neurons the cell bodies are located at the midline). For MBE pairs, the second neuron of the pair is indicated by its cell body and stippled primary neurite. Anatomical panels show z-projections of those parts of the larval brain that include the respective MBE. MBEs are visible based on antibody staining against the flp-out effectors; anti-neuroglian staining in gray reveals the local brain structure. Note that the nomenclature for the MBIN-l1 and MBON-p1 neuron is based on their compartment innervation in the stage 1 larva (Supplementary Fig. 1). For more details, see Supplementary Table 1
Fig. 3
Fig. 3
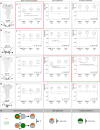
Requirement of shaft and lower-toe MBE neurons for odor-fructose reward association, odor preference, and fructose preference. ad Expression pattern of the indicated split-Gal4 strain and schematic overview of the covered MBE (leftmost column), associative performance indices for odor-fructose reward associative memory (second column), and preference scores of experimentally naïve larvae for the odor (third column) as well as for fructose (rightmost column). Experimental larvae are heterozygous for the indicated split-Gal4 drivers and for UAS-Kir2.1::GFP, leading to silencing of the respective MBE (MBE block). Control larvae are heterozygous for only the UAS-Kir2.1::GFP effector (effector Ctrl), or for only the split-Gal4 drivers (driver Ctrl). Box plots show the median as the middle line, and 25/75% and 10/90% quantiles as box boundaries and whiskers, respectively. Sample sizes are indicated within the figure. At plain horizontal lines * refers to P < 0.05/2 and ns to P > 0.05/2 in Mann–Whitney U-tests; at horizontal lines with arrowheads, ns refers to P > 0.05 in Kruskal–Wallis tests. Significant phenotypes upon silencing a given MBE are marked by red frames. The preference scores underlying the associative performance indices in the leftmost panels can be found in Supplementary Fig. 6. Expression patterns of split-Gal4 drivers covering the respective MBE are visible based on anti-GFP staining (black); the central nervous system is visible based on background fluorescence (gray). e From left to right the panel shows schematics of the odor-fructose reward association task, and of the odor preference or fructose preference tasks. The orange cloud indicates n-amylacetate as the odor, the green circle indicates the fructose reward. In half of the cases the sequence of training trials was as indicated in the leftmost display, while for the other half it was reversed (not shown)
Fig. 4
Fig. 4
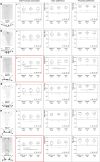
Requirement of upper and middle toe and of lower vertical lobe MBE neurons across behavioral tasks. af Analyses corresponding to the ones from Fig. 3a–d, for the upper and middle toe and of lower vertical lobe MBE neurons. Columns show, from left to right, the expression pattern of the indicated split-Gal4 strain and schematic overview of the covered MBE, the associative performance indices for odor-fructose reward associative memory, and the preference scores of experimentally naïve larvae for the odor as well as for fructose. Experimental larvae are heterozygous for the indicated split-Gal4 drivers and for UAS-Kir2.1::GFP, leading to silencing of the respective MBE (MBE block). Control larvae are heterozygous for only the UAS-Kir2.1::GFP effector (effector Ctrl), or for only the split-Gal4 drivers (driver Ctrl). Sample sizes are indicated within the figure. At plain horizontal lines * refers to P < 0.05/2 and ns to P > 0.05/2 in Mann–Whitney U-tests; at horizontal lines with arrowheads, ns refers to P > 0.05 in Kruskal–Wallis tests. Significant phenotypes upon silencing a given MBE are marked by red frames. The preference scores underlying the associative performance indices in the leftmost panels can be found in Supplementary Fig. 6. Expression patterns of split-Gal4 drivers covering the respective MBE are visible based on anti-GFP staining (black); the central nervous system is visible based on background fluorescence (gray). Behavioral tasks and other details were as in Fig. 3e
Fig. 5
Fig. 5
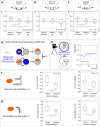
Sufficiency of DAN-h1 and of DAN-i1 as an internal reward signal. ac Larvae are trained for association of odor with optogenetic activation of dopaminergic mushroom body input neurons (DANs) as an internal reward. The panels show a schematic of the covered DAN, plus the associative performance indices after odor-internal-reward training. Experimental larvae are heterozygous for the split-Gal4 drivers as well as UAS-ChR2-XXL (DAN activation). Control larvae are heterozygous for only the UAS-ChR2-XXL effector (effector Ctrl), or only the indicated split-Gal4 drivers (driver Ctrl). Activation of DAN-h1 (a) and activation of DAN-i1 (c) is sufficient as a reward, whereas activation of DAN-k1 is not (b). Other details as in Fig. 3. The preference scores underlying the associative performance indices can be found in Supplementary Fig. 9. d Schematic of the odor-internal-reward association task. The blue color indicates optogenetic activation of the respectively covered neuron. Other details as in Fig. 3. eg Locomotor “footprint” of memories established by optogenetic DAN activation as reward. e Sample tracks by individual larvae recorded after training with paired (top left) or unpaired (bottom left) presentation of odor and DAN-i1 activation. Right: after paired training with odor and DAN-i1 activation, larvae have a higher preference for the odor than after unpaired training. Displayed is the median preference of the full sample (N = 13 with approx. 30 animals each) over time (sliding average 5 s). Similar results were observed for DAN-h1 activation (not shown). f Modulations of head cast (HC) rate. After paired training with either DAN-i1 (middle panel) or DAN-h1 activation (right panel) the larvae perform more HCs while they are heading away from the odor than while they are heading toward it, measured as a positive HC rate modulation; after unpaired training the opposite effect is observed. g HC direction. Larvae direct their HCs more toward the odor after paired training than after unpaired training with DAN-i1 (middle panel) or DAN-h1 activation (right panel). Sample sizes are indicated within the figure. *P < 0.05 in Mann–Whitney U-tests. Other details as in Fig. 3
Fig. 6
Fig. 6
Timing-dependent valence reversal of optogenetic DAN-i1 reinforcement. a Larvae of the experimental genotype (heterozygous for SS00864-Gal4 and UAS-ChR2-XXL) were trained by presenting an odor and optogenetically activating DAN-i1, at various relative timings. A 30-s odor presentation either preceded a 30-s DAN-i1 activation (forward conditioning, plotted as negative inter-stimulus interval, ISI) or the odor followed DAN-i1 activation (backward conditioning, positive ISI). Subsequently, larvae were tested for their odor preference. For short-interval forward conditioning, positive scores reveal appetitive memory. For short-interval backward conditioning, negative scores indicate aversive memory. b Appetitive memory scores were confirmed after forward conditioning (ISI of −10 s) for the experimental genotype (heterozygous for SS00864-Gal4 and UAS-ChR2-XXL (DAN-i1 activation)). Control larvae heterozygous for only UAS-ChR2-XXL (effector Ctrl) or SS00864-Gal4 (driver Ctrl) did not show any memory. c Aversive memory scores were also confirmed after backward conditioning (ISI of 30 s) for the experimental genotype (DAN-i1 activation). Again, genetic controls did not show any memory. The preference scores underlying the associative performance indices can be found in Supplementary Fig. 11. Sample sizes are indicated within the figure. Other details as in Fig. 3. d Schematic of the timed odor-DAN-i1 association protocol. Orange and blue colors indicate the timing of odor presentation and optogenetic activation of DAN-i1, respectively, during each of the three 12-min training trials. In the example timeline, paired training (top) involves intervals between the onset of odor presentation and optogenetic activation of −30 s (left) and 30 s (right); the timing of events for unpaired training is shown to the bottom. After either paired or unpaired training, larvae are tested for their preference for the odor; the associative performance indices (PIs) are then calculated from the difference in preference between paired-trained and unpaired-trained larvae
Fig. 7
Fig. 7
Structure of DAN-i1 and connectivity with KCs. ad KC-to-DAN-i1 and DAN-i1-to-KC connections. a, b Electron microscopy reconstruction of the right-hemisphere DAN-i1 neuron and the mushroom body Kenyon cells (KCs). The regions highlighted by the box are shown in b for all KCs, and separated for KCs only presynaptic, pre- and postsynaptic, only postsynaptic, or not connected to DAN-i1, at a slightly tilted view relative to a. KC-to-DAN-i1 and DAN-i1-to-KC synapses are marked in blue and red, respectively. Inter-hemispheric connections are from aberrantly developed KCs, not from the so-called ni-cells. The left-hemisphere DAN-i1 neuron is organized correspondingly (not shown). c Quantification of the numbers of single- and multiple-claw KCs synaptically connected to DAN-i1 (or not), separated for KCs that are only presynaptic, pre- and postsynaptic, only postsynaptic, or not connected to DAN-i1. This analysis does not suggest discrepancies between the right- and left-hemisphere DAN-i1, or between the DAN-i1 innervation of ipsi- and contralateral KCs. d For each KC reciprocally connected with DAN-i1, the numbers of KC-to-DAN-i1 versus DAN-i1-to-KC synapses are plotted (Supplementary Fig. 13a shows the data separated by hemisphere; Supplementary Fig. 13b plots each KC’s connections to the ipsi- and contralateral DAN-i1). The observed correlation (Spearman rank correlation analyses at P < 0.05) contrasts with the case of the APL neuron (Fig. 9c). e Relation of DAN-i1 to the KC inputs. The total input that DAN-i1 receives from KCs that in turn receive their input from the indicated classes on PNs was considered to calculate the matrix product of the respective PN-to-KC and KC-to-DAN-i1 connections. This was done separately for the right-hemisphere DAN-i1 and its connections to the contralateral and the ipsilateral KCs (top), and for the left-hemisphere DAN-i1 (bottom). The observed correlations (also see Supplementary Fig. 13c) reveal that both DAN-i1s sample the KC coding space in the same way (corresponding to the case of the APL neuron: Fig. 9d and Supplementary Fig. 17a), and that both DAN-i1s sample the ipsi- and contralateral KC coding space in the same way. A visualization of DAN-i1 connectivity within the mushroom body using a standard force-directed algorithm can be found in Supplementary Movie 6
Fig. 8
Fig. 8
Requirement of DAN-h1, but not DAN-i1, for specifically odor-fructose association. a Silencing of DAN-h1 by means of Kir2.1::GFP expression leads to an impairment in odor-fructose association (left) (these data include the odor-fructose association data shown in Fig. 3a), but not in odor-lowsalt (middle) and not in odor-amino-acid association (right). b Silencing DAN-i1 does not impair association of odor with any of these three rewards (odor-fructose association data include those shown in Fig. 4a). Likewise, odor-arabinose association as well as odor-sorbitol association is unaffected by silencing of DAN-i1 (Supplementary Fig. 15). The preference scores underlying the associative performance indices can be found in Supplementary Fig. 14. c From left to right, schematics of the indicated association tasks are shown. The green, light blue, and brown circles indicate the fructose, odor-lowsalt, and amino-acid reward, respectively. Other details as in Fig. 3
Fig. 9
Fig. 9
Structure and connectivity of the APL neuron. The larval APL neuron provides distributive inhibition within the mushroom body. a Electron microscopy reconstruction of the APL neuron relative to the mushroom body Kenyon cells (KCs) in both brain hemispheres (left panel). Sites of KC-to-APL synapses are marked in blue (middle panel) and sites of APL-to-KC synapses in red (right panel). Inter-hemispheric connections are from aberrantly developed “freak” KCs and do not correspond to the so-called ni-cells identified by Kunz et al.; these were found in the electron microscopy reconstruction but are not shown here. b KCs are classified as either being only presynaptic, as both pre- and postsynaptic, as only postsynaptic, or as unconnected to the APL neuron. The anatomy of these KC classes is shown, including their number and the number and the site of KC-to-APL synapses (blue) and APL-to-KC synapses (red). KCs without any synapse with the APL neuron are apparently lacking proper dendrites and axons, and therefore are classified as young and probably immature. c For each KC the number of APL-to-KC synapses versus respectively the number of all KC-to-APL synapses (top), the number of KC to APL-dendrite synapses (middle), and the number of KC to APL-axon synapses are plotted (bottom). The type of KC (single-claw, multi-claw, and young KC) is color-coded. The lack of correlation implies that inhibition through the APL neuron is distributive, i.e., with only random levels of KCx-APL-KCx feedback. This lack of correlation contrasts to the case of the reciprocal connections between the KCs and the DAN-i1 neuron (Fig. 7d). A quantification of the connections of APL with non-KCs can be found in Supplementary Fig. 17b. d The APL neuron samples the complete information delivered to the KCs via projection neurons (PNs). To determine the total input that the APL neuron receives from KCs that in turn receive their input from uniglomerular olfactory PNs (black and dark gray), multiglomerular olfactory PNs (light gray), and non-olfactory PNs (white), the matrix product of the respective PN-to-KC connections and the KC-to-APL connections was calculated. The sampling of the KC coding space by the right- and the left-hemisphere APL neuron is strongly correlated (Supplementary Fig. 17a). A visualization of APL connectivity within the mushroom body using a standard force-directed algorithm and based on the connectivity data available with ref. can be found in Supplementary Movie 7
Fig. 10
Fig. 10
Behavioral function of the APL neuron. a Silencing the APL neuron impairs odor-fructose association. Shown are the expression pattern of the split-Gal4 strain covering the APL neuron and a schematic of its innervation of the mushroom body (top left), associative performance indices for odor-fructose reward associative memory (top right), and a schematic of the behavioral task. Experimental larvae are heterozygous for the split-Gal4 driver and for UAS-Kir2.1::GFP (APL block). Control larvae are heterozygous for only the UAS-Kir2.1::GFP effector (effector Ctrl), or for only the split-Gal4 driver (driver Ctrl). Other details as in Fig. 3. The preference scores underlying the associative performance indices can be found in Supplementary Fig. 6. b Silencing the APL neuron does not impair innate odor preference; other details as in a. c Silencing the APL neuron does not impair innate fructose preference; other details as in a. d Optogenetic activation of the APL neuron during training abolishes odor-fructose association. Experimental larvae are heterozygous for the split-Gal4 driver as well as UAS-ChR2-XXL (APL activation). Control larvae are heterozygous for only the UAS-ChR2-XXL effector (effector Ctrl), or for only the split-Gal4 drivers (driver Ctrl). Other details as in Figs. 3 and 5a–d. The preference scores underlying the associative performance indices can be found in Supplementary Fig. 18. The bottom of the panel shows a schematic of the behavioral task. Blue shading indicates optogenetic stimulation. Other details as in Fig. 3. e As in d, showing that activation of the APL neuron during only the test reduces odor-fructose association scores. f, g As in b, c, showing that activation of the APL neuron in experimentally naïve animals affects neither odor preference nor fructose preference

Similar articles

Cited by

References

    1. Heisenberg M. Mushroom body memoir: from maps to models. Nat. Rev. Neurosci. 2003;4:266–275. doi: 10.1038/nrn1074. - DOI - PubMed
    1. Strausfeld NJ, Sinakevitch I, Brown SM, Farris SM. Ground plan of the insect mushroom body: functional and evolutionary implications. J. Comp. Neurol. 2009;513:265–291. doi: 10.1002/cne.21948. - DOI - PMC - PubMed
    1. Davis RL. Olfactory learning. Neuron. 2004;44:31–48. doi: 10.1016/j.neuron.2004.09.008. - DOI - PubMed
    1. Menzel R. The insect mushroom body, an experience-dependent recoding device. J. Physiol. Paris. 2014;108:84–95. doi: 10.1016/j.jphysparis.2014.07.004. - DOI - PubMed
    1. Owald D, Waddell S. Olfactory learning skews mushroom body output pathways to steer behavioral choice in Drosophila. Curr. Opin. Neurobiol. 2015;35:178–184. doi: 10.1016/j.conb.2015.10.002. - DOI - PMC - PubMed

Publication types

LinkOut - more resources