. 2018 Mar 16;9(1):1103.
doi: 10.1038/s41467-018-02820-0.

Thalamocortical dysrhythmia detected by machine learning

Affiliations

Thalamocortical dysrhythmia detected by machine learning

Sven Vanneste et al. Nat Commun. .

Abstract

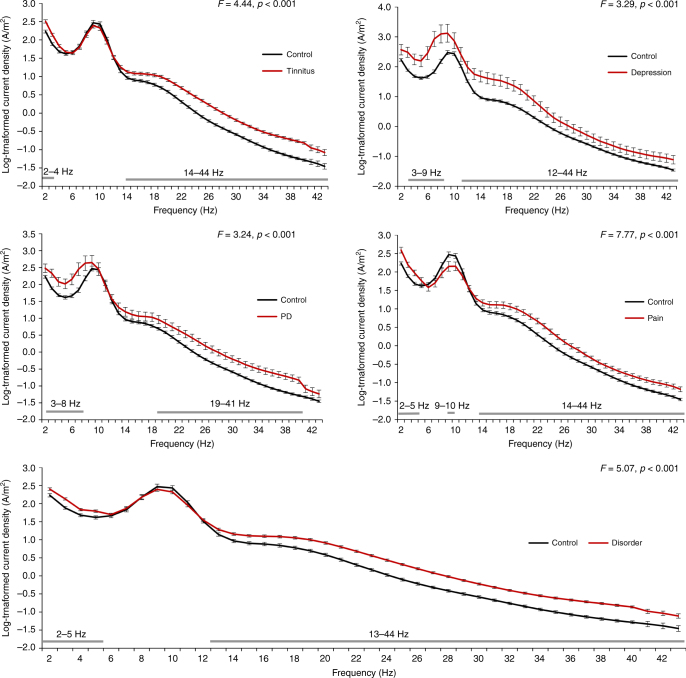
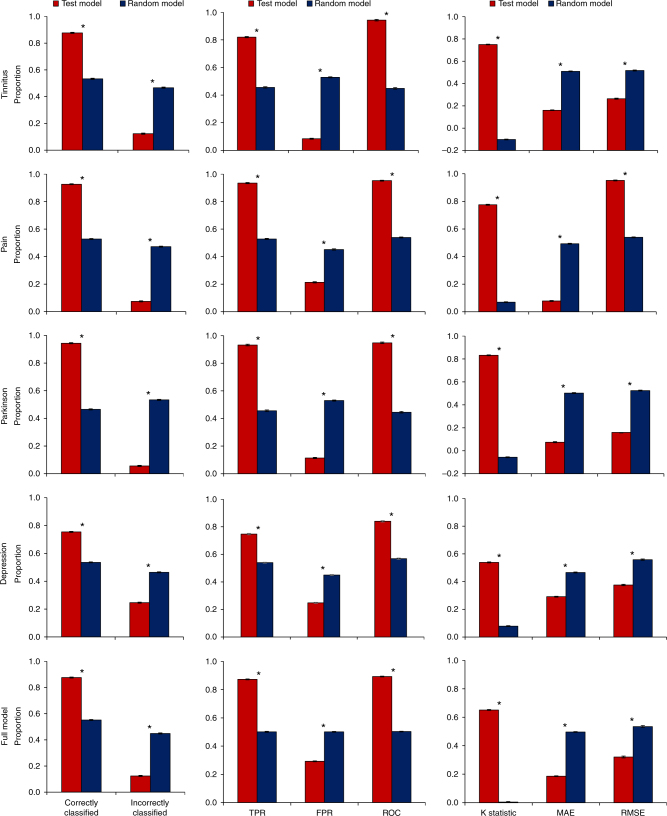
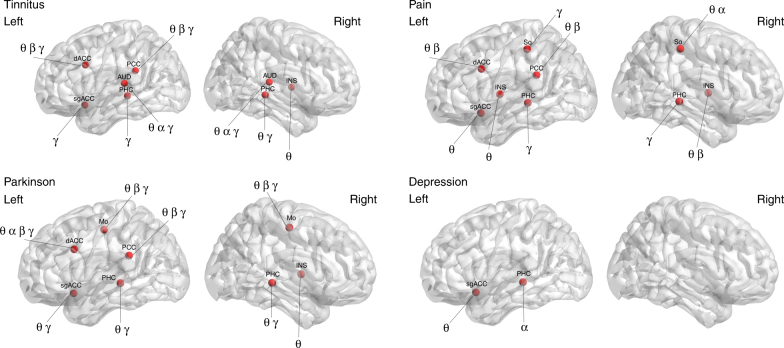
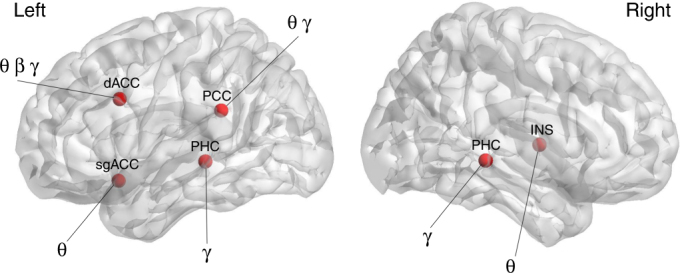
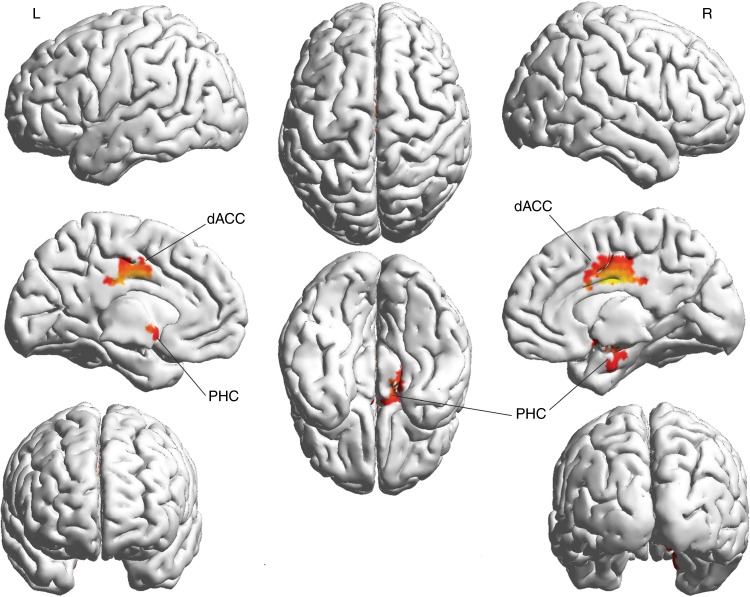
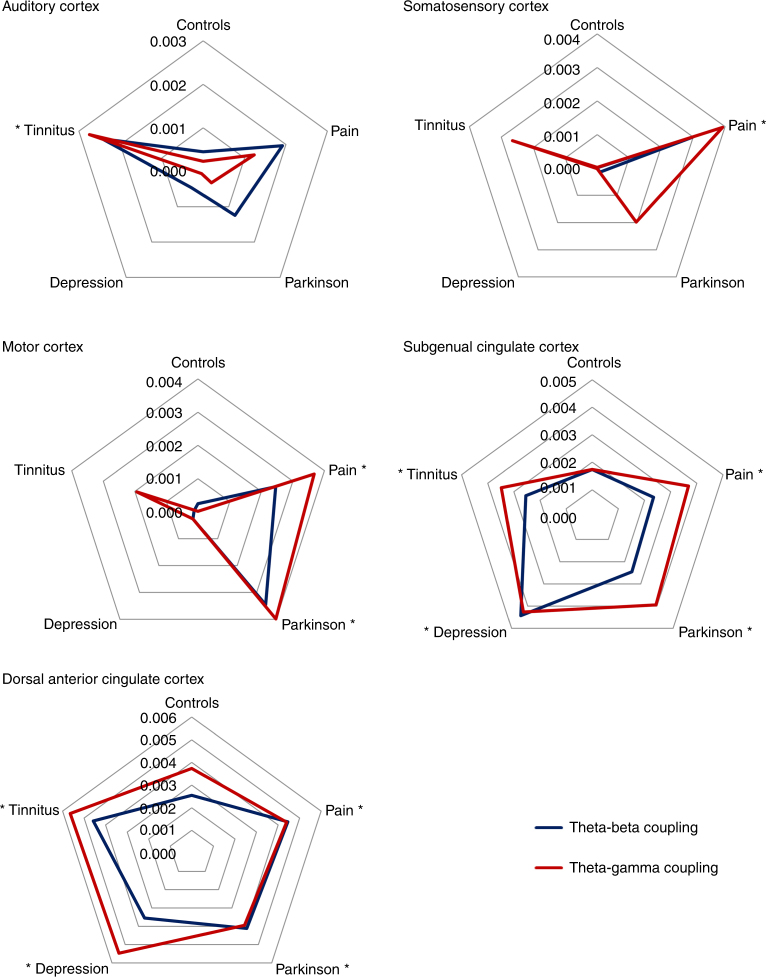
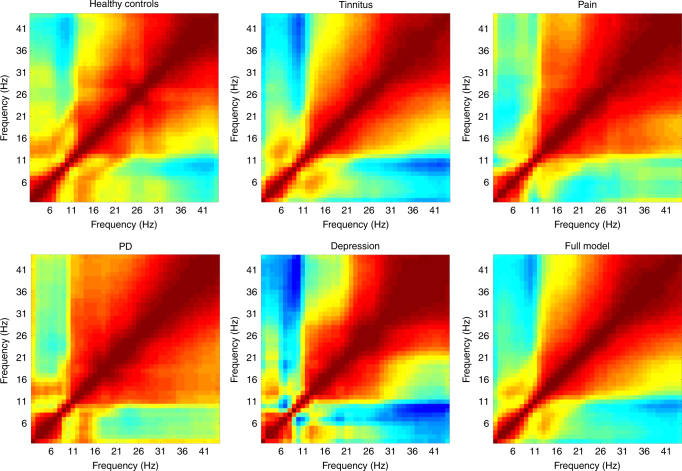
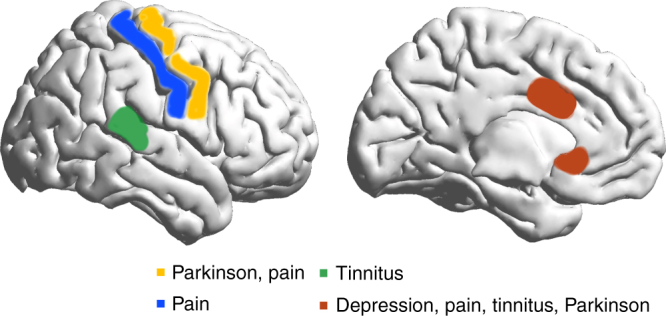
Thalamocortical dysrhythmia (TCD) is a model proposed to explain divergent neurological disorders. It is characterized by a common oscillatory pattern in which resting-state alpha activity is replaced by cross-frequency coupling of low- and high-frequency oscillations. We undertook a data-driven approach using support vector machine learning for analyzing resting-state electroencephalography oscillatory patterns in patients with Parkinson's disease, neuropathic pain, tinnitus, and depression. We show a spectrally equivalent but spatially distinct form of TCD that depends on the specific disorder. However, we also identify brain areas that are common to the pathology of Parkinson's disease, pain, tinnitus, and depression. This study therefore supports the validity of TCD as an oscillatory mechanism underlying diverse neurological disorders.


Conflict of interest statement

The authors declare no competing financial interests.

Figures

Fig. 1
Fig. 1
A comparison of the power spectrum of patients (i.e., tinnitus (N = 153), pain (N = 78), PD (N = 31), and depression (N = 15) with healthy control subjects (N = 264) showed a significant effect for tinnitus (F = 4.44, p < 0.001), pain (F = 7.77, p < 0.001) PD (F = 3.24, p < 0.001), and depression (F = 3.29, p < 0.001) for specific frequencies (see gray bars in figure). A general comparison between all patients (N = 277) (i.e., tinnitus, pain, PD, and depression) and healthy control subjects showed a significant effect (F = 5.07, p < 0.001) for specific frequencies (see gray bars in figure). Black whiskers indicate standard errors
Fig. 2
Fig. 2
Obtained model using support vector machine learning to differentiate between, respectively, tinnitus (N = 153) vs. controls (N = 264), pain (N = 78) vs. controls (N = 264), Parkinson disease (N = 31) vs. controls (N = 264), and depression (N = 15) vs. controls (N = 264). SVM learning can differentiate between the disorder and healthy control subjects with an accuracy between 75 and 94% in comparison to a random model. The true-positive rate (TPR) of the models and the area under the curve (ROC) were significantly higher for the obtained model in comparison to the random model, while the false-positive rate (FPR) was significantly lower. A significant difference was also identified by comparing the κ-statistic MAE and RMSE, confirming the strength of the tested model in comparison to the random model. (*indicates a significant effect p < 0.001). Black whiskers indicate standard errorsPlease check the edits to the sentence 'The true positive rate.........' in figure caption 2 is ok.Is correct
Fig. 3
Fig. 3
Support vector machine learning differentiates between, respectively, tinnitus (N = 153) vs. controls (N = 264), pain (N = 78) vs. controls (N = 264), Parkinson disease (N = 31) vs. controls (N = 264), and depression (N = 15) vs. controls (N = 264). dACC dorsal anterior cingulate cortex, sgACC subgenual anterior cingulate cortex, INS insula, PHC parahippocampus, AUD auditory cortex, So somatosensory cortex, Mo motor cortex, PCC posterior cingulate cortex, θ theta, α alpha, β beta, γ gamma
Fig. 4
Fig. 4
Support vector machine learning differentiates between thalamocortical dysrhythmia disorder (N = 277) including tinnitus, pain, Parkinson, and depression vs. healthy controls subjects (N = 264). dACC dorsal anterior cingulate cortex, sgACC subgenual anterior cingulate cortex, INS insula, PHC parahippocampus, AUD auditory cortex, So somatosensory cortex, Mo motor cortex, PCC posterior cingulate cortex, θ theta, β beta, γ gamma
Fig. 5
Fig. 5
Conjunction analysis between tinnitus, pain, Parkinson’s, and depression after the subtraction of the healthy controls shows a significant increase in the dorsal anterior cingulate cortex and parahippocampal area for the beta frequency band. dACC dorsal anterior cingulate cortex, PHC parahippocampus
Fig. 6
Fig. 6
Radar plot of presence of cross-frequency coupling in the auditory cortex, somatosensory cortex, motor cortex, subgenual anterior cingulate cortex, and the dorsal anterior cingulate cortex for theta–beta and theta–gamma coupling using Pearson correlations. An asterisk indicates if the CFC for a specific disorder is significantly different in comparison to all other disorders and healthy control subjects after Bonferroni correction (p < 0.05). The figure demonstrates the presence of theta–gamma (red line) and theta–beta (black line) coupling for tinnitus in the auditory cortex (upper left panel), for pain in the somatosensory (upper right panel) and motor cortices (mid left panel), and Parkinson’s disease in the motor cortex (mid left panel). For the dorsal anterior cingulate (lower left panel) and subgenual anterior cingulate cortices (mid right panel), an increased coupling between theta–gamma and theta–beta oscillations is identified that is not related to the specific neurological/neuropsychiatric disorder, but likely has a more non-specific general role. y-axis represent Pearson correlation r score
Fig. 7
Fig. 7
Power to power cross-frequency coupling for each disorder (i.e., tinnitus (N = 153), pain (N = 78), PD (N = 31), and depression (N = 15)) and healthy control subjects (N = 264). This plot represents the cross-correlation between spectral amplitudes at different frequencies (2–44 Hz). No differences were obtained when comparing the different disorders and the healthy controls
Fig. 8
Fig. 8
Summary figure. Spatial distribution of theta–beta and theta–gamma cross-frequency coupling as related to different thalamocortical dysrhythmia syndromes

Similar articles

Cited by

References

    1. Buzsaki G, Draguhn A. Neuronal oscillations in cortical networks. Science. 2004;304:1926–1929. doi: 10.1126/science.1099745. - DOI - PubMed
    1. Llinas R, Ribary U, Contreras D, Pedroarena C. The neuronal basis for consciousness. Philos. Trans. R. Soc. Lond. B. Biol. Sci. 1998;353:1841–1849. doi: 10.1098/rstb.1998.0336. - DOI - PMC - PubMed
    1. Buzsaki G, Logothetis N, Singer W. Scaling brain size, keeping timing: evolutionary preservation of brain rhythms. Neuron. 2013;80:751–764. doi: 10.1016/j.neuron.2013.10.002. - DOI - PMC - PubMed
    1. Freeman WJ. A cinematographic hypothesis of cortical dynamics in perception. Int. J. Psychophysiol. 2006;60:149–161. doi: 10.1016/j.ijpsycho.2005.12.009. - DOI - PubMed
    1. Llinas RR. The intrinsic electrophysiological properties of mammalian neurons: insights into central nervous system function. Science. 1988;242:1654–1664. doi: 10.1126/science.3059497. - DOI - PubMed

Publication types