. 2018 Mar 16;9(1):1102.
doi: 10.1038/s41467-018-03495-3.

Calcineurin-mediated IL-2 production by CD11chighMHCII+ myeloid cells is crucial for intestinal immune homeostasis

Affiliations

Calcineurin-mediated IL-2 production by CD11chighMHCII+ myeloid cells is crucial for intestinal immune homeostasis

Andrea Mencarelli et al. Nat Commun. .

Abstract

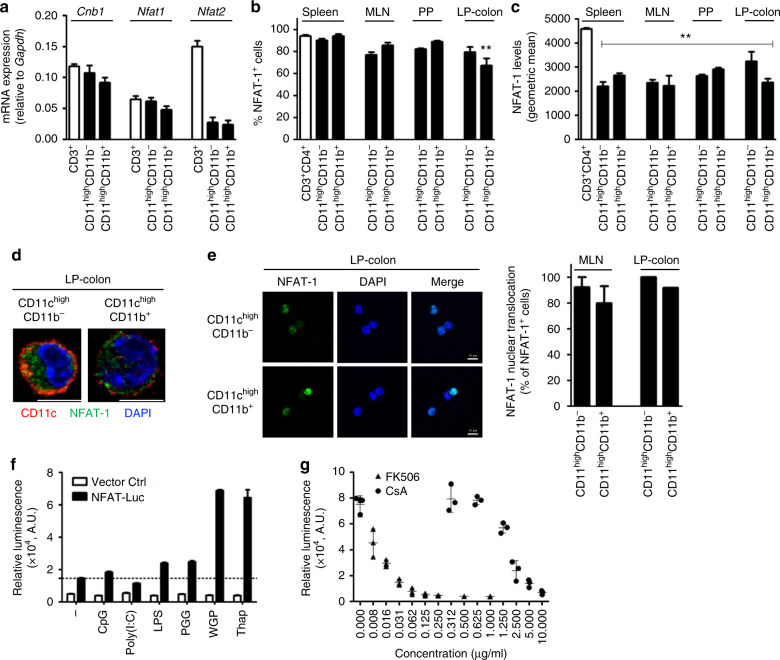
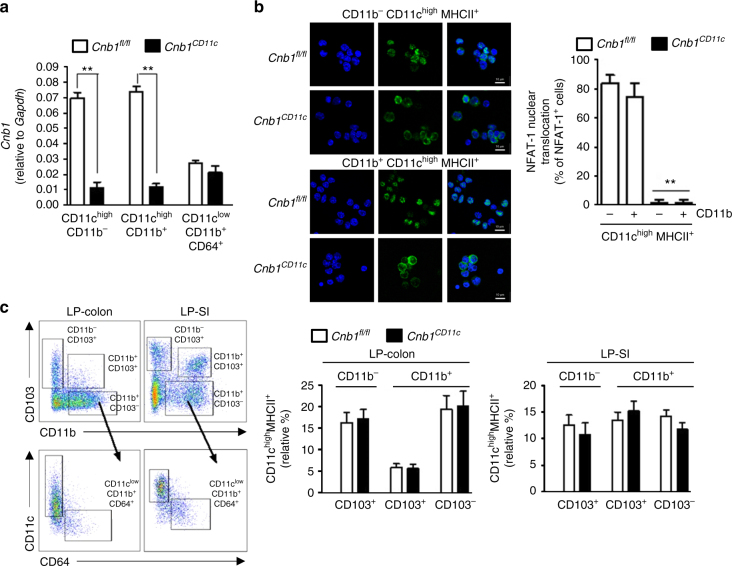
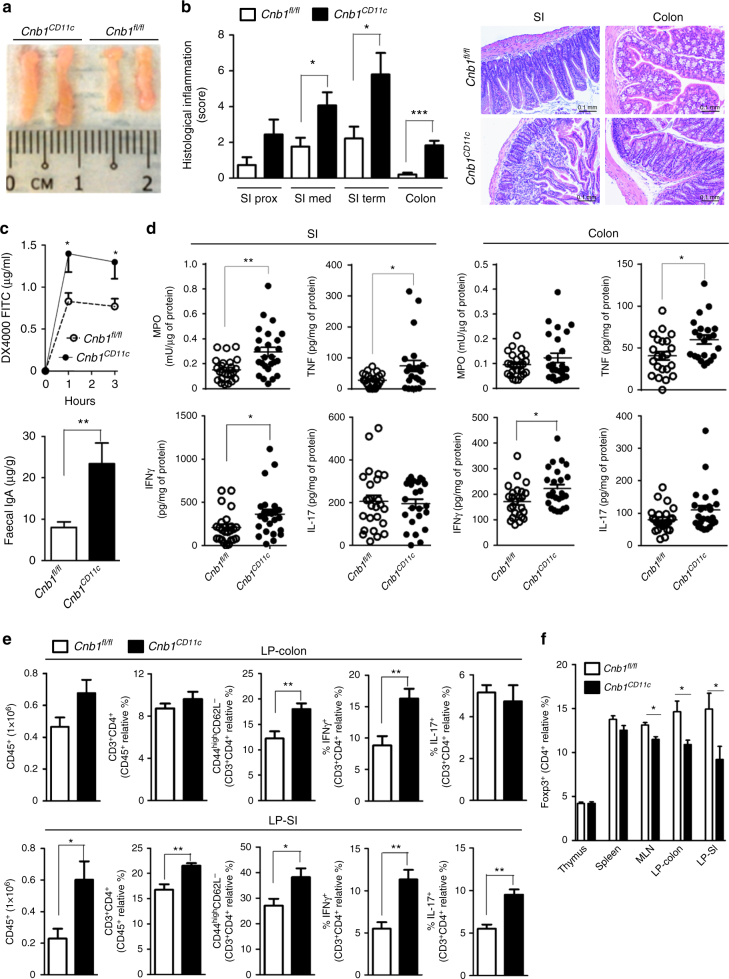
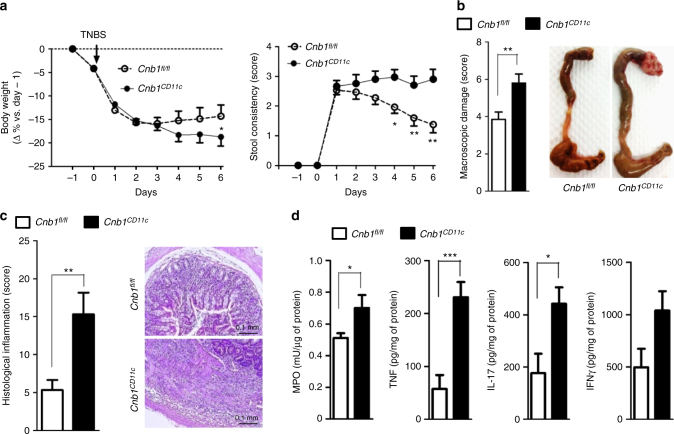
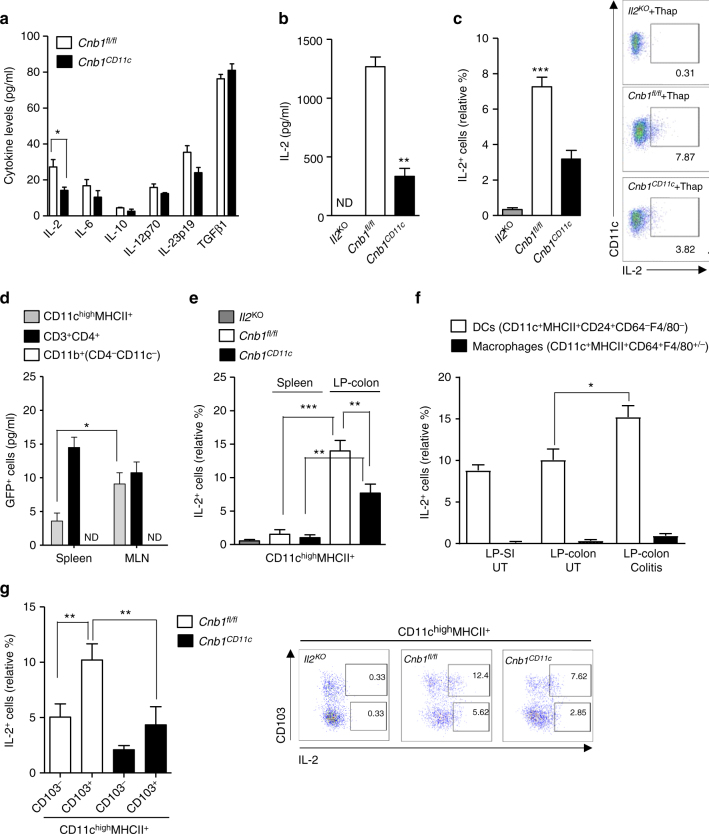
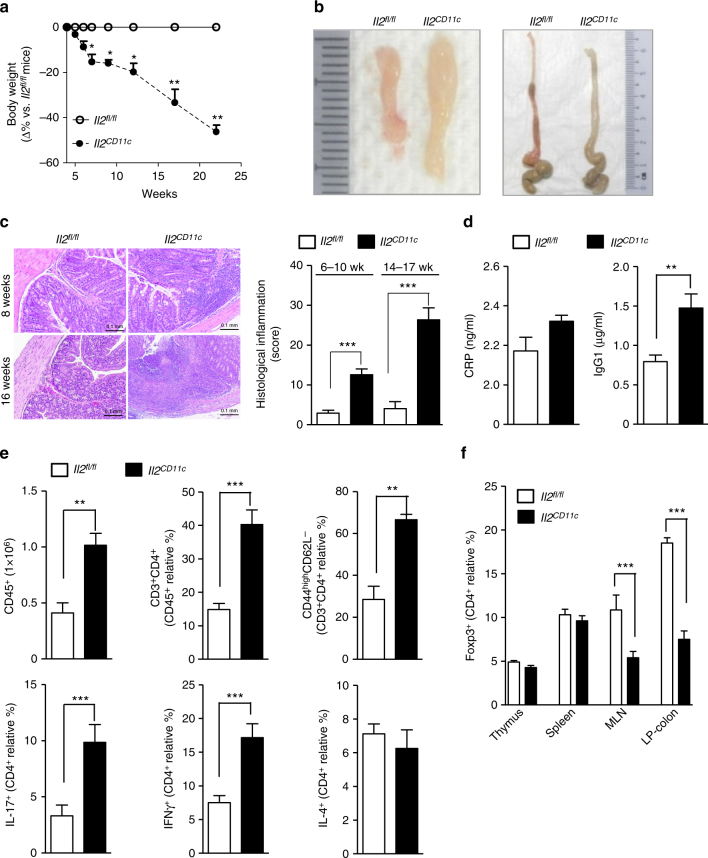
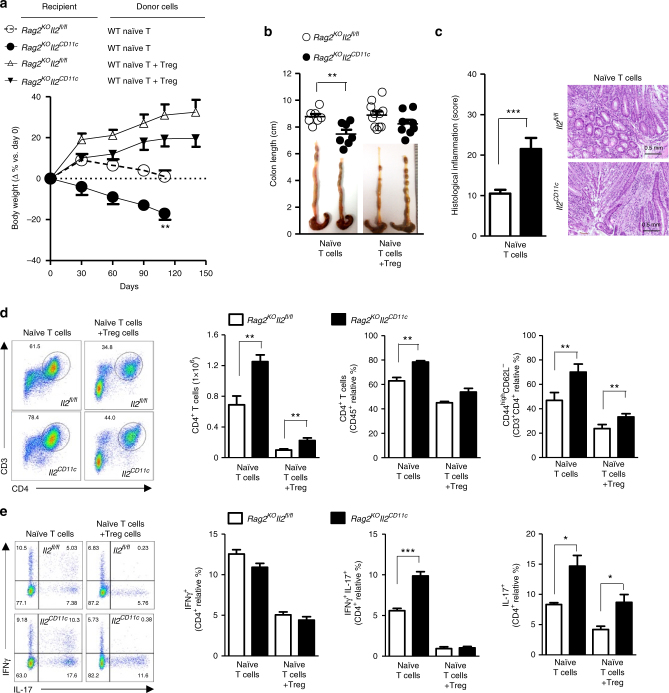
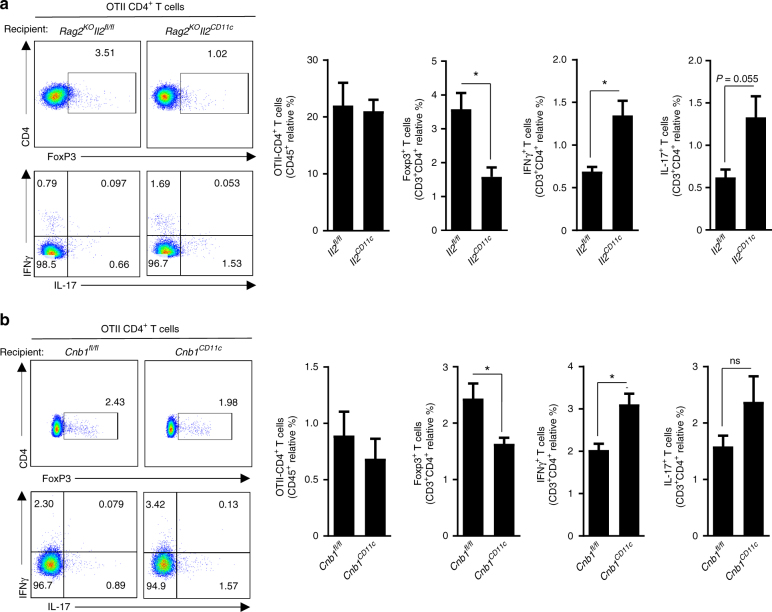
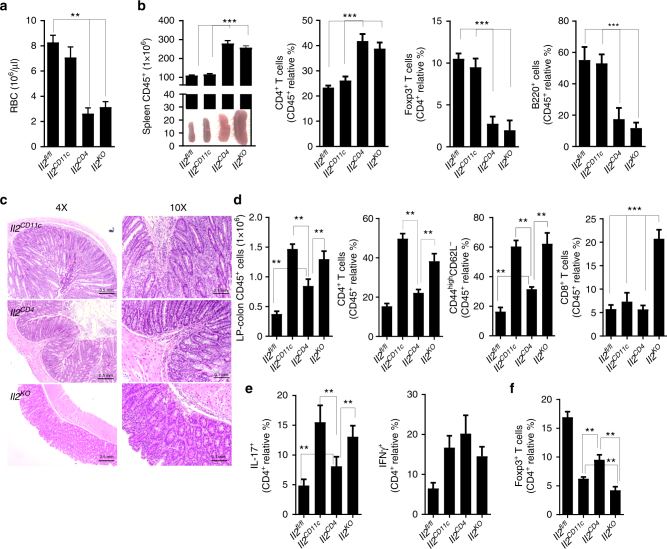
The intestinal immune system can respond to invading pathogens yet maintain immune tolerance to self-antigens and microbiota. Myeloid cells are central to these processes, but the signaling pathways that underlie tolerance versus inflammation are unclear. Here we show that mice lacking Calcineurin B in CD11chighMHCII+ cells (Cnb1 CD11c mice) spontaneously develop intestinal inflammation and are susceptible to induced colitis. In these mice, colitis is associated with expansion of T helper type 1 (Th1) and Th17 cell populations and a decrease in the number of FoxP3+ regulatory T (Treg) cells, and the pathology is linked to the inability of intestinal Cnb1-deficient CD11chighMHCII+ cells to express IL-2. Deleting IL-2 in CD11chighMHCII+ cells induces spontaneous colitis resembling human inflammatory bowel disease. Our findings identify that the calcineurin-NFAT-IL-2 pathway in myeloid cells is a critical regulator of intestinal homeostasis by influencing the balance of inflammatory and regulatory responses in the mouse intestine.


Conflict of interest statement

The authors declare no competing interests.

Figures

Fig. 1
Fig. 1
Calcineurin B and NFAT expression in mouse intestinal myeloid cells. a Relative expression levels of Cnb1, Nfat1, and Nfat2 mRNAs in intestinal CD11chighMHCII+ cells (CD11b+ and CD11b) and MLN CD3+ T cells, assessed by qRT-PCR. Data represent the means ± standard error of three experiments (n ≥ 7 mice/exp). b, c Percentage of NFAT-1+ cells (b) and NFAT-1 protein levels (c) in CD11chighMHCII+ cells (CD11b+ and CD11b) obtained from spleen, MLN, PP, and colonic LP (LP-colon), assessed by flow cytometry. Splenic CD3+CD4+ T cells are included for comparison. Data represent the means ± standard error of three experiments (n = 4–5 mice/experiment). **P < 0.01 versus CD4+ T cells (ANOVA followed by Dunnett’s multiple comparisons test). d Representative images of NFAT-1 labeling in sorted colonic CD11chighMHCII+ cells (CD11b+ and CD11b). Scale bar 5 μm. e NFAT-1 nuclear translocation in CD11chighMHCII+ cells (CD11b+ and CD11b) after 30 min stimulation with thapsigargin (Thap; 200 nm), as assessed by confocal analysis. Data represent the means ± standard error of two experiments (n = 6–10 mice/experiment). Scale bar 5 μm. f NFAT-dependent luciferase activity measured in a DC cell line in response to TLRs (Poly I:C, LPS), dectin-1 ligands (PGG and WGP), and the calcium mobilizer thapsigargin. g Dose-dependent inhibition of NFAT nuclear translocation by cyclosporin A (CsA) and tacrolimus (FK506) in WGP-stimulated D1 cells, as assessed by NFAT-luciferase activity. AU arbitrary units, Ctrl control, Luc luciferase, LP lamina propria, LPS Lipopolysaccharide, MLN mesenteric lymph node, PGG soluble β-(1,3)-glucan, PP Peyer’s Patches, WGP whole glucan particles, Thap thapsigargin
Fig. 2
Fig. 2
Cnb1 deletion in CD11chighMHCII+ cells abrogates NFAT-1 nuclear translocation. a Cnb1 mRNA levels in DCs (CD11chighMHCII+CD11b+, CD11chighMHCII+CD11b) and macrophages (CD11clowMHCII+CD11b+CD64+) isolated from the LP-colon of Cnb1CD11c and Cnb1fl/fl mice, measured by qRT-PCR. Data represent the means ± standard error of three experiments (n = 3 mice/experiment). **P < 0.01. b Confocal microscopy analysis of NFAT-1 nuclear translocation in CD11chighMHCII+ cells (CD11b+ and CD11b) from the MLN of Cnb1CD11c and Cnb1fl/fl mice after thapsigargin stimulation for 30 min. Data represent the means ± standard error of two experiments (n = 3 mice/experiment). **P < 0.01. Scale bar 10 μm. c Representative flow cytometric analysis of intestinal LP mononuclear myeloid CD11c+ cells evaluated by CD11c, CD103, CD11b, and CD64 expression. Four myeloid cell subsets were identified: three DC populations, CD11chighCD103+, CD11chighCD103+CD11b+, CD11chighCD103CD11b+ and one CD11clowCD103CD11b+ macrophage population. The macrophage population was identified based on the expression of CD64 within the CD11clowCD103CD11b+ population (CD11clow CD64+). The frequency of the four different myeloid subsets in LP-colon (left) and LP-SI (right) of Cnb1CD11c and Cnb1fl/fl mice is shown. Data represent the means ± standard error of three experiments (n = 2–3 mice/group per experiment, aged 8–12 weeks). LP lamina propria, SI small intestine
Fig. 3
Fig. 3
Cnb1CD11c mice exhibit high intestinal permeability and inflammation. a MLN from Cnb1CD11c and Cnb1fl/fl mice. b Histological inflammation index of proximal (prox; n = 15–20 mice), medial (med; n = 22–27 mice), and terminal (term; n = 20–25 mice) small intestine (SI) and colon (n = 24–29 mice) in Cnb1CD11c and Cnb1fl/fl mice. *P < 0.05, ***P < 0.0001. Representative images of H&E-stained terminal ileum (SI) and colon sections from Cnb1CD11c and Cnb1fl/fl mice (×10 magnification). Scale bar 0.1 mm. c Intestinal permeability of Cnb1CD11c and Cnb1fl/fl mice was assessed by measuring the FITC-dextran concentration in the plasma after FITC-dextran administration by oral gavage (upper panel). *P < 0.05. IgA levels in the fecal content of colons from Cnb1CD11c and Cnb1fl/fl mice (lower panel). **P < 0.01. Data shown are from three independent experiments (n = 5–8 mice/group per experiment). d Myeloperoxidase, TNF, IFNγ, and IL-17 levels in terminal SI and colon tissue homogenates from Cnb1CD11c and Cnb1fl/fl mice, assessed by ELISA. Data shown are from four experiments (n = 5–6 mice/group per experiment). *P < 0.05, **P < 0.01. e Leukocyte abundance and population composition in the SI and colonic LP of Cnb1CD11c and Cnb1fl/fl mice. Data represent the mean number of CD45+ LP mononuclear cells obtained from each colon or SI, the total percentage of CD4+ T cells, the percentage of antigen-experienced CD4+ T cells (CD44highCD62Lneg), and of CD4+ T cells producing IL-17 or IFNγ. Data represent the means ± standard error of 7–9 experiments (n = 5–7 mice/group per experiment). *P < 0.05, **P < 0.01. f Percentage of FoxP3+ CD4+ T cells in the thymus, spleen, MLN, LP-colon, and LP-SI of Cnb1CD11c and Cnb1fl/fl mice. Data represent the means ± standard error of 3–6 experiments (n = 3–6 mice/group). *P < 0.05. DX4000 4 kDa dextran, FITC fluorescein isothiocyanate, LP lamina propria, MLN mesenteric lymph node, MPO myeloperoxidase
Fig. 4
Fig. 4
Exacerbation of acute and chronic colitis in Cnb1CD11c mice. a Severity of TNBS-induced colitis evaluated according to weight loss (left panel) and stool consistency (right panel) in Cnb1CD11c and Cnb1fl/fl mice. b Macroscopic index (left) and overt anatomy of the colon (right) and c histological inflammation score for colons of Cnb1CD11c and Cnb1fl/fl mice after TNBS administration. Representative H&E-stained colon sections showing infiltrating leukocytes (×10 magnification, scale bar 0.1 mm). d Levels of inflammatory markers (MPO, TNF, IL-17, and IFNγ) in total colon homogenates from Cnb1CD11c and Cnb1fl/fl mice. All data represent the means ± standard error of two experiments (n = 6–7 mice/group per experiment). *P < 0.05, ***P < 0.001. TNBS trinitrobenzenesulfonic acid, MPO myeloperoxidase
Fig. 5
Fig. 5
Calcineurin-NFAT signaling in CD11c+MHCIIhigh myeloid cells regulates IL-2 synthesis. a CD11chighMHCIIhighCD11b cells sorted from MLN of Cnb1CD11c and Cnb1fl/fl mice were stimulated with thapsigargin for 16–20 h. Cytokine levels were measured in the culture supernatants using Luminex technology. Data represent the means ± standard error of three experiments (n = 10 mice/group per experiment). *P < 0.05. b, c IL-2 production from bone marrow-derived DCs of Il2KO, Cnb1CD11c, and Cnb1fl/fl mice in response to thapsigargin stimulation for 16 h, as assessed by ELISA (b) and by intracellular labeling (c). Data represent the means ± standard error of three experiments (n = 1–2 mice/group; mice aged 6–7 weeks old). **P < 0.01, ***P < 0.001. d GFP (corresponding to IL-2) expression in CD11chighMHCII+ cells, CD3+CD4+ T cells, and total myeloid CD11b+ (CD4CD11c) cells isolated from the spleen and MLN of IL-2-GFP reporter mice. Data represent the means ± standard error of four experiments (n ≥ 3 mice/group). *P < 0.05. e Intracellular IL-2 labeling of colonic CD3CD11chighMHCII+ cells from Il2KO, Cnb1fl/fl and Cnb1CD11c mice. Data are presented as the relative percentage of IL-2+ cells and represent the means ± standard error of five experiments (n = 3–4 mice/group per experiment). **P < 0.01, ***P < 0.001. f Percentage of IL-2+ cells in intestinal DC (CD45+LinCD3CD11c+MHCII+CD24+CD64F4/80) and macrophage (CD45+LinCD3CD11c+MHCII+CD24CD64+F4/80+/−) populations in LP-colon and LP-small intestine of Cnb1fl/fl mice at steady state, or during colitis induced in immunocompromised Rag1KO mice by adoptive transfer of naïve CD4+ T cells (CD45RBhighCD62L+CD44CD25) isolated from the spleens of C57BL/6 mice. Data represent the means ± standard error of three experiments (5–6 mice/group). g IL-2 expression in CD103 and CD103+ CD11chighMHCII+ cells from colons of Cnb1fl/fl and Cnb1CD11c mice. Representative dot plots of IL-2 labeling in colonic CD3CD11chighMHCII+ cells are shown. Data represent the means ± standard error of three experiments (n = 2–5 mice/group per experiment). *P < 0.05. KO knockout, LP lamina propria, MLN mesenteric lymph node, SI small intestine, Thap thapsigargin, UT untreated, ND not detected
Fig. 6
Fig. 6
Th1/Th17-cell expansion and Treg-cell contraction in the gut of Il2CD11c mice. a Change in body weight (expressed as Δ percentage relative to the mean weight of the control group) in Il2CD11c mice compared to Il2fl/fl mice. Data represent the means ± standard error (n = 20 mice/group). *P < 0.05, **P < 0.01. b Representative images of the MLN (left) and colons (right) from Il2CD11c and Il2fl/fl mice aged 10 weeks old. c H&E staining of colon sections showing massive leukocyte infiltration in Il2CD11c compared to Il2fl/fl mice (×10 magnification, scale bar 0.1 mm). Histological inflammation index of the colon was also evaluated over time. Data represent the means ± standard error (14 mice/group aged 6–10 weeks old, and 6 mice/group aged 14–17 weeks old). ***P < 0.001. d Plasma levels of C-reactive protein (CRP) and IgG1 in the sera of Il2CD11c and Il2fl/fl mice. Data represent the means ± standard error (5–7 mice/group). **P < 0.01. e Immune phenotype of LP-colon mononuclear cells from Il2CD11c and Il2fl/fl mice. Data represent the means ± standard error of the total number of mononuclear cells obtained from the LP, the percentage of total and antigen-experienced CD44highCD62L- CD4+ T cells, and the proportion of CD4+ T cells producing IL-17, IFNγ or IL-4. f Frequency of FoxP3+ Treg cells in thymus, spleen, MLN, and LP-colon isolated from Il2CD11c and Il2fl/fl mice. Data represent the means ± standard error of 3–4 experiments (n = 2–4 mice/group per experiment, aged 6–10 weeks). **P < 0.01, ***P < 0.001. LP lamina propria, MLN mesenteric lymph node
Fig. 7
Fig. 7
DC-derived IL-2 suppresses pathogenic CD4+ T-cell expansion in the intestine. a Change in body weight and b severity of colitis based on colon length of Il2CD11c and Il2fl/fl, Rag2 knockout (KO) mice (Rag2KOIL-2fl/fl and Rag2KOIL-2CD11c mice) adoptively transferred with naïve CD4+ T cells either alone or in combination with Treg cells isolated from spleens of C57BL/6 mice. Representative pictures of colons after adoptive T-cell transfer are shown. Data represent the means ± standard error of two experiments (n = 2–5 mice/group per experiment). **P < 0.01. c Histological inflammatory score based on H&E staining of colon sections (×10 magnification, scale bar 0.5 mm) obtained from Rag2KOIl2fl/fl and Rag2KOIl2CD11c mice after 110 days of naïve CD4+ T-cell transfer. Data represent the means ± standard error. ***P < 0.001. d, e Phenotypic analysis of colonic lamina propria CD4+ T cells evaluated 110 days after adoptive T-cell transfer. The total number and the relative percentage of total and activated CD4+ T cells (d), as well as the proportions of CD4+ T cells producing IL-17, IFNγ or both (e) are shown. *P < 0.05, **P < 0.01, ***P < 0.001. All data represent the means ± standard error of two experiments (n = 3–4 mice/group per experiment)
Fig. 8
Fig. 8
Il2 or Cnb1 deficiency in DCs causes a dysregulated T-cell response. a, b Naïve congenic OTII cells were sorted from spleens of donor mice and transferred intravenously into Rag2KOIl2fl/fl and Rag2KOIl2CD11c (a) or Cnb1CD11c and Cnb1fl/fl mice (b). After 24 h, mice were administered OVA protein antigen by daily oral gavage for 5 days. The frequencies of CD4+ T cells expressing FoxP3, IL-17, and IFNγ were examined in the mesenteric lymph node 7 days after adoptive cell transfer. Representative FACS plots of OTII donor CD4+ T cells are shown (left panels). Data represent the means ± standard deviation of two experiments (n = 1–2 mice/group). *P < 0.05 (two-tailed, unpaired Student’s t test)
Fig. 9
Fig. 9
Systemic and intestinal immune homeostasis in Il2CD11c and Il2CD4 mice. a RBC count and b total number of splenocytes and proportion of CD4+ T cells, FoxP3+ Treg cells, and B220+ B cells in spleens of Il2fl/fl, Il2CD11c, and Il2CD4 mice. Representative images of spleens are shown. Data represent the means ± standard error of 2–6 experiments (n = 2–3 mice/group per experiment, 6–13 weeks old). **P < 0.01, ***P < 0.001. c Representative images of H&E-stained colon sections (×4 magnification, scale bar 0.5 mm; ×10 magnification, scale bar 0.1 mm) from Il2CD11c, Il2CD4, and Il2KO mice. d Total LP-colon leukocyte number and percentage of total and activated (CD44highCD62L) CD4+ T cells, and B cells. e, f Percentage of IFNγ- and IL-17-producing CD4+ T cells, and FoxP3+ Treg cells obtained from the LP-colon of Il2fl/fl, Il2CD11c, Il2CD4, and Il2KO mice. Data represent the means ± standard error of 2–4 experiments (n = 2–3 mice/group per experiment, 9–13 weeks old). **P < 0.01, ***P < 0.001. LP lamina propria, RBC red blood cells

Similar articles

Cited by

References

    1. Kaplan GG. The global burden of IBD: from 2015 to 2025. Nat. Rev. Gastroenterol. Hepatol. 2015;12:720–727. doi: 10.1038/nrgastro.2015.150. - DOI - PubMed
    1. Mowat AM, Agace WW. Regional specialization within the intestinal immune system. Nat. Rev. Immunol. 2014;14:667–685. doi: 10.1038/nri3738. - DOI - PubMed
    1. Joeris T, Muller-Luda K, Agace WW, Mowat AM. Diversity and functions of intestinal mononuclear phagocytes. Mucosal Immunol. 2017;10:845–864. doi: 10.1038/mi.2017.22. - DOI - PubMed
    1. Fric J, et al. NFAT control of innate immunity. Blood. 2012;120:1380–1389. doi: 10.1182/blood-2012-02-404475. - DOI - PubMed
    1. Zelante T, et al. CD103(+) dendritic cells control Th17 cell function in the lung. Cell Rep. 2015;12:1789–1801. doi: 10.1016/j.celrep.2015.08.030. - DOI - PubMed

Publication types

MeSH terms

LinkOut - more resources