. 2018 Mar 16;8(1):4741.
doi: 10.1038/s41598-018-23051-9.

Function-specific and Enhanced Brain Structural Connectivity Mapping via Joint Modeling of Diffusion and Functional MRI

Affiliations

Function-specific and Enhanced Brain Structural Connectivity Mapping via Joint Modeling of Diffusion and Functional MRI

Shu-Hsien Chu et al. Sci Rep. .

Abstract

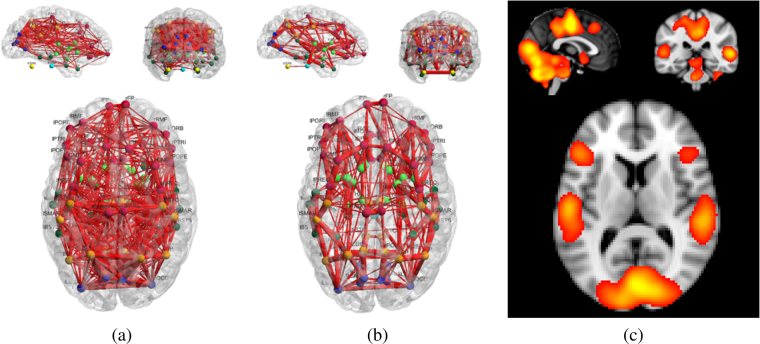
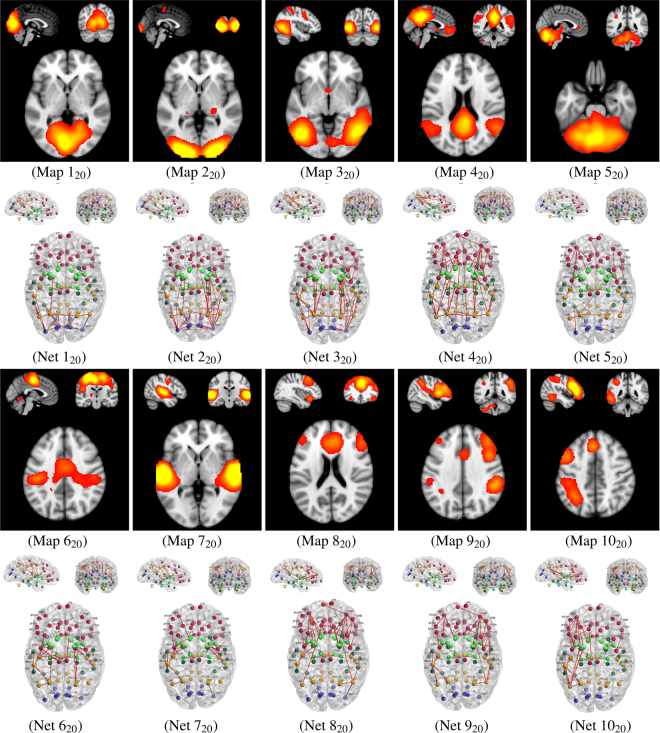
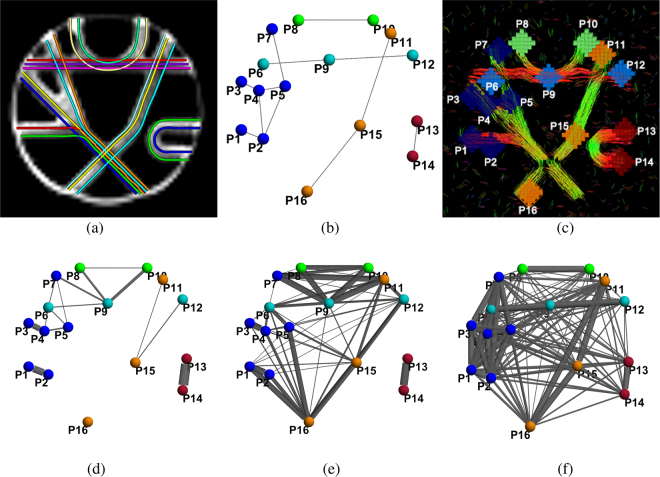
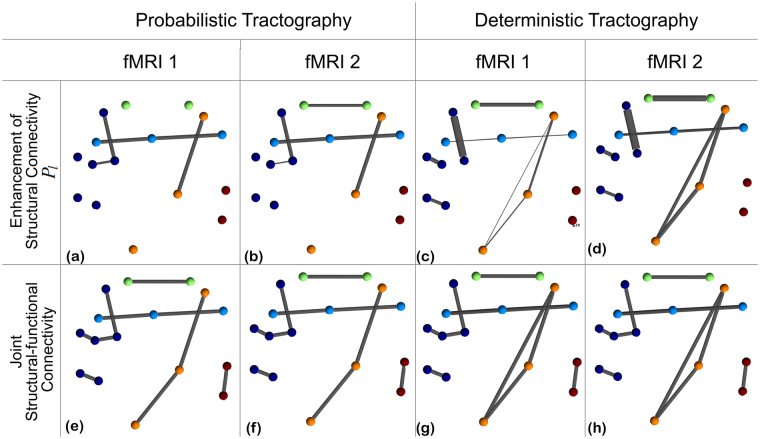
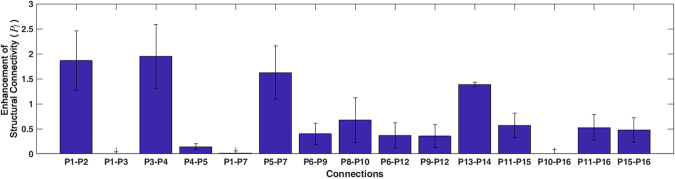
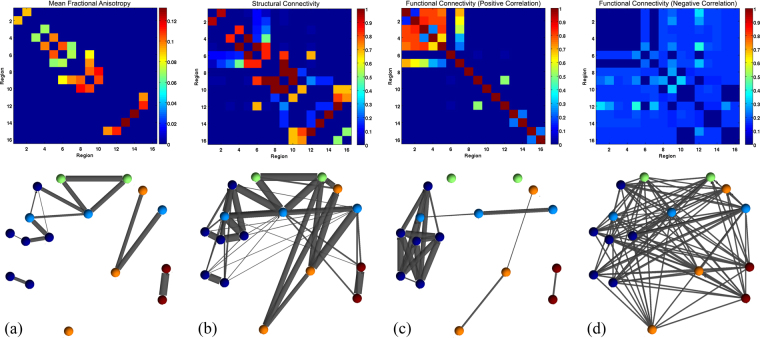
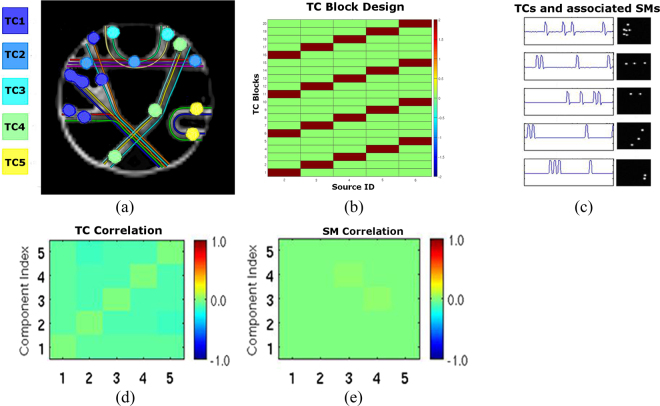
A joint structural-functional brain network model is presented, which enables the discovery of function-specific brain circuits, and recovers structural connections that are under-estimated by diffusion MRI (dMRI). Incorporating information from functional MRI (fMRI) into diffusion MRI to estimate brain circuits is a challenging task. Usually, seed regions for tractography are selected from fMRI activation maps to extract the white matter pathways of interest. The proposed method jointly analyzes whole brain dMRI and fMRI data, allowing the estimation of complete function-specific structural networks instead of interactively investigating the connectivity of individual cortical/sub-cortical areas. Additionally, tractography techniques are prone to limitations, which can result in erroneous pathways. The proposed framework explicitly models the interactions between structural and functional connectivity measures thereby improving anatomical circuit estimation. Results on Human Connectome Project (HCP) data demonstrate the benefits of the approach by successfully identifying function-specific anatomical circuits, such as the language and resting-state networks. In contrast to correlation-based or independent component analysis (ICA) functional connectivity mapping, detailed anatomical connectivity patterns are revealed for each functional module. Results on a phantom (Fibercup) also indicate improvements in structural connectivity mapping by rejecting false-positive connections with insufficient support from fMRI, and enhancing under-estimated connectivity with strong functional correlation.


Conflict of interest statement

The authors declare no competing interests.

Figures

Figure 1
Figure 1
A brain network characterizes the connectivity of regions of interest (Panel (a)) by measuring, for example, the number of tractography streamlines between a pair of regions, or the correlation coefficients between fMRI signals at these locations (Panel (b)). The cortical parcellation (Panel (a)) was generated from a representative HCP dataset using FreeSurfer [http://surfer.nmr.mgh.harvard.edu/]. In this work, all network representations, such as shown in Panel (b), are generated using BrainNet.
Figure 2
Figure 2
The fMRI signal can be decomposed and represented using basis functions (e.g., ICA components, or “modes”) such as the red and blue signals in panel (a). As shown in panel (b), since regions involved in the same brain function display similar fMRI time courses (blue or red), strong correlations will identify function-specific circuits. Panel (c) shows an example of possible underlying structural network which can support both red and blue “functions”. The proposed joint model combines information from functional and structural connectivity, and can extract the full anatomical sub-networks associated with each function (Panels (d) and (e)).
Figure 3
Figure 3
Illustration of constraints enforcing specific relationships between the input data and the unknowns: Panel (a) illustrates the link capacity constraint, formulated in Eq. (1). It indicates that the amount of information which can be delivered through a connection l is limited by its anatomical strength (i.e., the connection at the top can deliver more information between ROI1 and ROI2). Panel (b) illustrates the node demand constraint, formulated in Eq. (2). It states that the fMRI signal is the origin/consequence of sufficient amount of information sent/received at a node through all its associated connections. Panel (c) illustrates the feasibility constraint, formulated in Eq. (3). It ensures that information flow is delivered among nodes with sufficient functional activation (i.e., the flow between ROI1 and ROI2 can not exceed the blue functional activation).
Figure 4
Figure 4
Consistency of the top (strongest) structural-functional connections of the language processing areas, estimated using the proposed information flow model is shown in panels a (top 5), b (top 10), c (top 15) and d (top 20). The graphs are generated by selecting the top 5, 10, 15 and 20 connections from each individual subject. The edges’ width, for each connection, represents the consistency across subjects, i.e., the frequency of identification across all subjects for a given threshold (5, 10, 15, 20): The thicker the edge is, the more consistently the link is identified as a top-ranked connection across individuals. The nodes color represents the anatomical location: red for frontal, orange for parietal, blue for occipital, green for temporal, bright green for sub-cortical, yellow for cerebellum and bright blue for brainstem. Abbreviations for region labels are provided in Table S1 (Supplementary Material).
Figure 5
Figure 5
Top 20 (a) and 50 (b) structural-functional connections of the language processing areas, with the strongest mean normalized connectivity (across subjects). Networks are estimated using the proposed information flow model. Edges’ width is proportional to mean connectivity value across subjects. The color code and labels are identical to Fig. 4.
Figure 6
Figure 6
Resting-State Circuits estimated from the 25 HCP subjects using correlation-based functional connectivity (a) and the proposed joint structural-functional model (b). The structural connectivity information depicted in Fig. S1 (Supplementary Material) was used to generate results in panel (b). Additionally, an aggregate of the resting-state activation maps, obtained from ICA analysis of data from the BrainMap database, is shown in panel (c) as a reference. In panels (a) and (b), the edges’ width represents the frequency of occurrence across subjects, for the 100 strongest connections. In panel (b), the network shown is an aggregate of all brain circuits corresponding to the 10 ICA components (i.e., ICA modes) shown in Fig. 7.
Figure 7
Figure 7
Resting-state structural-functional networks (e.g., Net 120), for the ten most reliably identified resting-state spatial maps (e.g., Map 120) using a 20-dimensional ICA decomposition of the BrainMap data: Each map and network correspond to a major brain function (following the naming convention from Smith et al.). We show results for the visual network (Maps and Nets 120, 220 and 320), default mode network (Map and Net 420), cerebellum network (Map and Net 520), sensorimotor network (Map and Net 620), auditory network (Map and Net 720), executive control network (Map and Net 820) and frontoparietal network (Maps and Nets 920 and 1020). All spatial maps (i20) were converted to z statistics using a mixture-model fit and thresholded between Z = 1.5 and Z = 5, and the structural-functional networks represent the corresponding brain circuits generated by our proposed method. The edges’ width represents the frequency of occurrence of the strongest connections across the 25 subjects.
Figure 8
Figure 8
Fibercup structural and simulated functional connectivity: Panel (a) shows the ground truth fibers and panel (b) shows the corresponding ground truth structural network, with endpoints (nodes) Px sharing the same color if they belong to the same sub-network. Panel (c) illustrates results obtained using deterministic tractography and panel (d) shows the corresponding structural network. Panel (e) shows another structural network, obtained from probabilistic tractography. Panel (f) shows the functional network, obtained from simulated fMRI data (see text and Fig. S5 in Supplementary Material). The edges’ width represents streamlines count in panels (d and e), and magnitude of fMRI correlation in panel (f). Panel (a) is adapted from Fig. 4 in Fillard et al..
Figure 9
Figure 9
Circuits estimated using the proposed joint structural-functional network model with two different realizations of the fMRI signal (fMRI 1: top row from Fig. S5; fMRI 2: bottom row from Fig. S5 in Supplementary Material). Despite the variation in the fMRI data, results are very similar for each tractography method. Networks in the top row illustrate the incremental connectivity for connections that are under-estimated by tractography analysis only (e.g., P5-P7). Networks in the bottom row demonstrate the joint networks obtained from the proposed scheme, that correctly estimates nearly all connections from the ground truth data.
Figure 10
Figure 10
Enhancement of structural connectivity: Mean and standard deviation of the correction parameter (Pl in Table 1) for under-estimated structural connectivity of each link. These results were generated using deterministic tractography and 100 simulated fMRI instances. Connections P5-P7, P6-P9, P8-P10, P9-P12, P11-P15 and P15-P16 are consistently enhanced.
Figure 11
Figure 11
Comparison with the Gaussian Mixture Modeling (GMM) approach by Venkataraman et al.: In this joint probabilistic model, the mean fractional anisotropy (FA) along connections (Panel a) is used as an estimate of structural connectivity, and combined with (correlation) functional connectivity (as shown in Fig. 8(f)). The probabilistic model, using the EM algorithm, determines whether each potential link is anatomically connected (Panel b) and functionally positively (Panel c) or negatively (Panel d) correlated. The top row shows connectivity matrices, while the bottom row shows corresponding network representations.
Figure 12
Figure 12
fMRI simulation for the Fibercup phantom: Five functional networks, corresponding to the structural connectivity pattern of the Fibercup phantom, were created to share similar fMRI time courses (e.g., TC1), as shown in panel (a). Nodes from the same network have the same color. A simple block design (Panel b) was used to generate BOLD signal time courses (TC) for each functional network (Panel c) by convolution with the hemodynamic function. Panels (d) and (e) show the correlations between base time courses and activation spatial maps (SM), and illustrate their independence. Panel (a) is adapted from Fig. 4 in Fillard et al..

Similar articles

Cited by

References

    1. Rubinov M, Sporns O. Complex network measures of brain connectivity: uses and interpretations. Neuroimage. 2010;52:1059–1069. doi: 10.1016/j.neuroimage.2009.10.003. - DOI - PubMed
    1. Bassett DS, Bullmore E. Small-world brain networks. The neuroscientist. 2006;12:512–523. doi: 10.1177/1073858406293182. - DOI - PubMed
    1. Sporns O. From simple graphs to the connectome: networks in neuroimaging. Neuroimage. 2012;62:881–886. doi: 10.1016/j.neuroimage.2011.08.085. - DOI - PubMed
    1. Rabinovich MI, Afraimovich VS, Bick C, Varona P. Information flow dynamics in the brain. Physics of life reviews. 2012;9:51–73. doi: 10.1016/j.plrev.2011.11.002. - DOI - PubMed
    1. Salinas E, Sejnowski TJ. Correlated neuronal activity and the flow of neural information. Nature Reviews Neuroscience. 2001;2:539–550. doi: 10.1038/35086012. - DOI - PMC - PubMed

Publication types